SEMICONDUCTOR INSIGHT
MARKET RESEARCH REPORT

Semiconductor Silicon Wafer Market

2026 to 2034
MARKET INTELLIGENCE
ACROSS KEY REGIONS
2026 EDITION
SEMICONDUCTOR MATERIALS Semiconductor Market Research

Semiconductor Silicon Wafer Market

Trends, Business Strategies 2026-2034

◷
UPDATED 15 September 2026
▤
REPORT LENGTH Detailed Report
▣
REPORT CODE 4b4ebc1f9de6
▯
FORMATS PDF

Semiconductor Silicon Wafer Market was valued at USD 14.49 billion in 2025 and is projected to reach USD 25.69 billion by 2033, exhibiting a CAGR of 8.7% during the forecast period.

Get the sample PDF with study scope, segmentation and methodology details.

Key Statistics

2025 Market Size
USD 14.49 billion
2034 Projected Market Size
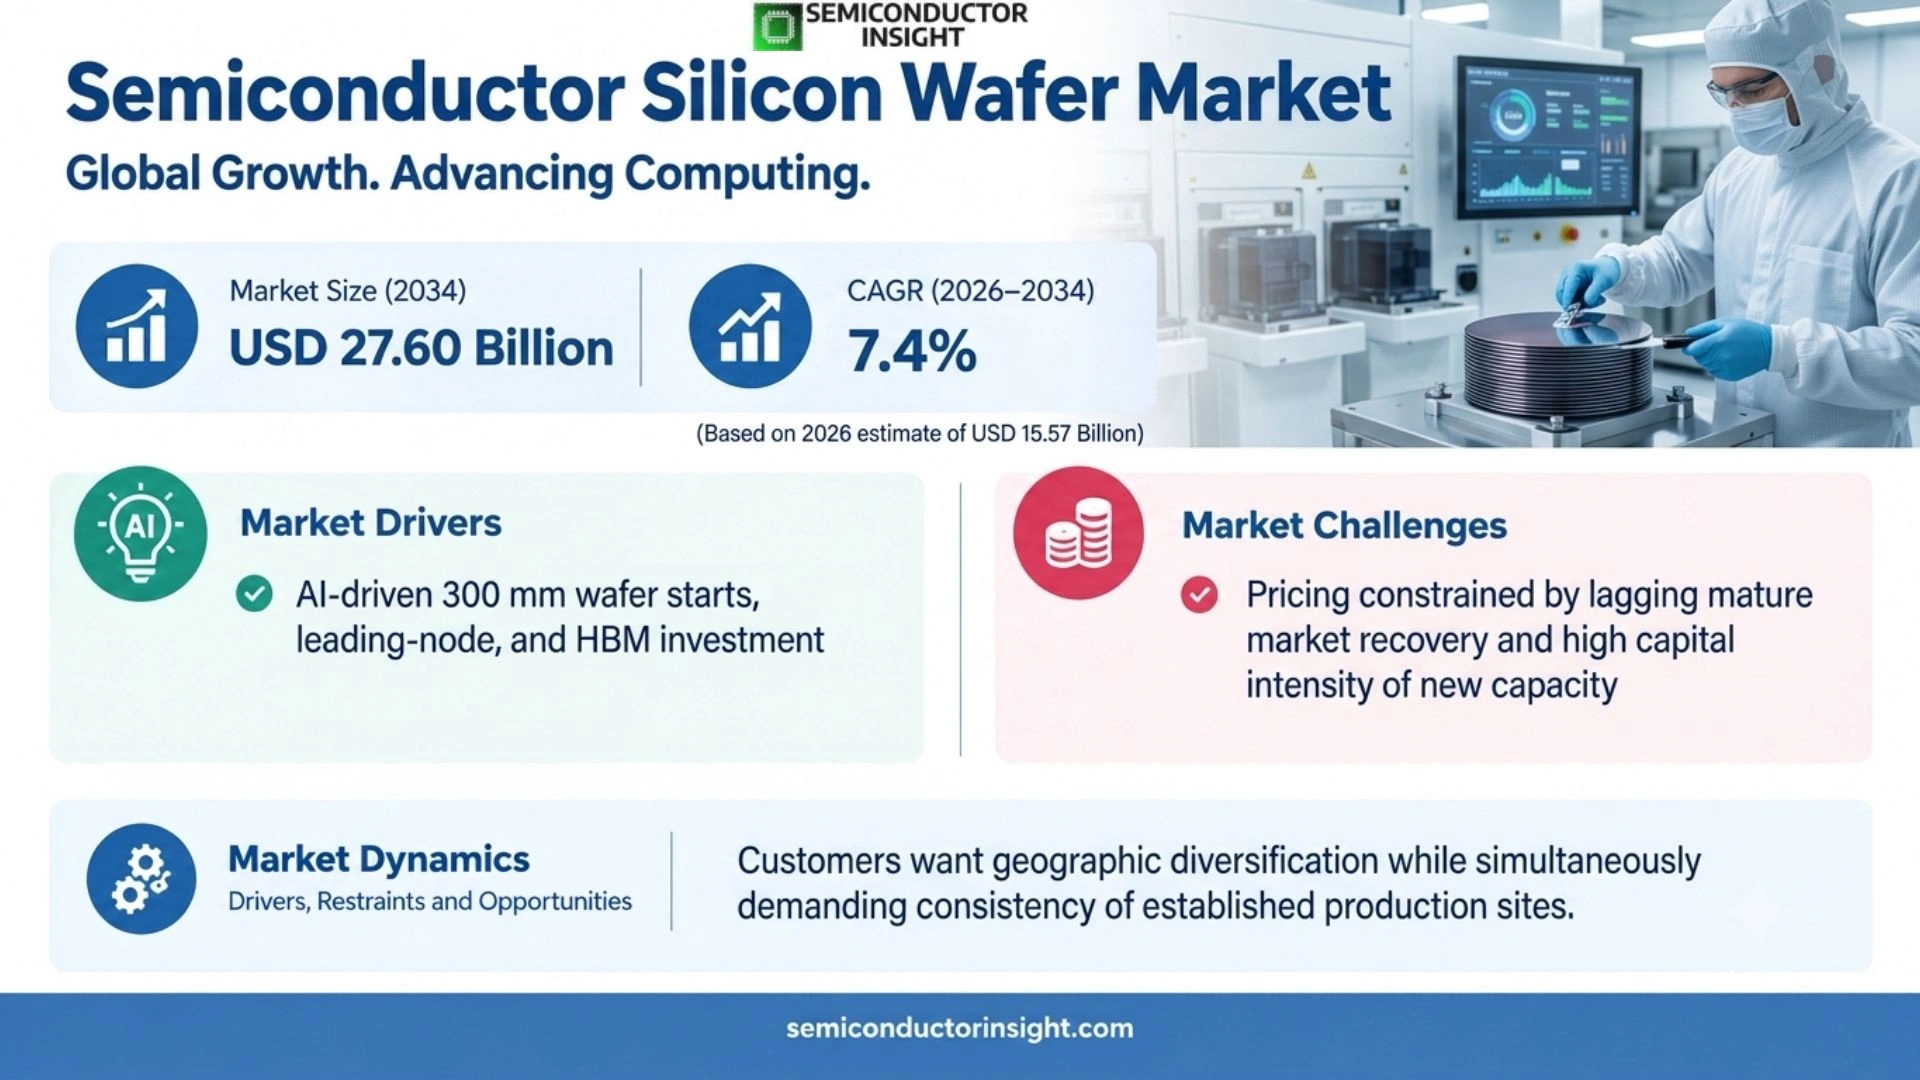
USD 27.60 billion
CAGR (2026–2034)
7.4%
Largest Market in 2025
Asia Pacific

Key Takeaways

  • 300 mm wafers are the dominant type in the source page because leading-edge logic, DRAM, NAND and HBM fabs are standardized around large-diameter substrates that improve die economics and support high-volume processing.
  • Memory is the leading application identified on the source page, with AI-driven HBM demand creating a particularly strong pull for advanced polished 300 mm wafers even while conventional PC and smartphone demand remains more uneven.
  • Foundries are the dominant end-user segment in the source page because fabless chip companies outsource wafer fabrication; their qualification requirements make surface quality, lot consistency and long-term allocation central purchasing criteria for substrate suppliers.
  • Asia Pacific leads the market structurally. The U.S. Department of Commerce stated in 2024 that approximately 90% of silicon wafers were sourced from East Asia, while SEMI continues to report the strongest 300 mm momentum around advanced logic and memory.
  • The recovery is two-speed. SEMI reported 2025 wafer shipments up 5.8% to 12,973 million square inches while revenue fell 1.2% to USD 11.4 billion, showing that physical volume can improve before pricing and mature-node demand fully normalize.

Semiconductor Silicon Wafer Market Overview

Semiconductor silicon wafer market is rebased to USD 14.49 billion in 2025, increases to an estimated USD 15.57 billion in 2026, and is projected to reach USD 27.60 billion by 2034. The two source-page size anchors imply a 7.4% CAGR during 2026–2034. Asia Pacific is the largest market in 2025, while current demand is being reshaped by AI-driven 300 mm wafer starts, leading-node and HBM investment, fab localization and a broadening recovery in industrial, automotive and power-device semiconductor demand.

Base year: 2025 · Estimated year: 2026 · Forecast period: 2026–2034 · Values in USD million unless stated otherwise

Semiconductor silicon wafers are ultra-flat single-crystal substrates engineered for integrated-circuit fabrication. Their value comes from controlling properties that directly affect device yield: crystal defect density, oxygen and carbon concentration, resistivity, thickness variation, edge geometry, surface roughness and particle contamination. Production requires crystal growth, ingot shaping, slicing, lapping, etching, polishing, cleaning and, for many applications, epitaxial deposition before a wafer can be qualified into a semiconductor process.

This report’s commercial center is wafer-fab qualification rather than the broader material story. A semiconductor manufacturer qualifies specific wafer diameters, dopant ranges, crystal orientations, surface finishes and production sites against its process flow, and any change can affect dozens or hundreds of downstream fabrication steps. That makes supplier switching slow and creates a different competitive dynamic from many electronic materials: a qualified wafer source gains durable account access, but must maintain exceptionally consistent quality through every market cycle.

Industry shipment data show that demand is recovering unevenly by technology. SEMI reported 2025 worldwide silicon wafer shipments of 12,973 million square inches, up 5.8%, while revenue fell 1.2% to USD 11.4 billion. In Q2 2026 shipments reached 3,573 million square inches, up 7.4% year on year and 9.1% sequentially. SEMI attributed the improvement to AI demand expanding from advanced logic and memory into power devices and photonics, while industrial and automotive markets showed signs of recovery.

Segment Analysis: By Type

By type, the source page segments the market into 300mm Wafers, 200mm Wafers, and Small Diameter Wafers (100, 150mm). 300 mm is the production standard for advanced logic and memory, while 200 mm and smaller diameters remain economically important for analog, power, MEMS, sensors, specialty devices and long-lived mature-node fabs.

Type Technical / commercial role Market position
300mm Wafers Large-diameter wafers maximize usable die area per processing cycle and are embedded in modern high-volume fabs for leading logic, DRAM, NAND and HBM. They require exceptional flatness, low defectivity and high-purity crystal control because small substrate variations can propagate into yield loss after very expensive lithography, deposition and etch sequences. Advanced epitaxial versions add another high-value process layer. Dominant type and fastest strategic investment area. SEMI reported 6% year-on-year growth in 300 mm shipments in Q1 2025 while 200 mm and smaller wafers declined, then linked subsequent 2025 growth to advanced logic, cloud infrastructure and memory. The segment benefits directly from AI and leading-node fab investment, but capacity additions still require lengthy customer qualification.
200mm Wafers The 200 mm platform supports analog, power management, automotive, MEMS, sensors and many specialty semiconductors. Existing fabs are often fully depreciated and economically efficient for mature products, so customers continue using this diameter even when new leading-edge fabs are built on 300 mm. Wafer specifications can be highly application-specific, creating stable niches for qualified suppliers. Important installed-base segment with slower cyclical recovery. SEMI’s 2025 data showed stronger momentum in 300 mm than smaller diameters, reflecting weak mature-device inventories. The commercial opportunity improves as automotive and industrial demand normalize, but pricing and utilization can remain softer than advanced 300 mm because customers have more mature process options and longer inventory cycles.
Small Diameter Wafers (100, 150mm) Smaller wafers are used in specialty discrete, sensor, research, optoelectronic and legacy processes where converting equipment to a larger diameter is not economical. Unit volumes are lower, but customers may require uncommon resistivity, orientation, thickness or surface treatments. Long product lifecycles and limited replacement tooling can make supply continuity more important than pure cost per square inch. Niche but persistent segment. Growth is limited by migration to larger diameters, yet specialty applications preserve demand because the installed fab equipment and process recipes are already qualified. Suppliers can defend margin through customization, small-lot flexibility and lifecycle support rather than competing with large 300 mm producers on scale.

Secondary segmentation: By Node Technology

The source page also divides demand into Above 28nm, 28nm–10nm, and Below 10nm. Node technology changes wafer requirements because tighter geometries amplify the cost of surface defects, local flatness variation and contamination, while mature nodes can prioritize cost, lifecycle stability and specialty electrical properties. The commercial implication is a more selective supplier landscape in which qualification, manufacturing consistency and customer-specific engineering determine who converts industry growth into sustained revenue.

Node technology Wafer requirements and commercial implication
Above 28nm Mature-node devices include analog, power, microcontrollers, display drivers and many automotive components. They use a mix of 200 mm and 300 mm substrates and often have long production lives. Buyers value supply continuity, stable resistivity and cost, while wafer suppliers must manage inventory cycles carefully because mature-node utilization can fall sharply during broad industrial or consumer corrections.
28nm–10nm This range supports advanced consumer, networking and automotive processors while remaining broadly manufacturable across established 300 mm fabs. Substrate quality requirements are tighter than at mature nodes, and customers may use epitaxial wafers or specialized doping. Supplier qualification becomes more demanding because yield loss is multiplied across higher-value die and longer process flows.
Below 10nm Leading-edge logic and high-performance computing require the tightest defect, flatness and contamination control. Extreme ultraviolet lithography and complex multi-layer devices make substrate variation increasingly expensive. The commercial opportunity is concentrated among suppliers with proven 300 mm quality, advanced epitaxy and the ability to support rapid technology transitions without disrupting customer yield.

Secondary segmentation: By Wafer Size Adoption

The source page further distinguishes Mass Production Adoption, Pilot Line Adoption, and R&D Stage. This axis matters because wafer suppliers face very different economics at each stage: mass production rewards yield and allocation discipline, pilot lines require engineering flexibility, and R&D customers buy smaller quantities but can influence future process qualifications.

Adoption stage Commercial characteristics
Mass Production Adoption High-volume fabs require stable specifications over millions of wafers and often qualify more than one source for risk management. Supplier performance is measured through yield excursions, delivery consistency, lot traceability and rapid corrective action. Winning a mass-production qualification creates durable revenue but also commits the supplier to long-term capacity and technical support obligations.
Pilot Line Adoption Pilot lines qualify new process nodes, device structures and wafer specifications before volume ramp. Volumes are modest but engineering interaction is intense because substrate properties may be adjusted repeatedly. Suppliers that support fast experiments and detailed material characterization can secure a position in the future production bill of materials before the fab reaches full output.
R&D Stage Research laboratories and early technology programs use small quantities of highly customized wafers. Revenue is limited, but the strategic value can be high when the work concerns new transistor structures, photonics, power devices or advanced materials. Suppliers that maintain flexible finishing and characterization capability can build technical relationships years before commercial manufacturing begins.

Segment Analysis: By Application

By application, the source page segments the market into Memory, Logic/MPU, Analog, Discrete Device & Sensor, and Others. Memory is the leading application in the source page because DRAM, NAND and HBM fabs consume high volumes of 300 mm wafers, while logic demand is strengthened by AI accelerators and cloud processors. Analog and discrete demand is recovering more gradually from inventory corrections.

Application Demand characteristics
Memory DRAM, NAND and HBM production uses large volumes of high-quality 300 mm wafers. AI infrastructure is increasing HBM demand, creating strong pull for polished wafers even when conventional PC and smartphone memory remains cyclical. The purchasing trigger is wafer-start planning at memory fabs, where substrate consistency and secure allocation matter because technology migrations can rapidly change output per wafer.
Logic/MPU Leading-edge foundries and IDMs use 300 mm substrates for CPUs, GPUs, accelerators and networking processors. The value of each processed wafer can be extremely high, so customers prioritize defect control, flatness, epitaxy and lot consistency rather than lowest input price. AI and cloud investment make this one of the strongest growth engines for advanced wafer grades.
Analog Analog and mixed-signal devices serve automotive, industrial, power management and consumer applications across mature 200 mm and 300 mm processes. Demand is less concentrated in a few leading nodes and can experience prolonged inventory corrections because analog products have long lifecycles. Wafer suppliers therefore face more price sensitivity and utilization volatility than in AI-driven logic.
Discrete Device & Sensor Power discretes, image sensors, MEMS and other sensor products use multiple wafer diameters and electrical specifications. Automotive electrification, industrial automation and energy systems support long-term demand, but the wafer mix is fragmented. Suppliers can differentiate through customized resistivity, epitaxy and surface preparation that align with specific device architectures.
Others Other applications include research, specialty integrated devices, photonics and test wafers. These segments represent smaller volumes but can require unusual orientations, thicknesses or engineered surfaces. The opportunity is attractive for suppliers that can manage customized low-volume production without disrupting large mainstream 300 mm manufacturing campaigns.

Secondary segmentation: By End User

The source page identifies IDMs, Foundries and OSAT Providers as end-user groups. Foundries are the dominant wafer consumers because fabless companies outsource manufacturing, while IDMs remain major direct buyers for memory, analog, power and processor products. OSAT firms use wafers more selectively, primarily through wafer-level packaging, test and specialty processing.

End user Demand characteristics
IDMs Integrated device manufacturers design and fabricate their own products, creating direct long-term relationships with silicon wafer suppliers. Memory IDMs can purchase exceptionally large 300 mm volumes, while analog and power IDMs consume mixed diameters. Supplier selection is tied to internal process qualification, capacity planning and the ability to support multiple fabs across several product generations.
Foundries Foundries manufacture chips for many fabless customers and therefore require highly consistent wafer quality across diverse process technologies. They are the dominant end-user segment in the source page. A substrate excursion can affect many customer products simultaneously, so foundries emphasize statistically controlled quality, traceability, multiple qualified sources and reliable capacity allocation.
OSAT Providers Outsourced semiconductor assembly and test providers are not the primary consumers of virgin device wafers, but they interact with silicon substrates in wafer-level packaging, redistribution, thinning, temporary bonding and test processes. Their demand is smaller and more process-specific, yet advanced packaging can increase requirements for specialty carrier or engineered silicon wafers.

semiconductor silicon wafers Size & Share

Regional Analysis

Asia Pacific is the largest market because both semiconductor fabrication and silicon-wafer manufacturing are concentrated in Japan, Taiwan, South Korea and China. The U.S. Department of Commerce stated in 2024 that approximately 90% of silicon wafers were sourced from East Asia, while new U.S. and European fab programs are creating a strategic localization opportunity rather than immediately overturning Asian scale.

What separates the regional economics of semiconductor silicon wafers?

The market follows the physical geography of fabs and qualified wafer plants. Asia Pacific combines the highest concentration of memory and foundry wafer starts with leading wafer suppliers. North America is investing to rebuild domestic 300 mm supply. Europe is strongest in automotive, power and industrial semiconductors. South America and the Middle East & Africa have limited front-end scale, so direct wafer demand is smaller and more project-specific.

Region Position Growth outlook Demand profile What decides supplier selection
Asia Pacific Largest High Foundry, memory and supplier-led Qualification depth, scale, defect control and local allocation
North America Strategic expansion High from new fabs Localization and leading-node led Domestic resilience, 300 mm capability and fab qualification
Europe Specialty strength Moderate Automotive, power and industrial-led Traceability, specialty grades and long lifecycle support
South America Small Low to moderate Import and specialty-led Availability, logistics and cost
Middle East & Africa Emerging Low from small base Technology investment-led Partnerships, skills and imported supply
Asia Pacific LARGEST

Why does Asia Pacific dominate semiconductor silicon wafers?

Asia Pacific combines the world’s deepest concentration of wafer suppliers, foundries and memory fabs. Japan provides large-scale substrate manufacturing, Taiwan leads foundry wafer starts, South Korea concentrates memory production, and China is expanding domestic wafer and fab capacity. This creates a qualification ecosystem that competitors cannot replicate quickly through a single new factory.

Market position
Largest
Growth outlook
High
Demand profile
Foundry, memory and supplier-led
Market access gate
Qualification and local scale
Country / subregion Position Demand mechanism
Japan Wafer-supply technology center Shin-Etsu Chemical and SUMCO provide large-scale advanced silicon wafer capability and long customer relationships. Japan’s role is upstream as much as downstream: its crystal-growth, polishing and epitaxy expertise makes it critical to global fabs even when device manufacturing occurs elsewhere in Asia.
Taiwan Foundry demand center Taiwan’s foundry ecosystem creates sustained demand for advanced 300 mm wafers across leading and mature process nodes. Suppliers compete on defect performance, lot consistency, rapid engineering support and secure allocation because substrate issues can affect many fabless customers simultaneously.
South Korea & China Memory and localization growth South Korea’s DRAM, NAND and HBM fabs consume high volumes of 300 mm wafers, while China is expanding domestic semiconductor materials to reduce import dependence. The two markets therefore create different opportunities: premium advanced-memory specifications in Korea and qualification-driven localization in China.

Market instances

  • The U.S. Department of Commerce stated in 2024 that approximately 90% of silicon wafers were sourced from East Asia. That figure captures the region’s structural advantage: customers qualify material close to a mature supplier network rather than moving volume rapidly to a new geography. For suppliers, the event matters because it changes near-term qualification priorities and raises the probability that related components move from engineering samples into recurring production demand.
  • SEMI reported 2025 wafer shipment growth driven by advanced epitaxial wafers for logic and polished wafers for HBM. Much of that demand is tied to Asian foundry and memory clusters, reinforcing 300 mm utilization even while mature automotive and industrial demand recovers more slowly. The market impact is therefore broader than the individual announcement: it validates a technical direction, influences customer roadmaps and can shift capital toward the process steps needed for higher-volume production.
  • China’s domestic wafer suppliers are expanding capability, but qualification remains the gate. A new 300 mm line must reproduce the defectivity, flatness and lot consistency of incumbent Japanese, Taiwanese, Korean or European sources before advanced fabs can shift meaningful production volume. Commercially, this strengthens the case for suppliers that already have qualified products, scalable manufacturing and application support aligned with the new performance or localization requirement.

Asia Pacific should be treated as several distinct commercial ecosystems: Japan is the upstream wafer technology base, Taiwan is foundry-driven, South Korea is memory-heavy, and China is localization-led. A single regional sales strategy cannot address all four purchasing mechanisms. For procurement teams, the practical consequence is that headline demand growth must be translated into the exact product mix, qualification status and regional supply position before capacity or sourcing decisions are made.

North America LOCALIZATION BUILDOUT

Why is North America strategically important to wafer suppliers?

North America is expanding because new logic, foundry and memory investments need secure domestic material supply. The strongest evidence is GlobalWafers’ U.S. buildout: Commerce described its Sherman, Texas project as the first advanced high-volume 300 mm silicon wafer facility in the United States, creating a direct localization opportunity alongside new semiconductor fabs.

Market position
Strategic expansion
Growth outlook
High from new capacity
Demand profile
Localization and leading-node led
Market access gate
Domestic qualification and workforce
Country / subregion Position Demand mechanism
United States Primary expansion market New fabs in Arizona, Texas, Ohio and other states create long-horizon demand for qualified 300 mm wafers. GlobalWafers’ Texas project is designed to supply advanced, mature-node and memory manufacturing, linking domestic material capacity directly to fab localization.
Canada Specialty and research role Canada has a smaller front-end manufacturing base but participates through photonics, compound semiconductor research and advanced electronics. Direct silicon-wafer demand is therefore more specialized and lower volume than in the United States.
Mexico Downstream manufacturing base Mexico is a major electronics and automotive production location but has limited front-end silicon wafer fabrication. Direct substrate demand remains modest, although broader North American semiconductor localization could gradually increase research and specialty activity.

Market instances

  • The U.S. Commerce Department’s GlobalWafers award supports a Texas 300 mm facility and a Missouri 300 mm SOI facility, with approximately 1,700 construction jobs and 880 manufacturing jobs expected across the projects. The scale shows that substrate localization is being treated as strategic infrastructure, not only a private capacity decision.
  • Commerce previously stated that the Sherman, Texas facility could ultimately reach 1.2 million wafers per month after multiple expansion stages. Such scale is commercially significant because it can support nearby leading-edge and memory fabs with qualified domestic supply, reducing logistics exposure to East Asia. The development also raises the value of upstream capacity and testing because faster deployment can expose bottlenecks that were less visible during earlier, lower-volume technology generations.
  • Localization does not eliminate qualification risk. A new U.S. wafer plant must prove crystal quality, polishing, contamination control and lot consistency in customer processes before large-volume allocation moves. This means revenue ramps lag construction milestones and favor suppliers already trusted by global fabs. For buyers, the practical effect is a stronger incentive to secure second sources and long-term supply before the new demand cycle reaches full production scale.

North America’s opportunity is strongest for established global suppliers that localize production without asking customers to accept an entirely new quality system. New entrants face a much harder path because both manufacturing technology and fab qualification must be built simultaneously. This distinction matters commercially because suppliers can experience very different utilization, pricing and margin outcomes even when the overall market is expanding at a healthy rate.

Europe AUTOMOTIVE & POWER

Why is Europe commercially distinct in silicon wafers?

Europe’s wafer demand is weighted toward automotive, industrial, power, analog, sensors and selected advanced logic rather than the world’s largest memory or foundry clusters. That mix supports 200 mm, 300 mm and specialty wafer specifications with long qualification lives. European buyers place heavy emphasis on traceability, reliability and stable supply across extended product lifecycles.

Market position
Specialty strength
Growth outlook
Moderate
Demand profile
Automotive, power and industrial-led
Market access gate
Traceability and lifecycle support
Country / subregion Position Demand mechanism
Germany Automotive and industrial hub Germany’s semiconductor ecosystem serves automotive electronics, power control and industrial automation. These devices often use mature nodes and require long production lives, supporting stable demand for 200 mm, 300 mm and specialty wafers with strict quality documentation.
France Integrated manufacturing and research France combines semiconductor manufacturing, research institutes and advanced materials activity. Wafer requirements span digital, analog and specialty processes, giving suppliers opportunities where engineering support and process-specific substrate design matter more than pure volume.
Italy & Benelux Power, analog and equipment ecosystem Regional semiconductor plants and equipment companies support power, analog, MEMS and specialty-device production. Buyers value long-term supply commitments because automotive and industrial chips can remain qualified for many years after consumer technologies move to newer nodes.

Market instances

  • Europe’s semiconductor strategy encourages more local manufacturing, but wafer economics remain application-specific. Automotive and industrial fabs do not all need leading-edge 300 mm substrates; many require mature diameters and highly stable electrical specifications, so localized supply opportunities differ from the U.S. leading-node buildout. This is significant because semiconductor and optical qualification cycles are long; a supplier engaged during the current development window can retain a position through several subsequent product generations.
  • The region’s power and automotive device base supports specialty epitaxial and mature-node silicon demand even when AI-driven logic grows faster globally. This provides diversification for suppliers that can operate both high-volume 300 mm lines and smaller customized wafer businesses. The implication is a tighter link between technology announcements and manufacturing investment, with customer commitments increasingly determining which suppliers can justify the next capacity step.
  • European customers often require rigorous traceability and change control because devices are qualified into safety-critical automotive or industrial systems. A wafer supplier that modifies a process for yield or cost reasons may need customer re-approval, creating strong incumbent relationships and high switching friction. That dynamic favors vendors with established customer relationships because they can convert technical milestones into qualified production faster than entrants starting without field history.

Europe is less a volume race than a qualification and lifecycle market. Suppliers can capture durable value by supporting automotive and industrial customers across long product cycles, even when regional wafer starts grow more slowly than AI-driven Asian fabs. Buyers therefore evaluate not only component performance but also lifecycle support, yield history, production resilience and the supplier’s ability to maintain specifications through multiple platform generations.

South America SMALL / IMPORT-LED

Why is direct silicon-wafer demand limited in South America?

South America has a much smaller front-end semiconductor manufacturing footprint than Asia, North America or Europe, so most electronics demand is satisfied with imported chips rather than local virgin wafer processing. Direct silicon-wafer consumption is therefore concentrated in research, limited specialty manufacturing and pilot activities rather than large 300 mm high-volume fabs.

Market position
Small
Growth outlook
Low to moderate
Demand profile
Import and specialty-led
Market access gateAvailability and logistics
Country / subregion Position Demand mechanism
Brazil Largest regional opportunity Brazil has the region’s largest electronics and industrial base, but front-end wafer fabrication remains limited. Direct demand is tied to research, specialty processes and selected semiconductor initiatives rather than high-volume advanced logic or memory.
Argentina Research and niche demand Direct silicon wafer consumption is mainly associated with universities, research and small technology programs. Suppliers compete through small-lot availability, documentation and distributor service rather than large long-term wafer allocation agreements.
Rest of region Early-stage market Most countries import finished semiconductors and electronics. Direct wafer demand remains niche, so the commercial route is through distributors and research channels rather than dedicated local crystal-growth or polishing investments.

Market instances

  • Regional electronics growth does not automatically create wafer demand because wafers are consumed where front-end semiconductor fabrication occurs. South America imports most chips, so increasing automotive or consumer electronics assembly can expand semiconductor consumption without materially increasing bare-wafer purchases. The event also illustrates why regional strategy matters: the same technology can create different demand depending on local fabrication, system integration, infrastructure and procurement structures.
  • Research programs create a persistent market for small-diameter and specialty wafers. These customers may need unusual resistivity, thickness or orientation in small quantities, favoring suppliers or distributors that maintain broad catalogs rather than high-volume 300 mm-only strategies. For the market, the result is a more differentiated growth path in which advanced applications recover or expand faster than mature products, creating uneven utilization across supplier portfolios.
  • A material change in regional wafer demand would require new front-end fabs. Until such investment reaches construction and qualification, suppliers are unlikely to justify local wafer manufacturing capacity, making imported material and technical distribution the dominant commercial model. This evidence supports a demand mechanism tied to actual deployment and production requirements rather than to generic expectations about digitalization or semiconductor growth.

The practical strategy is to serve research and specialty demand efficiently while monitoring front-end fab investment. Large-scale local production would be premature without a corresponding customer base capable of consuming sustained wafer volumes. Over the forecast period, that mechanism favors companies that combine technical differentiation with scalable production rather than participants relying mainly on short-term price competition or isolated prototype performance.

Middle East & Africa EMERGING

What could expand semiconductor wafer demand in the Middle East & Africa?

The region is emerging from a small base as selected Gulf economies invest in AI, data centers and advanced manufacturing, while Israel maintains a more established semiconductor ecosystem. Direct silicon-wafer demand remains limited because front-end fab capacity is still small, so the commercial opportunity depends on future manufacturing projects rather than current electronics consumption.

Market position
Emerging
Growth outlook
Low from small base
Demand profile
Technology investment-led
Market access gate
Fab projects and technical partnerships
Country / subregion Position Demand mechanism
Israel Established specialty ecosystem Israel has semiconductor design and selected fabrication capabilities, creating a more sophisticated wafer-demand profile than most of the region. Qualified supply is integrated into global semiconductor networks and can include specialty and mature-node products.
Gulf Cooperation Council Strategic investment potential Gulf economies are investing in AI, data centers and technology diversification. Direct silicon-wafer demand remains limited today, but any future front-end fab would create long-term material qualification needs and could justify local inventory or technical support.
Africa Early-stage direct demand Most African economies consume finished semiconductors rather than fabricate them. Direct wafer demand is primarily research-oriented, so suppliers need flexible distribution and education partnerships rather than high-volume capacity commitments.

Market instances

  • AI and data-center investments in the Gulf increase semiconductor consumption but do not directly create wafer demand unless front-end fabrication is established. This distinction prevents overestimating the region: imported chips can support rapid digital growth without a local silicon-substrate manufacturing ecosystem. As volumes scale, the commercial focus shifts from proving feasibility to controlling yield, reliability, cost and delivery consistency, which changes the basis of competition.
  • Israel’s existing semiconductor activity provides the region’s clearest direct wafer demand. Suppliers participate through globally qualified supply chains, where material performance and process consistency matter more than local origin. The development therefore affects both revenue opportunity and supplier risk because rapid ramps can create capacity shortages, while slower customer qualification can leave new assets underutilized.
  • If Gulf countries attract a major front-end fab, wafer suppliers would need to engage years before volume production because substrate qualification begins during process development. The opportunity is therefore strategic and long-term, with partnerships and workforce development preceding material volume. In strategic terms, the event increases the importance of process maturity and supply assurance, not just peak device specifications or announced capacity.

The market should be monitored through actual fab commitments rather than broad technology spending. Wafer demand begins when process equipment, cleanrooms and qualified manufacturing lines are built, not simply when governments announce AI or digital-economy goals. The result is a market in which engineering credibility and dependable execution create measurable commercial value, particularly when customers are qualifying products for long-lived infrastructure or semiconductor platforms.

Competitive Landscape

The market is oligopolistic at the advanced end because crystal growth, polishing, epitaxy and customer qualification create high barriers. Shin-Etsu Chemical, SUMCO, GlobalWafers, Siltronic and SK Siltron form the core global supplier group, while Chinese companies such as NSIG and Zhonghuan are expanding domestic capability and regional specialists address mature or customized wafer requirements.

Competition is based on process capability and customer trust more than short-term list price. A leading-edge fab may qualify several suppliers, but each must maintain defectivity, flatness, resistivity and delivery performance within narrow statistical limits. Once a supplier is qualified, switching becomes expensive because the customer must demonstrate that the new substrate does not change device yield or reliability. That creates durable account positions but also makes any quality excursion commercially severe.

Supplier strategy differs by wafer diameter. Advanced 300 mm capacity requires the largest crystal pullers, precision finishing and often epitaxial capability, so only a small set of companies can support leading logic and memory at scale. The 200 mm and small-diameter markets are more fragmented because volumes are lower and specifications vary. Regional suppliers can compete effectively in specialty niches even without matching the global leaders’ 300 mm scale.

Localization is becoming a new competitive dimension. GlobalWafers’ U.S. investment shows established suppliers moving production closer to customers while retaining global process know-how. Chinese suppliers are pursuing a similar objective domestically. The key constraint is that local capacity must still be qualified to the same standards as incumbent plants, so geographic diversification rewards experienced producers more than greenfield entrants without a quality track record.

Competitive tier Companies Why they matter
Global advanced-wafer leaders Shin-Etsu Chemical; SUMCO Corporation; GlobalWafers; Siltronic AG; SK Siltron These companies have the 300 mm scale, crystal-growth expertise, polishing technology and customer qualifications needed for leading logic and memory. Their advantage comes from decades of process learning and the ability to invest billions in new capacity while maintaining existing customer quality performance across multiple production sites.
Regional and expanding suppliers National Silicon Industry Group (NSIG); Zhonghuan Advanced Semiconductor Materials; Wafer Works Corporation; Zhejiang Jinruihong Technologies; Hangzhou Semiconductor Wafer (CCMC) These suppliers address localization and mature-node demand, especially in China and Taiwan. Their growth opportunity depends on moving from smaller diameters or lower-specification products into more demanding 300 mm applications while proving long-term consistency to foundries and IDMs.
Specialty and emerging suppliers FST Corporation; GRINM Semiconductor Materials; MCL Electronic Materials; Nanjing Guosheng Electronics; Shanghai Advanced Silicon Technology (AST) This group serves specialty substrates, regional customers or emerging domestic supply chains. They can compete through customization, smaller-lot flexibility and targeted process expertise, but face greater barriers in advanced 300 mm because leading fabs require large qualified capacity and extensive field history.

Companies profiled in the report

The source page profiles Shin-Etsu Chemical, SUMCO Corporation, GlobalWafers, Siltronic AG, SK Siltron, FST Corporation, National Silicon Industry Group (NSIG), Zhonghuan Advanced Semiconductor Materials, Wafer Works Corporation, Zhejiang Jinruihong Technologies, Hangzhou Semiconductor Wafer (CCMC), GRINM Semiconductor Materials, MCL Electronic Materials, Nanjing Guosheng Electronics and Shanghai Advanced Silicon Technology (AST). This makes the segment strategically relevant beyond its current revenue share because today’s qualification decisions can determine supplier access to much larger production ramps later in the forecast period.

Production Capacity Analysis

Capacity analysis must distinguish nominal square-inch output from qualified output. Crystal pullers, slicing tools and polishers can create physical wafers, but advanced fabs will not use that capacity until specific production lines are qualified. The real constraint is therefore the intersection of installed equipment, process yield, product mix, customer approval and the ability to support long-duration volume commitments.

Crystal growth is the first constraint. Producing a 300 mm ingot with controlled oxygen, carbon, dopant distribution and low defect density requires stable thermal control and process experience. Larger diameters amplify yield risk because a defect or resistivity excursion affects more valuable downstream area. Suppliers must therefore operate statistical process control across long crystal pulls before the material reaches slicing, polishing or epitaxial stages.

Finishing capacity is equally important. Wafers are sliced, lapped, etched, edge-shaped, polished and cleaned to extremely tight geometry and particle specifications. Leading-node customers may require advanced epitaxy, creating another capacity layer whose utilization can differ from standard polished wafers. A supplier can therefore have spare crystal capacity while still being constrained in the exact finishing route a high-growth customer needs.

SEMI’s shipment data show why utilization matters. 2025 shipments rose 5.8% but revenue fell 1.2%, indicating that volume recovery and pricing recovery were not synchronized. By Q2 2026 shipments were 3,573 MSI, up 7.4% year on year, with AI demand broadening into power and photonics. Suppliers must decide whether that recovery is durable enough to justify new multi-year capital projects without recreating oversupply in mature product categories.

Market Dynamics

Market growth is supported by AI, leading-node fabs, HBM and supply-chain localization, but pricing remains constrained by the lagging recovery in mature applications and the capital intensity of new qualified capacity. The market’s defining tension is that customers want geographic diversification while simultaneously demanding the consistency of long-established production sites.

Market Drivers

Driver Directional impact* Commercial mechanism
AI, HBM and leading logic High Advanced logic and HBM are strong consumers of high-quality 300 mm wafers. SEMI linked 2025 shipment growth to advanced epitaxial logic wafers and polished HBM wafers, directly connecting AI infrastructure to substrate demand rather than only to finished chip sales.
New fab construction High Foundry and IDM investments in the U.S., Europe and Asia create future wafer-start capacity. Each fab begins material qualification well before volume production, giving established wafer suppliers a multi-year opportunity to secure design-in positions.
Supply-chain localization Medium to High The U.S. Commerce Department said about 90% of silicon wafers were sourced from East Asia and is supporting GlobalWafers’ domestic expansion. Similar localization efforts create demand for geographically diversified qualified capacity, not merely incremental global volume.
Industrial and automotive recovery Medium SEMI reported signs of broader recovery in 2026 as automotive and industrial inventories normalized. This supports 200 mm, specialty and mature 300 mm wafer utilization that had lagged AI-related demand.

AI increases advanced 300 mm wafer starts

AI accelerators require leading-edge logic, while HBM stacks require large volumes of advanced memory. SEMI’s 2025 annual report specifically attributed wafer growth to advanced epitaxial wafers for logic and polished wafers for HBM. For substrate suppliers, this makes AI a physical manufacturing driver: more accelerator and memory output requires additional qualified wafer starts, not only higher semiconductor selling prices.

New fabs create long-duration qualification pipelines

A new semiconductor fab begins qualifying materials before full production, and wafer approval can take months or years. This makes construction announcements commercially relevant well ahead of revenue. Suppliers that engage early can align diameter, resistivity, surface and epitaxy specifications with process development, then expand allocation as the fab ramps, creating revenue streams that can last across multiple device generations.

Localization turns geography into a purchasing criterion

The concentration of silicon wafer supply in East Asia has become a policy and risk-management concern. GlobalWafers’ Texas and Missouri investments demonstrate how governments and customers are willing to support domestic substrate capacity. The commercial opportunity is strongest for suppliers that can replicate existing qualified processes in a new location, giving customers geographic resilience without introducing unproven material behavior.

Mature semiconductor recovery broadens utilization

AI alone does not fill every wafer line. Analog, power, industrial, automotive and sensor devices consume 200 mm and mature 300 mm wafers, and their recovery improves utilization across a broader portion of supplier assets. SEMI’s 2026 commentary noted industrial and automotive improvement, which can reduce the two-speed gap between leading-edge demand and legacy-device softness.

Market Restraints

Restraint Directional impact* Commercial mechanism
Capital intensity High Large-diameter crystal growth, precision finishing and epitaxy require expensive specialized tools, clean utilities and long commissioning periods. Capacity must be installed before demand is certain, exposing suppliers to multi-year utilization risk.
Qualification barriers High A technically capable new wafer plant cannot immediately ship to advanced fabs. Customers must validate material consistency and yield impact, so commercial capacity can lag physical construction significantly.
Pricing lag Medium to High SEMI reported 2025 shipment growth alongside lower revenue. Mature-node softness and customer inventory can keep pricing weak even when square-inch shipments recover, limiting near-term returns on new capacity.
Geopolitical concentration Medium Supply is highly concentrated in East Asia, but diversification is slow and expensive. Export controls, logistics disruption or regional tension can raise risk before alternative qualified sources are ready.

New capacity has a long economic payback

A modern wafer plant requires crystal-growth furnaces, precision slicing and polishing, clean utilities, automated inspection and often epitaxial capability. These assets are specialized and difficult to repurpose. Because customer qualification follows construction, a supplier can spend heavily years before the facility reaches economic utilization, making expansion decisions highly sensitive to long-term demand visibility.

Qualification slows geographic diversification

Policy makers can finance a new plant more quickly than a semiconductor fab can qualify its output. Customers need statistical evidence that wafers from the new site match existing material performance across yield, reliability and process windows. This creates a structural delay between localization investment and meaningful revenue, favoring experienced global suppliers but restraining rapid market entry.

Volume recovery does not guarantee pricing recovery

SEMI’s 2025 data showed shipments increasing while revenue declined, which means more wafer area moved through the market without a corresponding improvement in total sales value. Mature application weakness, product mix and customer negotiations can therefore compress margins even during a shipment rebound. Suppliers must manage utilization and pricing discipline rather than assume higher MSI automatically restores profitability.

Concentration risk cannot be removed quickly

East Asia’s scale is the result of decades of supplier, equipment and fab co-location. Moving a significant share of production elsewhere requires new plants, trained workforces, utilities and customer qualification. Geopolitical risk can therefore remain elevated during the transition because customers may depend on concentrated incumbent capacity while new regional sources are still ramping.

Market Opportunities

Qualified U.S. 300 mm capacity

GlobalWafers’ Texas investment creates a template for localizing advanced wafer supply near new U.S. fabs. The opportunity extends beyond the physical plant: customers need local engineering, inventory, logistics and qualification support. Established suppliers that can reproduce existing process capability in North America can gain strategic account positions while customers pursue dual-region sourcing.

Advanced epitaxial wafers for logic and power

SEMI highlighted strong demand for advanced epitaxial wafers in logic, and 2026 commentary broadened AI-related demand into power and photonics. Epitaxy adds value beyond a standard polished substrate because thickness, doping and interface quality can be tailored to device requirements. Suppliers with high-quality epitaxial reactors can capture premium growth without relying only on commodity square-inch volume.

HBM and next-generation memory

HBM growth links AI accelerator shipments directly to DRAM wafer starts. Memory manufacturers require high-volume 300 mm polished wafers with stable defect and flatness performance. Suppliers that secure long-term allocation agreements with leading memory fabs can benefit from both bit growth and technology transitions, although they must manage cyclical risk if conventional memory demand weakens.

Specialty mature-node recovery

Automotive, industrial, power and sensor markets use 200 mm and mature 300 mm substrates that were slower to recover than AI-related categories. As inventories normalize, suppliers with underutilized mature-diameter capacity can improve margins through higher utilization without committing to the same capital intensity as a new leading-edge 300 mm line.

Supply Chain Analysis

Stage 1
Electronic-grade polysilicon
Stage 2
Crystal growth & ingot preparation
Stage 3
Slicing, polishing, cleaning & epitaxy
Stage 4
Fab qualification & volume allocation

Electronic-grade polysilicon

Semiconductor-grade polysilicon is the feedstock for single-crystal growth and requires impurity control far beyond solar-grade material. Trace metals or dopants can affect device behavior, so wafer suppliers qualify feedstock carefully and maintain contamination controls before crystal pulling. Supply resilience, energy cost and chemical purity shape upstream economics before any wafer geometry is created.

Crystal growth & ingot preparation

Czochralski and related processes turn polysilicon into single-crystal ingots with controlled orientation, oxygen content and resistivity. Diameter uniformity and defect control are established here. Large 300 mm crystals require precise thermal management and long stable pulls, making operator know-how and equipment reliability major barriers to adding qualified capacity quickly. From a market-structure perspective, the key issue is not whether demand exists but which suppliers can satisfy the required performance, cost, volume and qualification conditions at the same time.

Slicing, polishing, cleaning & epitaxy

Ingots are sliced into thin wafers, then lapped, etched, polished, cleaned and inspected. Advanced products may receive epitaxial layers. This stage captures substantial value because local flatness, surface roughness, particles and edge geometry determine downstream lithography and yield. Specialized metrology and automated inspection are required to release wafers into semiconductor production.

Fab qualification & volume allocation

Foundries and IDMs qualify specific wafer recipes and production sites through process runs, yield analysis and reliability checks. Once approved, material is supplied under long-term quality and logistics controls. Allocation becomes strategic during tight markets because customers cannot instantly substitute an unqualified supplier, giving established producers leverage but also high responsibility for continuity.

Recent Developments

Recent developments show the wafer cycle shifting from recovery into capacity positioning. Industry shipments are rising, while governments and suppliers are investing to reduce geographic concentration. The commercially important question is not only how much new capacity is announced, but how quickly that capacity becomes qualified for advanced semiconductor production.

July 2026 – Q2 wafer shipments rose 7.4% year on year

SEMI reported worldwide silicon wafer shipments of 3,573 million square inches in Q2 2026, up 7.4% from 3,327 MSI a year earlier and up 9.1% sequentially. The organization said AI demand was broadening beyond advanced logic and memory into power devices and photonics, while industrial and automotive markets were showing signs of recovery.

Source

February 2026 – 2025 shipments recovered while revenue softened

SEMI reported 2025 shipments of 12,973 MSI, up 5.8%, while wafer revenue declined 1.2% to USD 11.4 billion. The divergence is important because it shows that utilization and physical demand can recover before pricing. SEMI attributed the strongest demand to advanced epitaxial logic wafers and polished HBM wafers used in AI-related applications.

Source

October 2025 – SEMI forecast record wafer shipments by 2028

SEMI projected global silicon wafer shipments to increase to 12,824 MSI in 2025 and reach a new record of 15,485 MSI in 2028. The forecast linked growth to AI’s expanding compute footprint in data centers and at the edge, while noting that non-AI applications were only beginning a gradual recovery from the preceding semiconductor downcycle.

Source

December 2024 – U.S. CHIPS awards supported GlobalWafers capacity

The U.S. Department of Commerce finalized incentives supporting GlobalWafers facilities in Texas and Missouri. The Texas facility is intended as the first advanced high-volume 300 mm silicon wafer plant in the United States, while Missouri will produce 300 mm SOI wafers. The projects directly address geographic concentration in a foundational semiconductor material.

Source

Report Scope & Segmentation

Attribute Coverage
Market Semiconductor Silicon Wafer
Base Year 2025
Estimated Year 2026
Forecast Period 2026–2034
2025 Market Size USD 14.49 billion
2034 Forecast Size USD 27.60 billion
CAGR 7.4% (2026–2034)
Largest Market in 2025 Asia Pacific
By Type 300mm Wafers; 200mm Wafers; Small Diameter Wafers (100, 150mm)
By Application Memory; Logic/MPU; Analog; Discrete Device & Sensor; Others
By End User IDMs (Integrated Device Manufacturers); Foundries; OSAT Providers
By Node Technology Above 28nm; 28nm-10nm; Below 10nm
By Wafer Size Adoption Mass Production Adoption; Pilot Line Adoption; R&D Stage
Regions North America; Europe; Asia Pacific; South America; Middle East & Africa
Companies Profiled Shin-Etsu Chemical; SUMCO Corporation; GlobalWafers; Siltronic AG; SK Siltron; FST Corporation; National Silicon Industry Group (NSIG); Zhonghuan Advanced Semiconductor Materials; Wafer Works Corporation; Zhejiang Jinruihong Technologies; Hangzhou Semiconductor Wafer (CCMC); GRINM Semiconductor Materials; MCL Electronic Materials; Nanjing Guosheng Electronics; Shanghai Advanced Silicon Technology (AST)

Frequently Asked Questions

What is the semiconductor silicon wafer market size in 2025?

The source page publishes a 2025 value of USD 14.49 billion, so that base-year figure is preserved exactly under the rebasing rules. Using the page’s USD 25.69 billion 2033 endpoint implies an annual growth factor of about 7.42%, producing an estimated USD 15.57 billion in 2026 and a projected USD 27.60 billion in 2034.

What is the projected market size by 2034?

The rebased 2034 semiconductor silicon wafer market is approximately USD 27.60 billion. Because the page endpoint is 2033, the 2034 value is extended by one year using the compound rate implied by the 2025 and 2033 size anchors. This keeps the forecast mathematically consistent rather than extending the printed CAGR label independently.

What CAGR is used for 2026–2034?

The article uses a 7.4% CAGR for 2026–2034, derived from the source page’s USD 14.49 billion value in 2025 and USD 25.69 billion value in 2033. The page prints 8.7%, but that percentage does not reconcile with its own size anchors, so the anchors control under the defined methodology. That combination of technical and commercial requirements raises switching costs and gives successful suppliers a stronger position once their products are embedded in customer platforms.

Which wafer size dominates the market?

The source page identifies 300 mm wafers as the dominant type and states that they account for the majority of market value. Their leadership is commercially logical because advanced logic, DRAM, NAND and HBM fabs are standardized around 300 mm manufacturing, which improves die economics and supports the high-volume processing required in modern semiconductor facilities.

Which application is the largest?

Memory is the leading application in the source page. DRAM, NAND and HBM manufacturing consumes large volumes of 300 mm wafers, and AI infrastructure is strengthening the HBM component of this demand. Logic/MPU is also growing strongly because accelerators, CPUs and networking silicon require advanced 300 mm substrates and often high-quality epitaxial wafers.

Which region is the largest market?

Asia Pacific is the largest regional market because wafer suppliers and semiconductor fabs are concentrated in Japan, Taiwan, South Korea and China. The U.S. Department of Commerce stated that approximately 90% of silicon wafers were sourced from East Asia in 2024, providing a structural basis for the region’s dominance beyond the source page’s qualitative regional narrative.

What did SEMI report for 2025 wafer shipments?

SEMI reported worldwide silicon wafer shipments of 12,973 million square inches in 2025, up 5.8% year on year, while revenue fell 1.2% to USD 11.4 billion. The organization attributed the strongest demand to advanced epitaxial wafers for logic and polished wafers for HBM, both connected to AI infrastructure growth. The implication for investors and manufacturers is that capacity additions should be judged against qualified demand and technology mix rather than against total market growth in isolation.

Why is qualification such a strong barrier to entry?

A semiconductor fab must verify that a new wafer source does not alter device yield, process windows or long-term reliability. That requires controlled production runs, statistical analysis and often months of engineering work. A new plant can therefore possess physical capacity without possessing commercially usable qualified capacity, which protects incumbent suppliers and slows localization.

Who are the major companies profiled?

The source page profiles Shin-Etsu Chemical, SUMCO Corporation, GlobalWafers, Siltronic AG, SK Siltron, FST Corporation, National Silicon Industry Group, Zhonghuan Advanced Semiconductor Materials, Wafer Works Corporation, Zhejiang Jinruihong Technologies, Hangzhou Semiconductor Wafer, GRINM Semiconductor Materials, MCL Electronic Materials, Nanjing Guosheng Electronics and Shanghai Advanced Silicon Technology. In practice, this means supplier strategy must connect product roadmaps with customer qualification schedules, regional manufacturing footprints and the economics of each speed, node or application segment.

What is the most important strategic shift through 2034?

The most important shift is the combination of AI-driven advanced 300 mm demand with geographic diversification of wafer supply. Customers want more regional resilience, but qualification prevents rapid substitution. Suppliers that can replicate proven crystal, polish and epitaxy processes in new geographies while maintaining incumbent-level quality are positioned to gain the most strategic value.
Semiconductor Silicon Wafer Market, Trends, Business Strategies 2026-2034

Get Sample Report PDF for Exclusive Insights

Report Sample Includes

  • Table of Contents
  • List of Tables & Figures
  • Charts, Research Methodology, and more...

PDF Icon Download Sample Report PDF

Download Sample Report

Table of Content

1 Introduction to Research & Analysis Reports
1.1 Semiconductor Silicon Wafer Market Definition
1.2 Market Segments
1.2.1 Segment by Type
1.2.2 Segment by Application
1.3 Global Semiconductor Silicon Wafer Market Overview
1.4 Features & Benefits of This Report
1.5 Methodology & Sources of Information
1.5.1 Research Methodology
1.5.2 Research Process
1.5.3 Base Year
1.5.4 Report Assumptions & Caveats
2 Global Semiconductor Silicon Wafer Overall Market Size
2.1 Global Semiconductor Silicon Wafer Market Size: 2023 VS 2030
2.2 Global Semiconductor Silicon Wafer Market Size, Prospects & Forecasts: 2019-2030
2.3 Global Semiconductor Silicon Wafer Sales: 2019-2030
3 Company Landscape
3.1 Top Semiconductor Silicon Wafer Players in Global Market
3.2 Top Global Semiconductor Silicon Wafer Companies Ranked by Revenue
3.3 Global Semiconductor Silicon Wafer Revenue by Companies
3.4 Global Semiconductor Silicon Wafer Sales by Companies
3.5 Global Semiconductor Silicon Wafer Price by Manufacturer (2019-2024)
3.6 Top 3 and Top 5 Semiconductor Silicon Wafer Companies in Global Market, by Revenue in 2023
3.7 Global Manufacturers Semiconductor Silicon Wafer Product Type
3.8 Tier 1, Tier 2, and Tier 3 Semiconductor Silicon Wafer Players in Global Market
3.8.1 List of Global Tier 1 Semiconductor Silicon Wafer Companies
3.8.2 List of Global Tier 2 and Tier 3 Semiconductor Silicon Wafer Companies
4 Sights by Product
4.1 Overview
4.1.1 Segment by Type – Global Semiconductor Silicon Wafer Market Size Markets, 2023 & 2030
4.1.2 300mm Wafers
4.1.3 200mm Wafers
4.1.4 Small Diameter Wafers (100, 150mm)
4.2 Segment – Global Semiconductor Silicon Wafer Revenue & Forecasts
4.2.1 Segment – Global Semiconductor Silicon Wafer Revenue, 2019-2024
4.2.2 Segment – Global Semiconductor Silicon Wafer Revenue, 2025-2030
4.2.3 Segment – Global Semiconductor Silicon Wafer Revenue Market Share, 2019-2030
4.3 Segment – Global Semiconductor Silicon Wafer Sales & Forecasts
4.3.1 Segment – Global Semiconductor Silicon Wafer Sales, 2019-2024
4.3.2 Segment – Global Semiconductor Silicon Wafer Sales, 2025-2030
4.3.3 Segment – Global Semiconductor Silicon Wafer Sales Market Share, 2019-2030
4.4 Segment – Global Semiconductor Silicon Wafer Price (Manufacturers Selling Prices), 2019-2030
5 Sights by Application
5.1 Overview
5.1.1 Segment by Application – Global Semiconductor Silicon Wafer Market Size, 2023 & 2030
5.1.2 Memory
5.1.3 Logic/MPU
5.1.4 Analog
5.1.5 Discrete Device & Sensor
5.1.6 Others
5.2 Segment by Application – Global Semiconductor Silicon Wafer Revenue & Forecasts
5.2.1 Segment by Application – Global Semiconductor Silicon Wafer Revenue, 2019-2024
5.2.2 Segment by Application – Global Semiconductor Silicon Wafer Revenue, 2025-2030
5.2.3 Segment by Application – Global Semiconductor Silicon Wafer Revenue Market Share, 2019-2030
5.3 Segment by Application – Global Semiconductor Silicon Wafer Sales & Forecasts
5.3.1 Segment by Application – Global Semiconductor Silicon Wafer Sales, 2019-2024
5.3.2 Segment by Application – Global Semiconductor Silicon Wafer Sales, 2025-2030
5.3.3 Segment by Application – Global Semiconductor Silicon Wafer Sales Market Share, 2019-2030
5.4 Segment by Application – Global Semiconductor Silicon Wafer Price (Manufacturers Selling Prices), 2019-2030
6 Sights by Region
6.1 By Region – Global Semiconductor Silicon Wafer Market Size, 2023 & 2030
6.2 By Region – Global Semiconductor Silicon Wafer Revenue & Forecasts
6.2.1 By Region – Global Semiconductor Silicon Wafer Revenue, 2019-2024
6.2.2 By Region – Global Semiconductor Silicon Wafer Revenue, 2025-2030
6.2.3 By Region – Global Semiconductor Silicon Wafer Revenue Market Share, 2019-2030
6.3 By Region – Global Semiconductor Silicon Wafer Sales & Forecasts
6.3.1 By Region – Global Semiconductor Silicon Wafer Sales, 2019-2024
6.3.2 By Region – Global Semiconductor Silicon Wafer Sales, 2025-2030
6.3.3 By Region – Global Semiconductor Silicon Wafer Sales Market Share, 2019-2030
6.4 North America
6.4.1 By Country – North America Semiconductor Silicon Wafer Revenue, 2019-2030
6.4.2 By Country – North America Semiconductor Silicon Wafer Sales, 2019-2030
6.4.3 United States Semiconductor Silicon Wafer Market Size, 2019-2030
6.4.4 Canada Semiconductor Silicon Wafer Market Size, 2019-2030
6.4.5 Mexico Semiconductor Silicon Wafer Market Size, 2019-2030
6.5 Europe
6.5.1 By Country – Europe Semiconductor Silicon Wafer Revenue, 2019-2030
6.5.2 By Country – Europe Semiconductor Silicon Wafer Sales, 2019-2030
6.5.3 Germany Semiconductor Silicon Wafer Market Size, 2019-2030
6.5.4 France Semiconductor Silicon Wafer Market Size, 2019-2030
6.5.5 U.K. Semiconductor Silicon Wafer Market Size, 2019-2030
6.5.6 Italy Semiconductor Silicon Wafer Market Size, 2019-2030
6.5.7 Russia Semiconductor Silicon Wafer Market Size, 2019-2030
6.5.8 Nordic Countries Semiconductor Silicon Wafer Market Size, 2019-2030
6.5.9 Benelux Semiconductor Silicon Wafer Market Size, 2019-2030
6.6 Asia
6.6.1 By Region – Asia Semiconductor Silicon Wafer Revenue, 2019-2030
6.6.2 By Region – Asia Semiconductor Silicon Wafer Sales, 2019-2030
6.6.3 China Semiconductor Silicon Wafer Market Size, 2019-2030
6.6.4 Japan Semiconductor Silicon Wafer Market Size, 2019-2030
6.6.5 South Korea Semiconductor Silicon Wafer Market Size, 2019-2030
6.6.6 Southeast Asia Semiconductor Silicon Wafer Market Size, 2019-2030
6.6.7 India Semiconductor Silicon Wafer Market Size, 2019-2030
6.7 South America
6.7.1 By Country – South America Semiconductor Silicon Wafer Revenue, 2019-2030
6.7.2 By Country – South America Semiconductor Silicon Wafer Sales, 2019-2030
6.7.3 Brazil Semiconductor Silicon Wafer Market Size, 2019-2030
6.7.4 Argentina Semiconductor Silicon Wafer Market Size, 2019-2030
6.8 Middle East & Africa
6.8.1 By Country – Middle East & Africa Semiconductor Silicon Wafer Revenue, 2019-2030
6.8.2 By Country – Middle East & Africa Semiconductor Silicon Wafer Sales, 2019-2030
6.8.3 Turkey Semiconductor Silicon Wafer Market Size, 2019-2030
6.8.4 Israel Semiconductor Silicon Wafer Market Size, 2019-2030
6.8.5 Saudi Arabia Semiconductor Silicon Wafer Market Size, 2019-2030
6.8.6 UAE Semiconductor Silicon Wafer Market Size, 2019-2030
7 Manufacturers & Brands Profiles
7.1 Shin-Etsu Chemical
7.1.1 Shin-Etsu Chemical Company Summary
7.1.2 Shin-Etsu Chemical Business Overview
7.1.3 Shin-Etsu Chemical Semiconductor Silicon Wafer Major Product Offerings
7.1.4 Shin-Etsu Chemical Semiconductor Silicon Wafer Sales and Revenue in Global (2019-2024)
7.1.5 Shin-Etsu Chemical Key News & Latest Developments
7.2 SUMCO
7.2.1 SUMCO Company Summary
7.2.2 SUMCO Business Overview
7.2.3 SUMCO Semiconductor Silicon Wafer Major Product Offerings
7.2.4 SUMCO Semiconductor Silicon Wafer Sales and Revenue in Global (2019-2024)
7.2.5 SUMCO Key News & Latest Developments
7.3 GlobalWafers
7.3.1 GlobalWafers Company Summary
7.3.2 GlobalWafers Business Overview
7.3.3 GlobalWafers Semiconductor Silicon Wafer Major Product Offerings
7.3.4 GlobalWafers Semiconductor Silicon Wafer Sales and Revenue in Global (2019-2024)
7.3.5 GlobalWafers Key News & Latest Developments
7.4 Siltronic AG
7.4.1 Siltronic AG Company Summary
7.4.2 Siltronic AG Business Overview
7.4.3 Siltronic AG Semiconductor Silicon Wafer Major Product Offerings
7.4.4 Siltronic AG Semiconductor Silicon Wafer Sales and Revenue in Global (2019-2024)
7.4.5 Siltronic AG Key News & Latest Developments
7.5 SK Siltron
7.5.1 SK Siltron Company Summary
7.5.2 SK Siltron Business Overview
7.5.3 SK Siltron Semiconductor Silicon Wafer Major Product Offerings
7.5.4 SK Siltron Semiconductor Silicon Wafer Sales and Revenue in Global (2019-2024)
7.5.5 SK Siltron Key News & Latest Developments
7.6 FST Corporation
7.6.1 FST Corporation Company Summary
7.6.2 FST Corporation Business Overview
7.6.3 FST Corporation Semiconductor Silicon Wafer Major Product Offerings
7.6.4 FST Corporation Semiconductor Silicon Wafer Sales and Revenue in Global (2019-2024)
7.6.5 FST Corporation Key News & Latest Developments
7.7 Wafer Works Corporation
7.7.1 Wafer Works Corporation Company Summary
7.7.2 Wafer Works Corporation Business Overview
7.7.3 Wafer Works Corporation Semiconductor Silicon Wafer Major Product Offerings
7.7.4 Wafer Works Corporation Semiconductor Silicon Wafer Sales and Revenue in Global (2019-2024)
7.7.5 Wafer Works Corporation Key News & Latest Developments
7.8 National Silicon Industry Group (NSIG)
7.8.1 National Silicon Industry Group (NSIG) Company Summary
7.8.2 National Silicon Industry Group (NSIG) Business Overview
7.8.3 National Silicon Industry Group (NSIG) Semiconductor Silicon Wafer Major Product Offerings
7.8.4 National Silicon Industry Group (NSIG) Semiconductor Silicon Wafer Sales and Revenue in Global (2019-2024)
7.8.5 National Silicon Industry Group (NSIG) Key News & Latest Developments
7.9 Zhonghuan Advanced Semiconductor Materials
7.9.1 Zhonghuan Advanced Semiconductor Materials Company Summary
7.9.2 Zhonghuan Advanced Semiconductor Materials Business Overview
7.9.3 Zhonghuan Advanced Semiconductor Materials Semiconductor Silicon Wafer Major Product Offerings
7.9.4 Zhonghuan Advanced Semiconductor Materials Semiconductor Silicon Wafer Sales and Revenue in Global (2019-2024)
7.9.5 Zhonghuan Advanced Semiconductor Materials Key News & Latest Developments
7.10 Zhejiang Jinruihong Technologies
7.10.1 Zhejiang Jinruihong Technologies Company Summary
7.10.2 Zhejiang Jinruihong Technologies Business Overview
7.10.3 Zhejiang Jinruihong Technologies Semiconductor Silicon Wafer Major Product Offerings
7.10.4 Zhejiang Jinruihong Technologies Semiconductor Silicon Wafer Sales and Revenue in Global (2019-2024)
7.10.5 Zhejiang Jinruihong Technologies Key News & Latest Developments
7.11 Hangzhou Semiconductor Wafer (CCMC)
7.11.1 Hangzhou Semiconductor Wafer (CCMC) Company Summary
7.11.2 Hangzhou Semiconductor Wafer (CCMC) Business Overview
7.11.3 Hangzhou Semiconductor Wafer (CCMC) Semiconductor Silicon Wafer Major Product Offerings
7.11.4 Hangzhou Semiconductor Wafer (CCMC) Semiconductor Silicon Wafer Sales and Revenue in Global (2019-2024)
7.11.5 Hangzhou Semiconductor Wafer (CCMC) Key News & Latest Developments
7.12 GRINM Semiconductor Materials
7.12.1 GRINM Semiconductor Materials Company Summary
7.12.2 GRINM Semiconductor Materials Business Overview
7.12.3 GRINM Semiconductor Materials Semiconductor Silicon Wafer Major Product Offerings
7.12.4 GRINM Semiconductor Materials Semiconductor Silicon Wafer Sales and Revenue in Global (2019-2024)
7.12.5 GRINM Semiconductor Materials Key News & Latest Developments
7.13 MCL Electronic Materials
7.13.1 MCL Electronic Materials Company Summary
7.13.2 MCL Electronic Materials Business Overview
7.13.3 MCL Electronic Materials Semiconductor Silicon Wafer Major Product Offerings
7.13.4 MCL Electronic Materials Semiconductor Silicon Wafer Sales and Revenue in Global (2019-2024)
7.13.5 MCL Electronic Materials Key News & Latest Developments
7.14 Nanjing Guosheng Electronics
7.14.1 Nanjing Guosheng Electronics Company Summary
7.14.2 Nanjing Guosheng Electronics Business Overview
7.14.3 Nanjing Guosheng Electronics Semiconductor Silicon Wafer Major Product Offerings
7.14.4 Nanjing Guosheng Electronics Semiconductor Silicon Wafer Sales and Revenue in Global (2019-2024)
7.14.5 Nanjing Guosheng Electronics Key News & Latest Developments
7.15 Hebei Puxing Electronic Technology
7.15.1 Hebei Puxing Electronic Technology Company Summary
7.15.2 Hebei Puxing Electronic Technology Business Overview
7.15.3 Hebei Puxing Electronic Technology Semiconductor Silicon Wafer Major Product Offerings
7.15.4 Hebei Puxing Electronic Technology Semiconductor Silicon Wafer Sales and Revenue in Global (2019-2024)
7.15.5 Hebei Puxing Electronic Technology Key News & Latest Developments
7.16 Shanghai Advanced Silicon Technology (AST)
7.16.1 Shanghai Advanced Silicon Technology (AST) Company Summary
7.16.2 Shanghai Advanced Silicon Technology (AST) Business Overview
7.16.3 Shanghai Advanced Silicon Technology (AST) Semiconductor Silicon Wafer Major Product Offerings
7.16.4 Shanghai Advanced Silicon Technology (AST) Semiconductor Silicon Wafer Sales and Revenue in Global (2019-2024)
7.16.5 Shanghai Advanced Silicon Technology (AST) Key News & Latest Developments
7.17 Zhejiang MTCN Technology
7.17.1 Zhejiang MTCN Technology Company Summary
7.17.2 Zhejiang MTCN Technology Business Overview
7.17.3 Zhejiang MTCN Technology Semiconductor Silicon Wafer Major Product Offerings
7.17.4 Zhejiang MTCN Technology Semiconductor Silicon Wafer Sales and Revenue in Global (2019-2024)
7.17.5 Zhejiang MTCN Technology Key News & Latest Developments
7.18 Beijing ESWIN Technology Group
7.18.1 Beijing ESWIN Technology Group Company Summary
7.18.2 Beijing ESWIN Technology Group Business Overview
7.18.3 Beijing ESWIN Technology Group Semiconductor Silicon Wafer Major Product Offerings
7.18.4 Beijing ESWIN Technology Group Semiconductor Silicon Wafer Sales and Revenue in Global (2019-2024)
7.18.5 Beijing ESWIN Technology Group Key News & Latest Developments
8 Global Semiconductor Silicon Wafer Production Capacity, Analysis
8.1 Global Semiconductor Silicon Wafer Production Capacity, 2019-2030
8.2 Semiconductor Silicon Wafer Production Capacity of Key Manufacturers in Global Market
8.3 Global Semiconductor Silicon Wafer Production by Region
9 Key Market Trends, Opportunity, Drivers and Restraints
9.1 Market Opportunities & Trends
9.2 Market Drivers
9.3 Market Restraints
10 Semiconductor Silicon Wafer Supply Chain Analysis
10.1 Semiconductor Silicon Wafer Industry Value Chain
10.2 Semiconductor Silicon Wafer Upstream Market
10.3 Semiconductor Silicon Wafer Downstream and Clients
10.4 Marketing Channels Analysis
10.4.1 Marketing Channels
10.4.2 Semiconductor Silicon Wafer Distributors and Sales Agents in Global
11 Conclusion
12 Appendix
12.1 Note
12.2 Examples of Clients
12.3 DisclaimerList of Tables
Table 1. Key Players of Semiconductor Silicon Wafer in Global Market
Table 2. Top Semiconductor Silicon Wafer Players in Global Market, Ranking by Revenue (2023)
Table 3. Global Semiconductor Silicon Wafer Revenue by Companies, (US$, Mn), 2019-2024
Table 4. Global Semiconductor Silicon Wafer Revenue Share by Companies, 2019-2024
Table 5. Global Semiconductor Silicon Wafer Sales by Companies, (K Pcs), 2019-2024
Table 6. Global Semiconductor Silicon Wafer Sales Share by Companies, 2019-2024
Table 7. Key Manufacturers Semiconductor Silicon Wafer Price (2019-2024) & (USD/Pcs)
Table 8. Global Manufacturers Semiconductor Silicon Wafer Product Type
Table 9. List of Global Tier 1 Semiconductor Silicon Wafer Companies, Revenue (US$, Mn) in 2023 and Market Share
Table 10. List of Global Tier 2 and Tier 3 Semiconductor Silicon Wafer Companies, Revenue (US$, Mn) in 2023 and Market Share
Table 11. Segment by Type – Global Semiconductor Silicon Wafer Revenue, (US$, Mn), 2023 & 2030
Table 12. Segment by Type – Global Semiconductor Silicon Wafer Revenue (US$, Mn), 2019-2024
Table 13. Segment by Type – Global Semiconductor Silicon Wafer Revenue (US$, Mn), 2025-2030
Table 14. Segment by Type – Global Semiconductor Silicon Wafer Sales (K Pcs), 2019-2024
Table 15. Segment by Type – Global Semiconductor Silicon Wafer Sales (K Pcs), 2025-2030
Table 16. Segment by Application – Global Semiconductor Silicon Wafer Revenue, (US$, Mn), 2023 & 2030
Table 17. Segment by Application – Global Semiconductor Silicon Wafer Revenue, (US$, Mn), 2019-2024
Table 18. Segment by Application – Global Semiconductor Silicon Wafer Revenue, (US$, Mn), 2025-2030
Table 19. Segment by Application – Global Semiconductor Silicon Wafer Sales, (K Pcs), 2019-2024
Table 20. Segment by Application – Global Semiconductor Silicon Wafer Sales, (K Pcs), 2025-2030
Table 21. By Region – Global Semiconductor Silicon Wafer Revenue, (US$, Mn), 2023-2030
Table 22. By Region – Global Semiconductor Silicon Wafer Revenue, (US$, Mn), 2019-2024
Table 23. By Region – Global Semiconductor Silicon Wafer Revenue, (US$, Mn), 2025-2030
Table 24. By Region – Global Semiconductor Silicon Wafer Sales, (K Pcs), 2019-2024
Table 25. By Region – Global Semiconductor Silicon Wafer Sales, (K Pcs), 2025-2030
Table 26. By Country – North America Semiconductor Silicon Wafer Revenue, (US$, Mn), 2019-2024
Table 27. By Country – North America Semiconductor Silicon Wafer Revenue, (US$, Mn), 2025-2030
Table 28. By Country – North America Semiconductor Silicon Wafer Sales, (K Pcs), 2019-2024
Table 29. By Country – North America Semiconductor Silicon Wafer Sales, (K Pcs), 2025-2030
Table 30. By Country – Europe Semiconductor Silicon Wafer Revenue, (US$, Mn), 2019-2024
Table 31. By Country – Europe Semiconductor Silicon Wafer Revenue, (US$, Mn), 2025-2030
Table 32. By Country – Europe Semiconductor Silicon Wafer Sales, (K Pcs), 2019-2024
Table 33. By Country – Europe Semiconductor Silicon Wafer Sales, (K Pcs), 2025-2030
Table 34. By Region – Asia Semiconductor Silicon Wafer Revenue, (US$, Mn), 2019-2024
Table 35. By Region – Asia Semiconductor Silicon Wafer Revenue, (US$, Mn), 2025-2030
Table 36. By Region – Asia Semiconductor Silicon Wafer Sales, (K Pcs), 2019-2024
Table 37. By Region – Asia Semiconductor Silicon Wafer Sales, (K Pcs), 2025-2030
Table 38. By Country – South America Semiconductor Silicon Wafer Revenue, (US$, Mn), 2019-2024
Table 39. By Country – South America Semiconductor Silicon Wafer Revenue, (US$, Mn), 2025-2030
Table 40. By Country – South America Semiconductor Silicon Wafer Sales, (K Pcs), 2019-2024
Table 41. By Country – South America Semiconductor Silicon Wafer Sales, (K Pcs), 2025-2030
Table 42. By Country – Middle East & Africa Semiconductor Silicon Wafer Revenue, (US$, Mn), 2019-2024
Table 43. By Country – Middle East & Africa Semiconductor Silicon Wafer Revenue, (US$, Mn), 2025-2030
Table 44. By Country – Middle East & Africa Semiconductor Silicon Wafer Sales, (K Pcs), 2019-2024
Table 45. By Country – Middle East & Africa Semiconductor Silicon Wafer Sales, (K Pcs), 2025-2030
Table 46. Shin-Etsu Chemical Company Summary
Table 47. Shin-Etsu Chemical Semiconductor Silicon Wafer Product Offerings
Table 48. Shin-Etsu Chemical Semiconductor Silicon Wafer Sales (K Pcs), Revenue (US$, Mn) and Average Price (USD/Pcs) & (2019-2024)
Table 49. Shin-Etsu Chemical Key News & Latest Developments
Table 50. SUMCO Company Summary
Table 51. SUMCO Semiconductor Silicon Wafer Product Offerings
Table 52. SUMCO Semiconductor Silicon Wafer Sales (K Pcs), Revenue (US$, Mn) and Average Price (USD/Pcs) & (2019-2024)
Table 53. SUMCO Key News & Latest Developments
Table 54. GlobalWafers Company Summary
Table 55. GlobalWafers Semiconductor Silicon Wafer Product Offerings
Table 56. GlobalWafers Semiconductor Silicon Wafer Sales (K Pcs), Revenue (US$, Mn) and Average Price (USD/Pcs) & (2019-2024)
Table 57. GlobalWafers Key News & Latest Developments
Table 58. Siltronic AG Company Summary
Table 59. Siltronic AG Semiconductor Silicon Wafer Product Offerings
Table 60. Siltronic AG Semiconductor Silicon Wafer Sales (K Pcs), Revenue (US$, Mn) and Average Price (USD/Pcs) & (2019-2024)
Table 61. Siltronic AG Key News & Latest Developments
Table 62. SK Siltron Company Summary
Table 63. SK Siltron Semiconductor Silicon Wafer Product Offerings
Table 64. SK Siltron Semiconductor Silicon Wafer Sales (K Pcs), Revenue (US$, Mn) and Average Price (USD/Pcs) & (2019-2024)
Table 65. SK Siltron Key News & Latest Developments
Table 66. FST Corporation Company Summary
Table 67. FST Corporation Semiconductor Silicon Wafer Product Offerings
Table 68. FST Corporation Semiconductor Silicon Wafer Sales (K Pcs), Revenue (US$, Mn) and Average Price (USD/Pcs) & (2019-2024)
Table 69. FST Corporation Key News & Latest Developments
Table 70. Wafer Works Corporation Company Summary
Table 71. Wafer Works Corporation Semiconductor Silicon Wafer Product Offerings
Table 72. Wafer Works Corporation Semiconductor Silicon Wafer Sales (K Pcs), Revenue (US$, Mn) and Average Price (USD/Pcs) & (2019-2024)
Table 73. Wafer Works Corporation Key News & Latest Developments
Table 74. National Silicon Industry Group (NSIG) Company Summary
Table 75. National Silicon Industry Group (NSIG) Semiconductor Silicon Wafer Product Offerings
Table 76. National Silicon Industry Group (NSIG) Semiconductor Silicon Wafer Sales (K Pcs), Revenue (US$, Mn) and Average Price (USD/Pcs) & (2019-2024)
Table 77. National Silicon Industry Group (NSIG) Key News & Latest Developments
Table 78. Zhonghuan Advanced Semiconductor Materials Company Summary
Table 79. Zhonghuan Advanced Semiconductor Materials Semiconductor Silicon Wafer Product Offerings
Table 80. Zhonghuan Advanced Semiconductor Materials Semiconductor Silicon Wafer Sales (K Pcs), Revenue (US$, Mn) and Average Price (USD/Pcs) & (2019-2024)
Table 81. Zhonghuan Advanced Semiconductor Materials Key News & Latest Developments
Table 82. Zhejiang Jinruihong Technologies Company Summary
Table 83. Zhejiang Jinruihong Technologies Semiconductor Silicon Wafer Product Offerings
Table 84. Zhejiang Jinruihong Technologies Semiconductor Silicon Wafer Sales (K Pcs), Revenue (US$, Mn) and Average Price (USD/Pcs) & (2019-2024)
Table 85. Zhejiang Jinruihong Technologies Key News & Latest Developments
Table 86. Hangzhou Semiconductor Wafer (CCMC) Company Summary
Table 87. Hangzhou Semiconductor Wafer (CCMC) Semiconductor Silicon Wafer Product Offerings
Table 88. Hangzhou Semiconductor Wafer (CCMC) Semiconductor Silicon Wafer Sales (K Pcs), Revenue (US$, Mn) and Average Price (USD/Pcs) & (2019-2024)
Table 89. Hangzhou Semiconductor Wafer (CCMC) Key News & Latest Developments
Table 90. GRINM Semiconductor Materials Company Summary
Table 91. GRINM Semiconductor Materials Semiconductor Silicon Wafer Product Offerings
Table 92. GRINM Semiconductor Materials Semiconductor Silicon Wafer Sales (K Pcs), Revenue (US$, Mn) and Average Price (USD/Pcs) & (2019-2024)
Table 93. GRINM Semiconductor Materials Key News & Latest Developments
Table 94. MCL Electronic Materials Company Summary
Table 95. MCL Electronic Materials Semiconductor Silicon Wafer Product Offerings
Table 96. MCL Electronic Materials Semiconductor Silicon Wafer Sales (K Pcs), Revenue (US$, Mn) and Average Price (USD/Pcs) & (2019-2024)
Table 97. MCL Electronic Materials Key News & Latest Developments
Table 98. Nanjing Guosheng Electronics Company Summary
Table 99. Nanjing Guosheng Electronics Semiconductor Silicon Wafer Product Offerings
Table 100. Nanjing Guosheng Electronics Semiconductor Silicon Wafer Sales (K Pcs), Revenue (US$, Mn) and Average Price (USD/Pcs) & (2019-2024)
Table 101. Nanjing Guosheng Electronics Key News & Latest Developments
Table 102. Hebei Puxing Electronic Technology Company Summary
Table 103. Hebei Puxing Electronic Technology Semiconductor Silicon Wafer Product Offerings
Table 104. Hebei Puxing Electronic Technology Semiconductor Silicon Wafer Sales (K Pcs), Revenue (US$, Mn) and Average Price (USD/Pcs) & (2019-2024)
Table 105. Hebei Puxing Electronic Technology Key News & Latest Developments
Table 106. Shanghai Advanced Silicon Technology (AST) Company Summary
Table 107. Shanghai Advanced Silicon Technology (AST) Semiconductor Silicon Wafer Product Offerings
Table 108. Shanghai Advanced Silicon Technology (AST) Semiconductor Silicon Wafer Sales (K Pcs), Revenue (US$, Mn) and Average Price (USD/Pcs) & (2019-2024)
Table 109. Shanghai Advanced Silicon Technology (AST) Key News & Latest Developments
Table 110. Zhejiang MTCN Technology Company Summary
Table 111. Zhejiang MTCN Technology Semiconductor Silicon Wafer Product Offerings
Table 112. Zhejiang MTCN Technology Semiconductor Silicon Wafer Sales (K Pcs), Revenue (US$, Mn) and Average Price (USD/Pcs) & (2019-2024)
Table 113. Zhejiang MTCN Technology Key News & Latest Developments
Table 114. Beijing ESWIN Technology Group Company Summary
Table 115. Beijing ESWIN Technology Group Semiconductor Silicon Wafer Product Offerings
Table 116. Beijing ESWIN Technology Group Semiconductor Silicon Wafer Sales (K Pcs), Revenue (US$, Mn) and Average Price (USD/Pcs) & (2019-2024)
Table 117. Beijing ESWIN Technology Group Key News & Latest Developments
Table 118. Semiconductor Silicon Wafer Capacity of Key Manufacturers in Global Market, 2022-2024 (K Pcs)
Table 119. Global Semiconductor Silicon Wafer Capacity Market Share of Key Manufacturers, 2022-2024
Table 120. Global Semiconductor Silicon Wafer Production by Region, 2019-2024 (K Pcs)
Table 121. Global Semiconductor Silicon Wafer Production by Region, 2025-2030 (K Pcs)
Table 122. Semiconductor Silicon Wafer Market Opportunities & Trends in Global Market
Table 123. Semiconductor Silicon Wafer Market Drivers in Global Market
Table 124. Semiconductor Silicon Wafer Market Restraints in Global Market
Table 125. Semiconductor Silicon Wafer Raw Materials
Table 126. Semiconductor Silicon Wafer Raw Materials Suppliers in Global Market
Table 127. Typical Semiconductor Silicon Wafer Downstream
Table 128. Semiconductor Silicon Wafer Downstream Clients in Global Market
Table 129. Semiconductor Silicon Wafer Distributors and Sales Agents in Global Market

List of Figures
Figure 1. Semiconductor Silicon Wafer Segment by Type in 2023
Figure 2. Semiconductor Silicon Wafer Segment by Application in 2023
Figure 3. Global Semiconductor Silicon Wafer Market Overview: 2023
Figure 4. Key Caveats
Figure 5. Global Semiconductor Silicon Wafer Market Size: 2023 VS 2030 (US$, Mn)
Figure 6. Global Semiconductor Silicon Wafer Revenue: 2019-2030 (US$, Mn)
Figure 7. Semiconductor Silicon Wafer Sales in Global Market: 2019-2030 (K Pcs)
Figure 8. The Top 3 and 5 Players Market Share by Semiconductor Silicon Wafer Revenue in 2023
Figure 9. Segment by Type – Global Semiconductor Silicon Wafer Revenue, (US$, Mn), 2023 & 2030
Figure 10. Segment by Type – Global Semiconductor Silicon Wafer Revenue Market Share, 2019-2030
Figure 11. Segment by Type – Global Semiconductor Silicon Wafer Sales Market Share, 2019-2030
Figure 12. Segment by Type – Global Semiconductor Silicon Wafer Price (USD/Pcs), 2019-2030
Figure 13. Segment by Application – Global Semiconductor Silicon Wafer Revenue, (US$, Mn), 2023 & 2030
Figure 14. Segment by Application – Global Semiconductor Silicon Wafer Revenue Market Share, 2019-2030
Figure 15. Segment by Application – Global Semiconductor Silicon Wafer Sales Market Share, 2019-2030
Figure 16. Segment by Application -Global Semiconductor Silicon Wafer Price (USD/Pcs), 2019-2030
Figure 17. By Region – Global Semiconductor Silicon Wafer Revenue, (US$, Mn), 2023 & 2030
Figure 18. By Region – Global Semiconductor Silicon Wafer Revenue Market Share, 2019 VS 2023 VS 2030
Figure 19. By Region – Global Semiconductor Silicon Wafer Revenue Market Share, 2019-2030
Figure 20. By Region – Global Semiconductor Silicon Wafer Sales Market Share, 2019-2030
Figure 21. By Country – North America Semiconductor Silicon Wafer Revenue Market Share, 2019-2030
Figure 22. By Country – North America Semiconductor Silicon Wafer Sales Market Share, 2019-2030
Figure 23. United States Semiconductor Silicon Wafer Revenue, (US$, Mn), 2019-2030
Figure 24. Canada Semiconductor Silicon Wafer Revenue, (US$, Mn), 2019-2030
Figure 25. Mexico Semiconductor Silicon Wafer Revenue, (US$, Mn), 2019-2030
Figure 26. By Country – Europe Semiconductor Silicon Wafer Revenue Market Share, 2019-2030
Figure 27. By Country – Europe Semiconductor Silicon Wafer Sales Market Share, 2019-2030
Figure 28. Germany Semiconductor Silicon Wafer Revenue, (US$, Mn), 2019-2030
Figure 29. France Semiconductor Silicon Wafer Revenue, (US$, Mn), 2019-2030
Figure 30. U.K. Semiconductor Silicon Wafer Revenue, (US$, Mn), 2019-2030
Figure 31. Italy Semiconductor Silicon Wafer Revenue, (US$, Mn), 2019-2030
Figure 32. Russia Semiconductor Silicon Wafer Revenue, (US$, Mn), 2019-2030
Figure 33. Nordic Countries Semiconductor Silicon Wafer Revenue, (US$, Mn), 2019-2030
Figure 34. Benelux Semiconductor Silicon Wafer Revenue, (US$, Mn), 2019-2030
Figure 35. By Region – Asia Semiconductor Silicon Wafer Revenue Market Share, 2019-2030
Figure 36. By Region – Asia Semiconductor Silicon Wafer Sales Market Share, 2019-2030
Figure 37. China Semiconductor Silicon Wafer Revenue, (US$, Mn), 2019-2030
Figure 38. Japan Semiconductor Silicon Wafer Revenue, (US$, Mn), 2019-2030
Figure 39. South Korea Semiconductor Silicon Wafer Revenue, (US$, Mn), 2019-2030
Figure 40. Southeast Asia Semiconductor Silicon Wafer Revenue, (US$, Mn), 2019-2030
Figure 41. India Semiconductor Silicon Wafer Revenue, (US$, Mn), 2019-2030
Figure 42. By Country – South America Semiconductor Silicon Wafer Revenue Market Share, 2019-2030
Figure 43. By Country – South America Semiconductor Silicon Wafer Sales, Market Share, 2019-2030
Figure 44. Brazil Semiconductor Silicon Wafer Revenue, (US$, Mn), 2019-2030
Figure 45. Argentina Semiconductor Silicon Wafer Revenue, (US$, Mn), 2019-2030
Figure 46. By Country – Middle East & Africa Semiconductor Silicon Wafer Revenue, Market Share, 2019-2030
Figure 47. By Country – Middle East & Africa Semiconductor Silicon Wafer Sales, Market Share, 2019-2030
Figure 48. Turkey Semiconductor Silicon Wafer Revenue, (US$, Mn), 2019-2030
Figure 49. Israel Semiconductor Silicon Wafer Revenue, (US$, Mn), 2019-2030
Figure 50. Saudi Arabia Semiconductor Silicon Wafer Revenue, (US$, Mn), 2019-2030
Figure 51. UAE Semiconductor Silicon Wafer Revenue, (US$, Mn), 2019-2030
Figure 52. Global Semiconductor Silicon Wafer Production Capacity (K Pcs), 2019-2030
Figure 53. The Percentage of Production Semiconductor Silicon Wafer by Region, 2023 VS 2030
Figure 54. Semiconductor Silicon Wafer Industry Value Chain
Figure 55. Marketing Channels