Quartz Tank for Semiconductor Market, Trends, Business Strategies 2026-2034

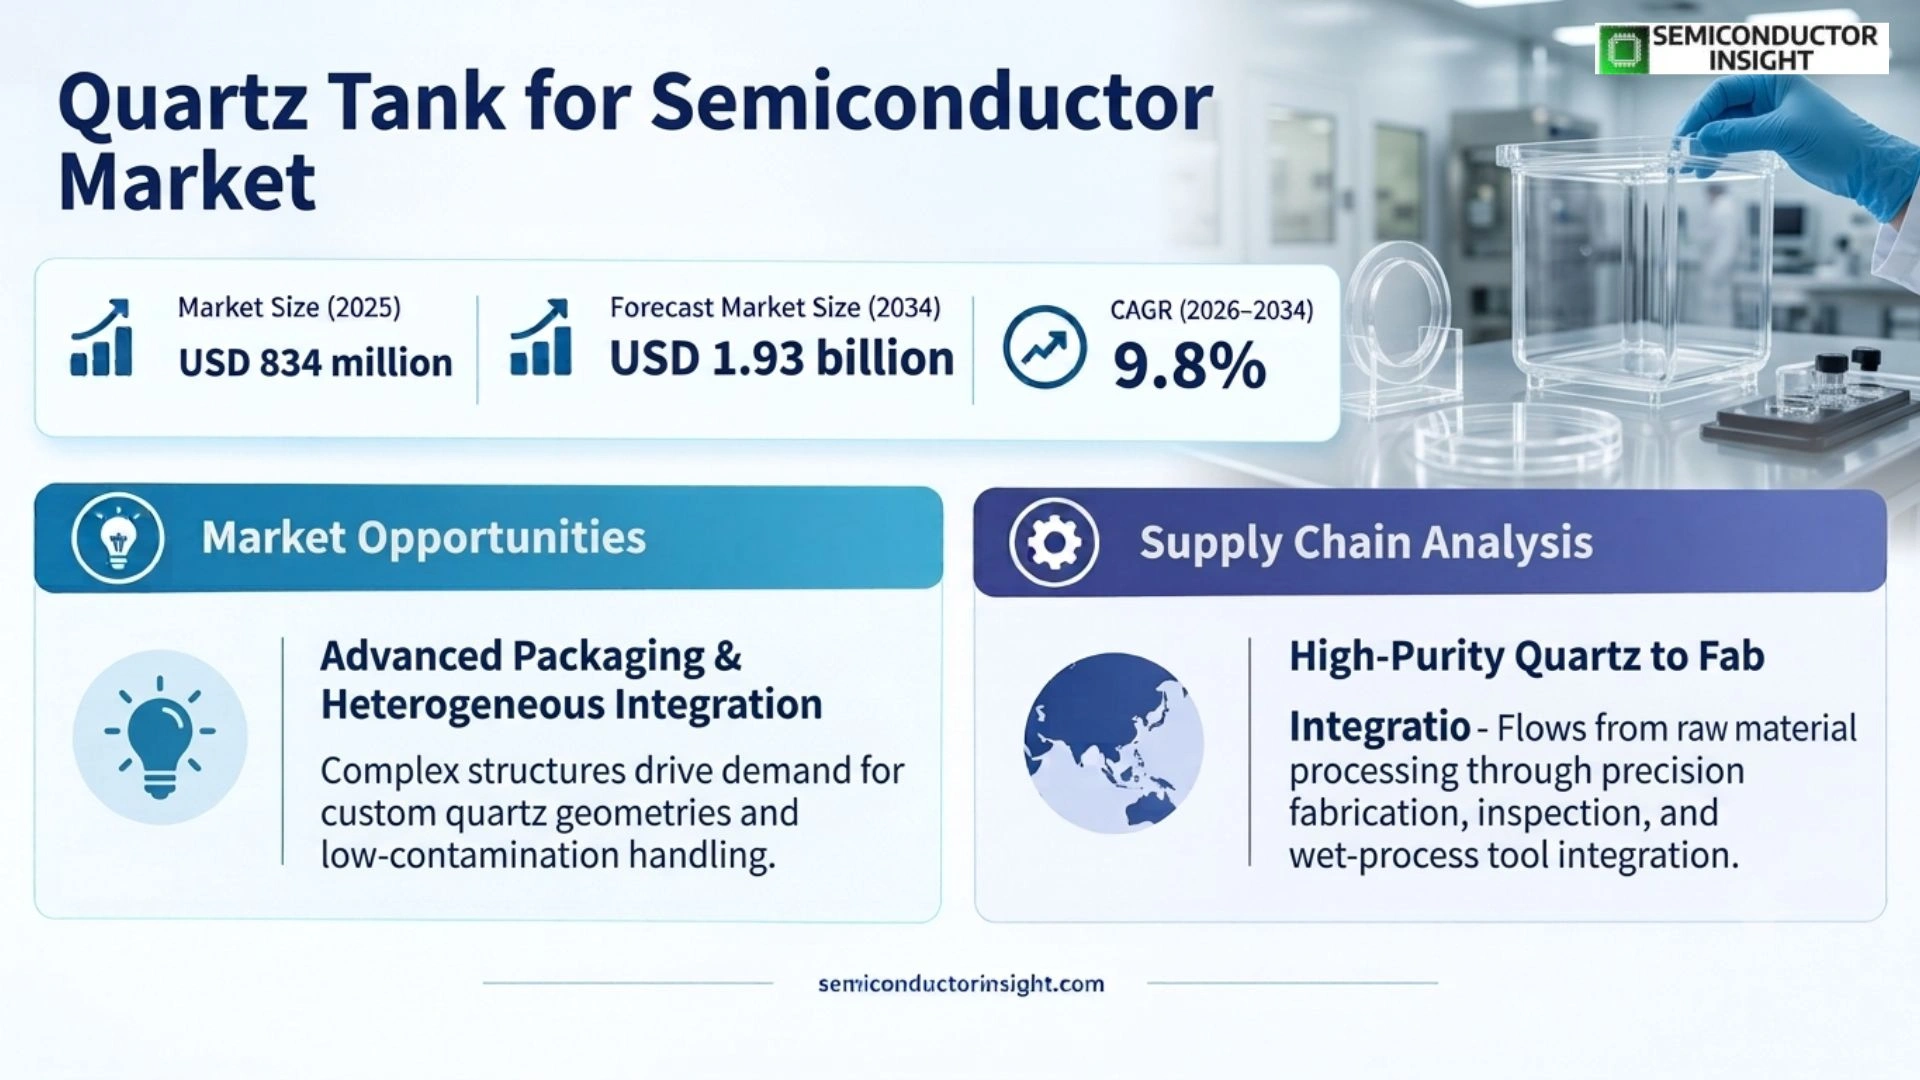
Quartz tank for semiconductor market is scales from USD 834 million in 2025 to USD 1.93 billion by 2034, corresponding to a 9.8% CAGR from 2026 to 2034.

PDF Icon Download Sample Report PDF
  • Quick Dispatch

    All Orders

  • Secure Payment

    100% Secure Payment

Price range: $1,500.00 through $4,250.00

Clear

Key Statistics

2025 Market Size
USD 834 million
2034 Projected Size
USD 1.93 billion
CAGR (2026–2034)
9.8%
Largest Market in 2025
Asia Pacific

Key Takeaways

  • Transparent quartz tanks remain the leading type because process engineers can visually inspect loading and chemical activity while retaining the purity and thermal stability required in wet semiconductor processing.
  • Silicon nitride etching is the key application anchor in the report scope, while RCA cleaning remains structurally important because contamination control becomes harder as wafer geometries and material stacks become more demanding.
  • Asia Pacific is the largest regional market because China, Taiwan, South Korea and Japan remain the densest cluster of semiconductor wafer fabrication, creating a higher installed base of wet-processing tools that consume fabricated quartzware.
  • Advanced-node and advanced-packaging investment supports demand because quartz tanks sit close to the process step and must preserve chemical compatibility, dimensional stability and low contamination as fabs introduce more sensitive structures.
  • High-purity material qualification and long replacement cycles restrain switching, giving established quartz fabricators an advantage in applications where contamination events, dimensional drift or surface defects can translate into yield loss and lengthy requalification.

Quartz Tank for Semiconductor Market Overview

Quartz tank for semiconductor market is anchored by wet-process applications requiring chemically resistant, thermally stable and ultra-clean process vessels. Based on the published market anchors, the market scales from USD 834 million in 2025 to USD 1.93 billion by 2034, corresponding to a 9.8% CAGR from 2026 to 2034. Asia Pacific is the largest demand centre because the region concentrates leading-edge and mature-node wafer fabrication.

Base year: 2025 · Forecast period: 2026–2034 · Historical data: 2020–2024 · Values in USD

A semiconductor quartz tank is a fabricated vessel used to hold wafers, carriers, chemicals or process assemblies during wet treatment steps. In the report scope, the two principal product types are transparent and translucent quartz tanks, while the application set comprises resist stripping, silicon nitride etching, RCA cleaning and other wet processes. The product is therefore not a generic glass container; it is a precision process component whose purity, geometry, thermal behaviour and surface condition are tied directly to semiconductor yield.

Demand is linked to the number, size and sophistication of wet-process tools installed in wafer fabs. A new 300 mm fabrication line adds cleaning, stripping and etching steps, and each tool family can require multiple quartz tanks, basins, liners or related fabricated parts. Ferrotec states that its quartz products support semiconductor processing involving high heat and chemicals and that its fabricated portfolio includes tanks and cleaning basins. The commercial implication is that tank demand follows both fab capacity additions and replacement intensity inside mature fabs.

The market is changing because semiconductor production is becoming simultaneously more capital-intensive and more geographically distributed. The Semiconductor Industry Association reported global semiconductor sales of USD 791.7 billion in 2025, up 25.6% from 2024, while TSMC has continued to expand its Arizona footprint with multiple wafer fabs and advanced-packaging facilities. Each additional fabrication cluster creates procurement demand for process consumables and fabricated quartzware, but qualification requirements limit the number of suppliers that can immediately participate.

The scope includes fabricated quartz tanks used in semiconductor wet processing, with transparent and translucent constructions, and the application categories listed in the source report. It excludes unrelated laboratory glassware, consumer glass products and non-semiconductor industrial vessels that do not meet semiconductor contamination-control requirements. This boundary matters commercially because semiconductor-grade quartz is purchased on process compatibility and qualification history rather than simply on volume or commodity glass pricing.

Segment Analysis: By Type

By type, the market is segmented into transparent quartz tanks and translucent quartz tanks. Transparent tanks have the stronger process position because visual inspection, light transmission and established process familiarity support broad use in wet stations, while translucent constructions serve applications where a controlled opacity or material preference is acceptable and cost or fabrication characteristics can outweigh visibility.

Type Function Market position
Transparent Quartz Tanks High-visibility fused quartz vessel for wet process chemistry Largest type. Visual access can simplify loading checks and process observation, while high purity and chemical resistance support resist stripping, etching and cleaning environments. Buyers emphasise low metallic contamination, dimensional repeatability, surface finish and compatibility with the specific chemistry and temperature profile.
Translucent Quartz Tanks Opaque or semi-opaque quartz construction used where optical visibility is less important Smaller but established segment. Demand is tied to applications where material behaviour, thermal resistance and fabrication economics are more important than visual inspection. Suppliers compete through grade selection, fabrication consistency and the ability to reproduce approved geometries over long production runs.

Material and geometry considerations

Quartz selection is increasingly treated as a process-control decision rather than a simple material purchase. Ferrotec identifies multiple grades, including low-alkali and low-aluminum options, and supports clear fused as well as opaque materials. For a tank supplier, the commercial value therefore extends beyond forming the vessel: grade selection, welding or joining quality, dimensional control, surface condition and cleaning protocols determine whether the part survives chemical exposure without introducing particles or trace-metal contamination. This raises qualification costs but also protects approved suppliers from rapid substitution.

Segment Analysis: By Application

By application, the market covers resist stripping, silicon nitride etching, RCA cleaning and others. Silicon nitride etching provides a major demand anchor because the process combines aggressive chemistry with tight contamination control, while RCA cleaning supports recurring consumption because wafer cleaning is repeated across multiple fabrication stages rather than being a one-time process.

Application Demand characteristics
Resist Stripping Demand is triggered when patterned wafers require controlled removal of photoresist after lithography or etch steps. Procurement focuses on chemical compatibility, temperature stability and low particle contribution because residues can re-enter downstream steps. Suppliers benefit when they can reproduce complex geometries while maintaining the same surface quality across recurring replacement orders.
Silicon Nitride Etching Demand is driven by etch processes where corrosive chemistry and contamination sensitivity coexist. Process engineers favour high-purity quartz with stable dimensions because changes in tank geometry can alter fluid motion, while metallic contamination or surface defects can compromise yield. Long qualification cycles make reliability, traceability and process history important commercial differentiators.
RCA Cleaning The purchasing trigger is repeated wafer cleaning for organic, particulate and metallic contamination control. Tanks must tolerate recurring chemical exposure and elevated temperatures without excessive surface degradation. Because cleaning steps recur throughout front-end manufacturing, fabs purchase both initial systems and replacement quartzware, supporting an aftermarket that rewards suppliers able to provide predictable lead times and consistent cleaning quality.
Others Other applications include supporting wet-process functions and specialised chemical treatments where quartz is preferred because alternatives can create contamination, thermal or chemical compatibility concerns. The segment is fragmented by process, which favours vendors capable of custom design, small-batch engineering and rapid iteration rather than purely high-volume standardised production.

Quartz Tank for Semiconductor Market Size & Share

Regional Analysis

Asia Pacific is the largest and fastest-growing regional market because wafer fabrication capacity remains concentrated in China, Taiwan, South Korea and Japan, while North America is gaining importance through U.S. fab localization and Europe remains a smaller but technically demanding procurement market. Regional demand therefore follows the location of wet-process tool installations, replacement cycles and new fab construction.

What differentiates regional quartz tank demand?

Regional demand follows different commercial mechanisms. Asia Pacific benefits from dense semiconductor manufacturing and a deep ecosystem of quartz fabricators, equipment makers and component processors. North America is adding new fab capacity that creates greenfield demand but also pushes customers to qualify local supply for continuity. Europe combines mature semiconductor operations with strict environmental and chemical-management expectations. South America remains limited by the absence of a large wafer-fab base, while the Middle East and Africa are still early-stage markets whose demand is tied to emerging electronics and technology investments.

Region Position Growth outlook Demand profile What decides supplier selection
Asia Pacific Largest Highest Fab concentration and replacement demand Local fabrication depth, purity qualification, lead time
North America Second High Greenfield fabs and technology localization Qualification, delivery assurance, domestic support
Europe Third Moderate Mature fabs, specialty production, compliance Traceability, process control, environmental compliance
South America Fourth Low to moderate Limited semiconductor manufacturing Imported supply, landed cost, technical support
Middle East & Africa Smallest Emerging Technology infrastructure and niche electronics Import logistics, technical capability, project timing
Asia Pacific LARGEST & FASTEST-GROWING

Why does Asia Pacific lead the quartz tank market?

Asia Pacific leads because it combines the world’s highest concentration of semiconductor wafer fabrication with a mature supplier network for fabricated quartzware. Taiwan and South Korea anchor advanced memory and logic production, Japan contributes established equipment and materials capabilities, and China continues to add domestic wafer capacity. That density increases the installed base of wet-processing tools and creates both greenfield demand and recurring replacement demand for qualified quartz tanks.

Market positionLargest region
Growth outlookHighest growth
Demand profileFab-concentration led
Market access gatePurity qualification and local lead time
Country Position in region What drives demand
China Largest manufacturing base Fabs expand alongside domestic equipment and materials supply. Local sourcing is gaining importance where fabs and tool makers seek shorter lead times, while qualification still rewards consistent chemistry resistance and low-contamination performance.
Taiwan Leading advanced-node cluster High-volume foundry production creates dense recurring demand for wet-process components. Suppliers compete on tight dimensional control, rapid replacement and the ability to support exacting fab specifications.
South Korea Memory-led cluster Large memory fabs require repeated cleaning and etch steps, supporting demand for durable quartzware with stable dimensions and proven chemical compatibility. Long qualification histories can make incumbency especially valuable.
Japan Established materials hub Japan combines semiconductor manufacturing with deep precision-quartz expertise. Buyers value quality systems, material-grade consistency and engineering support, giving specialist fabricators a route to premium applications.

Market instances

  • In 2025, global semiconductor sales reached USD 791.7 billion, up 25.6% year on year; why it matters: larger semiconductor output broadens the installed base of wet-process equipment; market impact: quartzware suppliers face stronger recurring demand across multiple fab clusters. Source.
  • Ferrotec reports a global fabricated-quartz operation supporting semiconductor OEMs and lists tanks and cleaning basins among its products; why it matters: tanks sit inside a broader qualified quartzware ecosystem; market impact: suppliers can capture value through bundled process-component relationships. Source.
  • TSMC’s Arizona expansion includes multiple logic fabs and advanced packaging facilities; why it matters: greenfield capacity creates localized demand for wet-process infrastructure; market impact: quartz suppliers with U.S. support and qualification capabilities gain a new addressable procurement cluster. Source.

Asia Pacific’s advantage is scale and ecosystem depth: the same geography hosts wafer fabs, semiconductor equipment makers, quartz fabricators and service providers, shortening feedback loops between process engineering and component production. This structure supports faster customisation and replacement response than a market served entirely through imports, making local technical presence a commercial advantage even when product performance is comparable.

North America SECOND-LARGEST

How is the North American quartz tank market changing?

North America is moving from a mature replacement-oriented market toward a mixed model that includes new greenfield semiconductor fabs. U.S. policy support and major private investments are increasing domestic wafer capacity, especially in Arizona and other semiconductor clusters. The consequence for quartz tanks is not simply more volume; it is a stronger requirement for qualified local inventory, engineering response and supply continuity during fab ramp-up, where a late component can affect tool uptime and qualification schedules.

Market positionSecond-largest
Growth outlookHigh
Demand profileGreenfield plus replacement
Market access gateDomestic support and qualification
Country Position in region What drives demand
United States Dominant demand centre New fab construction is the main growth mechanism. Suppliers that can support customer qualification, local stocking and replacement engineering gain relevance as fabs move from construction into production.
Canada Smaller electronics base Demand is more niche and connected to research, specialty semiconductor activity and downstream electronics. Imported quartzware remains practical, so distributor capability and technical support weigh heavily.
Mexico Emerging electronics base Demand is tied more closely to electronics assembly and industrial supply chains than to advanced wafer fabrication. Long-term opportunity depends on deeper semiconductor manufacturing localisation and supporting process infrastructure.

Market instances

  • In 2026, TSMC reported continued acceleration of its Arizona expansion and described plans for a multi-fab U.S. cluster; why it matters: more leading-edge capacity requires full wet-process infrastructure; market impact: qualified quartzware demand becomes part of regional fab localization. Source.
  • TSMC’s 2026 AGM materials state that its first Arizona fab entered high-volume production in 4Q2024 and that the second fab is planned for volume manufacturing in 2H2027; why it matters: construction converts into operational tool demand; market impact: replacement and qualification programs for quartz tanks can begin well before steady-state output. Source.
  • SIA reported U.S.-linked market demand within a global semiconductor market that continued to expand through 2026; why it matters: stronger end-market chip demand increases fab utilisation; market impact: consumables and process components experience greater pull-through as utilisation rises. Source.

North America is commercially distinctive because new capacity is being built with resilience and localization goals alongside cost objectives. Quartz suppliers therefore compete on engineering response and delivery certainty as much as price, and the ability to maintain approved specifications through ramp-up becomes a stronger differentiator than adding another commodity fabrication line.

Europe THIRD-LARGEST

What shapes the European quartz tank market?

Europe is a smaller demand pool than Asia Pacific or North America, but the commercial requirements are unusually specification-heavy. Semiconductor manufacturing is concentrated in a limited number of advanced and specialty clusters, while chemical-management, environmental and worker-safety requirements affect wet-process system design. Quartz suppliers therefore need stronger documentation, traceability and process-control evidence, and buyers place greater value on consistency over short-term unit-price reductions when a vessel is part of a validated process.

Market positionThird-largest
Growth outlookModerate
Demand profileSpecialty and mature fabs
Market access gateTraceability and compliance
Country Position in region What drives demand
Germany Industrial semiconductor hub Demand is connected to automotive and industrial semiconductor activity plus equipment manufacturing. Buyers value process documentation and supply stability, particularly when quartz components interface with complex wet systems.
France Specialty semiconductor base Demand is concentrated in specialty and mixed-technology production, where custom geometries can matter more than standard high-volume designs. Engineering support is therefore commercially important.
Netherlands Equipment ecosystem anchor The country’s role in semiconductor equipment raises indirect demand for high-quality process components across European supply chains even where domestic wafer fabrication is more limited.

Market instances

  • EU industrial policy continues to support semiconductor capacity and ecosystem resilience; why it matters: European fabs need locally supportable process infrastructure; market impact: qualified quartz suppliers can capture premium engineering and service relationships.
  • European environmental and chemical-management requirements increase documentation and process-control expectations; why it matters: tank material and cleaning practices must remain compatible with regulated operations; market impact: suppliers with stronger quality systems gain a relative advantage.
  • European semiconductor manufacturing remains tightly linked to automotive and industrial demand; why it matters: mature-node utilisation can remain resilient even when leading-edge cycles fluctuate; market impact: replacement demand can cushion project timing volatility.

Europe’s key advantage is qualification discipline. A supplier that can document material grade, fabrication process, cleaning, inspection and change control can defend its position even without the lowest price. The region therefore rewards quality-system maturity and process continuity, with premium margins concentrated in specialised rather than standard tank configurations. This makes qualification records, material traceability and controlled change management important commercial filters for premium European accounts, especially where downtime is costly.

South America FOURTH

What limits South American quartz tank demand?

South America remains a small market because semiconductor front-end manufacturing is limited compared with the major Asian, North American and European clusters. Demand is consequently more project-driven and import-dependent. Brazil provides the deepest potential through electronics and industrial technology initiatives, but the commercial case for local quartz fabrication depends on whether wafer-fab investment becomes large enough to justify dedicated semiconductor-grade supply infrastructure rather than relying on imports from the established global supplier base.

Market positionFourth
Growth outlookLow to moderate
Demand profileImport dependent
Market access gateLanded cost and logistics
Country Position in region What drives demand
Brazil Largest opportunity Industrial and electronics activity gives the country the strongest potential for semiconductor process-component demand. Import lead time and exchange-rate exposure remain important procurement considerations.
Argentina Small specialty base Demand is limited and primarily tied to research and specialised electronics. Suppliers typically serve the market from regional or overseas manufacturing facilities.
Chile Emerging technology market Potential is linked to advanced electronics, research and industrial projects rather than a large front-end fab cluster. Technical support can be more important than local production.

Market instances

  • Regional electronics investment remains smaller than in established fab clusters; why it matters: local volumes do not yet justify the same dedicated supplier network; market impact: imports remain the default route for semiconductor-grade quartz tanks.
  • Currency and freight volatility can materially affect landed component cost; why it matters: quartz tanks are bulky and carefully packed, making logistics part of the purchase decision; market impact: regional distributors can create value by holding safety stock.
  • Research and specialty electronics programmes can require custom process vessels in modest quantities; why it matters: low-volume engineering capability can matter more than scale; market impact: specialist suppliers can address niche demand without building full local manufacturing.

South America’s path to growth is tied less to semiconductor consumption and more to whether front-end manufacturing capacity becomes geographically established. Until then, suppliers with export logistics, protective packaging, technical documentation and responsive engineering support are better positioned than companies relying on local high-volume fabrication economics. Until front-end capacity deepens, suppliers create more value through dependable export logistics, protected packaging and application support than through large regional manufacturing footprints.

Middle East & Africa EMERGING

Where can Middle East and Africa demand develop?

The Middle East and Africa remain emerging quartz-tank markets because front-end semiconductor manufacturing is limited, but technology investment and industrial diversification can create niche requirements. The strongest commercial opportunities are likely to come from research, specialty electronics, advanced industrial projects and any future semiconductor manufacturing clusters. Imported products will remain important, so suppliers able to manage international logistics, technical support and qualification packages can enter before a larger local manufacturing base develops.

Market positionEmerging
Growth outlookEmerging
Demand profileProject and research led
Market access gateImport support and technical service
Country Position in region What drives demand
Israel Most established semiconductor base The country has a meaningful semiconductor and advanced-electronics ecosystem, supporting specialised demand for wet-process components and engineering services.
Saudi Arabia Technology investment opportunity Industrial diversification and technology programmes create longer-term opportunity, but current demand for semiconductor-specific quartz tanks remains smaller than in established fab regions.
United Arab Emirates Regional technology hub Demand is more likely to arise from advanced electronics infrastructure, research and industrial projects than from a deep domestic wafer-fab base.

Market instances

  • Technology investment programmes in the Gulf are increasing emphasis on advanced electronics and industrial localisation; why it matters: process-component requirements can follow equipment and fab projects; market impact: suppliers with regional partnerships gain earlier access to emerging demand.
  • Israel’s advanced semiconductor ecosystem sustains specialist process-equipment requirements; why it matters: complex wet processing depends on qualified components; market impact: high-spec quartz suppliers can target premium niches even without mass regional volume.
  • Import-led procurement remains typical where local fabrication is limited; why it matters: delivery and technical support can become the deciding factors; market impact: distributors and service partners can capture value alongside component manufacturers.

The region’s commercial logic is project timing rather than installed-base density. Suppliers should therefore favour flexible engineering, export documentation and local technical representation rather than building large dedicated capacity too early. A successful foothold can, however, become strategically valuable when regional electronics manufacturing expands from assembly into higher-value semiconductor processes.

Key Quartz Tank Manufacturers and Competitive Landscape

Competition is centred on specialist fabricated-quartz companies with semiconductor customer relationships, material expertise and the ability to reproduce qualified geometries. The report profiles Tosoh Quartz Group, Ferrotec, Wacom Quartz, Daico Mfg, Pyromatics, TOCHANCE TECHNOLOGY, SCREEN SPE Quartz, Jiangsu Hongwei Quartz Technology, Huzhou Dongke Electron Quartz and Cheng-Hwa Technology. Commercial competition is shaped by purity, dimensional consistency, custom engineering, lead time and global service rather than by commodity glass pricing alone.

The key suppliers list is presented directly because procurement decisions are usually qualification-led. Ferrotec, for example, states that it has been fabricating precision quartzware for the semiconductor industry since 1987 and operates manufacturing facilities in Japan and China. Its portfolio includes tanks, cleaning basins, tubes, liners and boats, showing how suppliers can deepen customer relationships by offering multiple process components rather than a single vessel type.

Competitive advantage is strongest when a supplier can control material sourcing, fabrication, cleaning and inspection as one quality chain. Ferrotec identifies multiple qualified quartz material sources and multiple fabrication grades, while the broader supplier set combines Japanese, Taiwanese, Chinese and U.S. capabilities. Buyers benefit from this diversity, but qualification costs make frequent supplier changes unattractive, especially for tanks supporting critical wet steps where a dimensional or surface change can alter process conditions.

Key Industry Players

  • Tosoh Quartz Group
  • Ferrotec
  • Wacom Quartz
  • Daico Mfg
  • Pyromatics
  • TOCHANCE TECHNOLOGY
  • SCREEN SPE Quartz
  • Jiangsu Hongwei Quartz Technology
  • Huzhou Dongke Electron Quartz
  • Cheng-Hwa Technology

Competitive structure

Tier Players Competitive basis
Tier 1 Tosoh Quartz Group; Ferrotec Global semiconductor relationships, fabricated-quartz breadth, material expertise and process qualification
Tier 2 Wacom Quartz; Daico Mfg; Pyromatics; SCREEN SPE Quartz Specialist fabrication, custom engineering, regional service and process-specific capability
Tier 3 TOCHANCE TECHNOLOGY; Jiangsu Hongwei Quartz Technology; Huzhou Dongke Electron Quartz; Cheng-Hwa Technology Regional cost competitiveness, localisation, shorter lead times and growing fabrication sophistication

Quartz Tank Production Capacity Analysis

Production is concentrated around precision quartz-fabrication clusters in Japan, China, Taiwan and the United States, while raw material qualification and clean fabrication are the main practical constraints. Capacity is not determined simply by furnace or machining availability: semiconductor customers also require stable material grades, trained fabrication teams, inspection capability and controlled cleaning. As fabs proliferate geographically, the strongest suppliers are adding regional manufacturing or support without sacrificing central quality control.

Ferrotec describes three manufacturing facilities in Japan and one in China for its fabricated-quartz business, with design and prototyping capability in Japan. That footprint illustrates the capacity model used by specialist suppliers: engineering remains concentrated where experience is deepest, while manufacturing is distributed closer to customer clusters. This reduces logistics risk and shortens response time without forcing every facility to replicate the entire engineering and quality system.

The upstream risk sits mainly in high-purity quartz grades and qualified processing capability. Ferrotec lists materials from several major quartz sources and identifies multiple grades, including low-alkali and low-aluminum options. This means a supplier can mitigate single-source material risk, but qualifying an alternate grade or fabricator still takes customer engineering time. The commercial bottleneck is therefore a combination of material availability and qualification speed, not raw silica volume alone.

Quartz Tank Market Dynamics: Drivers, Restraints and Opportunities

Market growth is supported by semiconductor fab expansion, higher wafer-processing intensity, advanced-node contamination control and greater localisation of semiconductor supply chains. Restraints include qualification time, high-purity material dependence, long fabrication cycles for custom tanks and substitution by non-quartz materials in selected wet-process applications. Opportunities are concentrated in advanced packaging, new fab geographies and higher-purity process solutions.

MARKET DRIVERS

Drivers Impact Analysis*

Driver / Restraint (~) % impact on CAGR forecast Geographic relevance Impact timeline
Semiconductor fab expansion and higher wet-process tool installations +1.5% Asia Pacific, North America, Europe Immediate to long term
Advanced-node contamination control and tighter process windows +1.1% Asia Pacific, North America, Europe Medium to long term
Geographic localisation of semiconductor manufacturing +0.9% North America, Europe, Southeast Asia Medium term
Higher recurring replacement demand in mature fabs +0.7% Asia Pacific, Japan, Europe Immediate to medium term

Semiconductor fab expansion increases quartzware pull-through

The strongest demand mechanism is the addition and utilisation of wafer-fabrication capacity. A fab ramp requires cleaning, stripping and etching tools, and those tools use process-contact components made from materials selected for purity and chemical resistance. As equipment counts rise, suppliers receive demand not only for the initial installation but also for qualified replacements and engineering changes, which creates a layered revenue stream rather than a one-time capital-equipment sale.

Advanced nodes raise the value of contamination control

Smaller geometries do not necessarily require more quartz tanks per wafer, but they increase the economic cost of particles, metals and surface defects. That raises buyer sensitivity to material grade, cleaning, inspection and change control. Quartz suppliers that can demonstrate stable surface condition and low contamination through controlled fabrication therefore capture more value than companies competing only on vessel dimensions or nominal capacity.

Localization creates regional qualification opportunities

As wafer fabrication moves into new geographies, fabs seek local supply chains without compromising process qualification. Quartz tank suppliers can benefit by combining global process standards with local stock, application support and repair capability. The commercial opportunity is strongest in new fab clusters where buyers are establishing supplier panels from the beginning, because early qualification can persist through multiple process generations.

MARKET RESTRAINTS

Restraints Impact Analysis*

Driver / Restraint (~) % impact on CAGR forecast Geographic relevance Impact timeline
Qualification and change-control requirements −0.8% Global Immediate to long term
High-purity material cost and sourcing risk −0.7% Global Short to medium term
Alternative materials in selected wet steps −0.4% Global, selected processes Medium to long term
Custom fabrication lead times −0.3% North America, Europe, Asia Pacific Short to medium term

Qualification slows supplier switching

Quartz tanks are process-contact components, so switching suppliers can involve dimensional verification, cleaning qualification and compatibility testing. This protects incumbent suppliers but also slows adoption of new entrants. A supplier with a lower nominal price can still lose on total cost if the customer expects lengthy requalification, making market access depend on engineering credibility and documentation as much as production economics.

High-purity material costs can pressure margins

Semiconductor-grade quartz requires controlled impurity levels and consistent material grades. When upstream material costs rise or a particular grade becomes constrained, tank fabricators may face margin pressure because customer contracts do not always allow rapid repricing. Larger suppliers can manage this better through multi-source procurement and higher-value engineering relationships. Suppliers with multiple qualified grades and documented incoming inspection can therefore reduce procurement risk while preserving a differentiated position with customers running sensitive wet-process recipes.

Alternative materials limit the addressable opportunity in selected processes

PFA and advanced ceramics can compete in selected wet-process environments where mechanical design, weight or chemical behaviour creates an advantage. Quartz remains strong where purity and thermal stability are central, but suppliers cannot assume every future wet-processing application will remain quartz-based. The commercial response is to improve surface engineering, geometry and process-specific durability rather than relying on incumbent material status.

Custom designs increase lead-time risk

Large or unusual tanks can require specialised forming, welding, inspection and shipping arrangements. The issue is not simply machining time; it is the sequence of fabrication, cleaning and inspection needed to deliver an approved part. Suppliers with engineering standardisation, local service and spare inventory can turn this constraint into an advantage over small fabricators with attractive nominal pricing but inconsistent delivery.

MARKET OPPORTUNITIES

Advanced packaging and heterogeneous integration

Advanced packaging introduces cleaning and etch requirements for more complex structures, creating demand for application-specific quartz geometries and low-contamination handling. Suppliers benefit where they can co-design tanks with process-equipment makers rather than selling standard vessels, because the component becomes part of the process architecture and is less easily commoditised. The opportunity is strongest for fabricators that can co-design geometry with equipment makers, because customised process contact surfaces are harder to replace after qualification.

Regional support around new semiconductor clusters

The expansion of wafer fabs in the United States, Southeast Asia and other emerging clusters creates an opportunity for suppliers to localise inventory and technical service before customers establish mature replacement channels. Early participation can reduce lead time, improve engineering response and create preferred-supplier status across future fab expansions. The commercial consequence is that process qualification and repeatability can outweigh nominal unit price when the component sits directly inside a validated wet-process tool.
Higher-purity and low-contamination fabrication

As process windows tighten, customers can place greater value on low-alkali and low-aluminum grades, controlled cleaning and traceable inspection. Suppliers that invest in these capabilities can defend premium pricing because the buyer is purchasing risk reduction as much as material quantity. This opportunity is strongest in advanced-node logic and memory environments where yield sensitivity is high.

Bundled quartzware supply relationships

A supplier that can provide tanks together with basins, liners, tubes, boats and related fabricated parts can simplify procurement and reduce qualification complexity. Ferrotec’s broad quartzware portfolio illustrates this model. The commercial implication is higher account penetration, better demand visibility and a stronger barrier to displacement by a single-product competitor.

Selected evidence points from the supply ecosystem

Several operating and market indicators help explain the demand mechanism without changing the report’s market definition. SIA reported 2025 semiconductor sales of USD 791.7 billion compared with USD 630.5 billion in 2024, while TSMC’s Arizona plans now encompass 6 logic fabs, 2 advanced-packaging facilities and 1 research centre. Ferrotec reports 1987 as the starting point for its semiconductor quartz fabrication business, 3 manufacturing facilities in Japan and 1 in China, plus more than 150 employees in the quartz operation. These figures show why regional capacity, qualification and supplier scale matter to quartz tank demand.

Reference point Year / period Value Commercial relevance
Global semiconductor sales 2025 USD 791.7 billion Higher chip output increases utilisation of wet-process equipment and recurring process-component consumption.
Global semiconductor sales 2024 USD 630.5 billion The prior-year base shows the scale of the semiconductor demand cycle feeding process infrastructure.
Annual semiconductor sales growth 2025 vs 2024 25.6% A strong industry-wide expansion supports fab utilisation and supplier activity.
SIA Q4 semiconductor sales Q4 2025 USD 236.6 billion Quarterly strength reinforces sustained semiconductor manufacturing demand.
SIA monthly semiconductor sales Dec. 2025 USD 78.9 billion Monthly scale illustrates the breadth of demand supported by wafer fabrication.
Asia Pacific semiconductor sales growth 2025 45.0% Regional growth supports the strongest installed-base expansion for wet-process components.
Americas semiconductor sales growth 2025 30.5% North American fab investment adds another demand cluster for qualified quartzware.
Ferrotec semiconductor quartz fabrication history Since 1987 39 years by 2026 Long operating experience supports qualification credibility with semiconductor OEMs.
Ferrotec quartz manufacturing footprint Current 3 Japan; 1 China Regional capacity allows shorter lead times while retaining specialist fabrication expertise.
Ferrotec quartz operation workforce Current 150+ employees A specialist workforce supports precision fabrication, inspection and customer engineering.
Ferrotec quartz material grades listed Current 114; 124; 214; 224; 244 Multiple material choices support process-specific purity and chemical compatibility.
TSMC Arizona product ecosystem Current 12,000+ products served Large downstream demand base supports continued leading-edge fabrication investment.
TSMC Arizona business ecosystem Current 500+ companies Customer concentration supports large-scale fab investment and process-component pull-through.
TSMC Arizona planned logic fabs 2026 plan 6 fabs Multiple fabs create a durable U.S. market for wet-process infrastructure and components.
TSMC Arizona advanced packaging facilities 2026 plan 2 facilities Packaging expansion broadens demand beyond front-end logic fabrication.
TSMC Arizona R&D centre 2026 plan 1 centre R&D infrastructure supports development of future process requirements and component specifications.
TSMC first Arizona fab high-volume production Q4 2024 1st fab Operational production converts construction expenditure into recurring process-equipment demand.
TSMC second Arizona fab target 2H 2027 N3 / N2 The next production ramp extends the future addressable base for wet-process components.
TSMC third Arizona fab technologies End of decade target N2 / A16 More advanced process nodes raise contamination-control and component qualification requirements.

Quartz Tank Supply Chain Analysis

The supply chain runs from high-purity quartz material through precision fabrication and joining, cleaning and inspection, and finally semiconductor wet-process tool integration and fab use. Value concentrates at the fabrication and qualification stages because customers are buying controlled process performance rather than raw quartz mass. The commercial consequence is that process qualification and repeatability can outweigh nominal unit price when the component sits directly inside a validated wet-process tool.

UpstreamHigh-purity quartz grades, specialty fused silica, raw stock and qualified material batches
FabricationForming, machining, welding, dimensional control, surface finishing and custom geometry
Qualification & ChannelCleaning, inspection, packaging, documentation, spare inventory and application engineering
DownstreamWet benches, cleaning tools, etch/strip systems, wafer fabs, advanced packaging lines

Upstream

Material suppliers create the first control point because grade consistency, impurity profile and thermal behaviour determine downstream fabrication quality. A semiconductor quartz supplier cannot easily substitute material without customer approval, so procurement teams favour multiple qualified sources and controlled incoming inspection. The commercial implication is that raw-material relationships are strategic even when the tank fabricator performs most of the value-added work.

Fabrication

Precision forming is where raw quartz becomes an engineered semiconductor component. Geometry, wall thickness, joints and surface condition must remain stable across repeat orders. Process capability therefore matters more than nominal factory throughput, because a high-volume supplier that cannot hold dimensional tolerances will lose more value through rejects, requalification and customer complaints than it gains through additional output.

Qualification & Channel

After fabrication, tanks must be cleaned, inspected and packed to prevent contamination before entering the fab environment. Documentation, traceability and change-control records are part of the commercial package. Suppliers that maintain regional stock can shorten replacement lead time, while direct technical support helps diagnose whether a failure is caused by the quartz part, the process chemistry or the wet-tool configuration.

Downstream

Wet-process equipment makers and fabs determine final value capture because they specify geometry, material grade and process conditions. Once a tank is qualified, repeat purchases are linked to tool utilisation, preventive replacement and fab expansion. This makes customer integration a durable commercial advantage, with supplier changes more likely during a major tool redesign than during routine replacement.

Recent Developments in the Quartz Tank for Semiconductor Market

September 4, 2026

SIA reported that global semiconductor sales reached USD 146.8 billion in July 2026, up 6.4% from June and 135.1% from July 2025. The significance for quartz tanks is indirect but clear: stronger chip output increases utilisation of wafer-processing infrastructure, supporting recurring demand for process-contact quartzware. Source. The commercial consequence is that process qualification and repeatability can outweigh nominal unit price when the component sits directly inside a validated wet-process tool.

April 23, 2025

Ferrotec announced the groundbreaking of its second high-technology manufacturing facility in Kulim, Malaysia. The development matters to quartzware buyers because regional manufacturing can shorten response times in Southeast Asia while supporting the wider semiconductor ecosystem around Malaysia. Source. The commercial consequence is that process qualification and repeatability can outweigh nominal unit price when the component sits directly inside a validated wet-process tool.

April 2025

TSMC reported continued progress on its Arizona expansion, including construction progress for additional fabs and a growing U.S. manufacturing footprint. The market implication is a larger U.S. procurement base for semiconductor process components, including fabricated quartzware used in wet-processing systems. Source. The commercial consequence is that process qualification and repeatability can outweigh nominal unit price when the component sits directly inside a validated wet-process tool.

January 2026

TSMC’s fourth-quarter 2025 earnings call described strong AI-driven demand and accelerated capacity expansion in Taiwan and Arizona. This matters for quartz tank suppliers because sustained utilisation and capacity additions create both new-tool and replacement demand for process-contact parts. Source. The commercial consequence is that process qualification and repeatability can outweigh nominal unit price when the component sits directly inside a validated wet-process tool.

REPORT SCOPE & SEGMENTATION

Attribute Scope
Market Quartz Tank for Semiconductor Market
Base year / forecast 2025 / 2034
Historical period 2020–2024
Type Transparent Quartz Tanks; Translucent Quartz Tanks
Application Resist Stripping; Silicon Nitride Etching; RCA Cleaning; Others
End user Semiconductor foundries; Integrated device manufacturers (IDMs); Research and development facilities
Regions North America; Europe; Asia Pacific; South America; Middle East & Africa
Profiled companies Tosoh Quartz Group; Ferrotec; Wacom Quartz; Daico Mfg; Pyromatics; TOCHANCE TECHNOLOGY; SCREEN SPE Quartz; Jiangsu Hongwei Quartz Technology; Huzhou Dongke Electron Quartz; Cheng-Hwa Technology

Frequently Asked Questions

What is the 2025 size of the quartz tank for semiconductor market?

The rebased 2025 market size is USD 834 million. The figure represents the 2025 market level used throughout the article’s Key Statistics, Overview, Scope and FAQ sections. The commercial consequence is that process qualification and repeatability can outweigh nominal unit price when the component sits directly inside a validated wet-process tool.

What is the projected 2034 size of the market?

The rebased 2034 market size is USD 1.93 billion. This endpoint reflects the market trajectory used for the 2025–2034 forecast window. The commercial consequence is that process qualification and repeatability can outweigh nominal unit price when the component sits directly inside a validated wet-process tool.

What CAGR is used for 2026–2034?

The article uses a 9.8% CAGR for 2026–2034. The rate is derived from the two published market-size anchors and is kept consistent across the article rather than substituting a different growth estimate. The commercial consequence is that process qualification and repeatability can outweigh nominal unit price when the component sits directly inside a validated wet-process tool.

Which type is the leading quartz tank category?

Transparent quartz tanks are the leading type in the report scope because they combine the purity and chemical resistance expected from semiconductor-grade quartz with visual accessibility that can support wet-process inspection and handling. The commercial consequence is that process qualification and repeatability can outweigh nominal unit price when the component sits directly inside a validated wet-process tool.

Which application is the main demand anchor?

Silicon nitride etching is the principal application anchor in the report description, with resist stripping and RCA cleaning also representing important recurring wet-process demand. Procurement is shaped by chemistry compatibility, purity and geometry stability. The commercial consequence is that process qualification and repeatability can outweigh nominal unit price when the component sits directly inside a validated wet-process tool.

Which region leads the market?

Asia Pacific is the largest regional market because semiconductor wafer-fabrication capacity is heavily concentrated in China, Taiwan, South Korea and Japan. That installed manufacturing base supports both new-tool demand and replacement demand. The commercial consequence is that process qualification and repeatability can outweigh nominal unit price when the component sits directly inside a validated wet-process tool.

Which companies are profiled?

The profiled company universe includes Tosoh Quartz Group, Ferrotec, Wacom Quartz, Daico Mfg, Pyromatics, TOCHANCE TECHNOLOGY, SCREEN SPE Quartz, Jiangsu Hongwei Quartz Technology, Huzhou Dongke Electron Quartz and Cheng-Hwa Technology. The commercial consequence is that process qualification and repeatability can outweigh nominal unit price when the component sits directly inside a validated wet-process tool.

What makes semiconductor quartz tanks commercially different from ordinary glass vessels?

Semiconductor quartz tanks are process-contact components used in chemically aggressive wet steps, so buyers evaluate purity, impurity profile, geometry, thermal stability, surface condition, cleaning and traceability rather than treating the vessel as a commodity glass product. The commercial consequence is that process qualification and repeatability can outweigh nominal unit price when the component sits directly inside a validated wet-process tool.

What is the key production constraint?

The practical constraint is qualified precision fabrication rather than raw silica availability alone. Material-grade consistency, clean fabrication, dimensional control, inspection and customer qualification all need to work together before a tank can be released into a validated semiconductor process. The commercial consequence is that process qualification and repeatability can outweigh nominal unit price when the component sits directly inside a validated wet-process tool.

What opportunity is most relevant for suppliers?

The strongest opportunities combine semiconductor-fab expansion with more demanding process requirements. Suppliers that add regional support, higher-purity fabrication, custom engineering and bundled quartzware can increase account penetration while reducing the qualification and logistics burden for fabs. The commercial consequence is that process qualification and repeatability can outweigh nominal unit price when the component sits directly inside a validated wet-process tool.

Quartz Tank for Semiconductor Market, Trends, Business Strategies 2026-2034

Get Sample Report PDF for Exclusive Insights

Report Sample Includes

  • Table of Contents
  • List of Tables & Figures
  • Charts, Research Methodology, and more...

PDF Icon Download Sample Report PDF

Download Sample Report

Table of Content

1 Introduction to Research & Analysis Reports
1.1 Quartz Tank for Semiconductor Market Definition
1.2 Market Segments
1.2.1 Segment by Type
1.2.2 Segment by Application
1.3 Global Quartz Tank for Semiconductor Market Overview
1.4 Features & Benefits of This Report
1.5 Methodology & Sources of Information
1.5.1 Research Methodology
1.5.2 Research Process
1.5.3 Base Year
1.5.4 Report Assumptions & Caveats
2 Global Quartz Tank for Semiconductor Overall Market Size
2.1 Global Quartz Tank for Semiconductor Market Size: 2024 VS 2032
2.2 Global Quartz Tank for Semiconductor Market Size, Prospects & Forecasts: 2020-2032
2.3 Global Quartz Tank for Semiconductor Sales: 2020-2032
3 Company Landscape
3.1 Top Quartz Tank for Semiconductor Players in Global Market
3.2 Top Global Quartz Tank for Semiconductor Companies Ranked by Revenue
3.3 Global Quartz Tank for Semiconductor Revenue by Companies
3.4 Global Quartz Tank for Semiconductor Sales by Companies
3.5 Global Quartz Tank for Semiconductor Price by Manufacturer (2020-2025)
3.6 Top 3 and Top 5 Quartz Tank for Semiconductor Companies in Global Market, by Revenue in 2024
3.7 Global Manufacturers Quartz Tank for Semiconductor Product Type
3.8 Tier 1, Tier 2, and Tier 3 Quartz Tank for Semiconductor Players in Global Market
3.8.1 List of Global Tier 1 Quartz Tank for Semiconductor Companies
3.8.2 List of Global Tier 2 and Tier 3 Quartz Tank for Semiconductor Companies
4 Sights by Product
4.1 Overview
4.1.1 Segment by Type – Global Quartz Tank for Semiconductor Market Size Markets, 2024 & 2032
4.1.2 Transparent
4.1.3 Translucent
4.2 Segment by Type – Global Quartz Tank for Semiconductor Revenue & Forecasts
4.2.1 Segment by Type – Global Quartz Tank for Semiconductor Revenue, 2020-2025
4.2.2 Segment by Type – Global Quartz Tank for Semiconductor Revenue, 2026-2032
4.2.3 Segment by Type – Global Quartz Tank for Semiconductor Revenue Market Share, 2020-2032
4.3 Segment by Type – Global Quartz Tank for Semiconductor Sales & Forecasts
4.3.1 Segment by Type – Global Quartz Tank for Semiconductor Sales, 2020-2025
4.3.2 Segment by Type – Global Quartz Tank for Semiconductor Sales, 2026-2032
4.3.3 Segment by Type – Global Quartz Tank for Semiconductor Sales Market Share, 2020-2032
4.4 Segment by Type – Global Quartz Tank for Semiconductor Price (Manufacturers Selling Prices), 2020-2032
5 Sights by Application
5.1 Overview
5.1.1 Segment by Application – Global Quartz Tank for Semiconductor Market Size, 2024 & 2032
5.1.2 Resist Stripping
5.1.3 Silicon Nitride Etching
5.1.4 RCA Cleaning
5.1.5 Others
5.2 Segment by Application – Global Quartz Tank for Semiconductor Revenue & Forecasts
5.2.1 Segment by Application – Global Quartz Tank for Semiconductor Revenue, 2020-2025
5.2.2 Segment by Application – Global Quartz Tank for Semiconductor Revenue, 2026-2032
5.2.3 Segment by Application – Global Quartz Tank for Semiconductor Revenue Market Share, 2020-2032
5.3 Segment by Application – Global Quartz Tank for Semiconductor Sales & Forecasts
5.3.1 Segment by Application – Global Quartz Tank for Semiconductor Sales, 2020-2025
5.3.2 Segment by Application – Global Quartz Tank for Semiconductor Sales, 2026-2032
5.3.3 Segment by Application – Global Quartz Tank for Semiconductor Sales Market Share, 2020-2032
5.4 Segment by Application – Global Quartz Tank for Semiconductor Price (Manufacturers Selling Prices), 2020-2032
6 Sights by Region
6.1 By Region – Global Quartz Tank for Semiconductor Market Size, 2024 & 2032
6.2 By Region – Global Quartz Tank for Semiconductor Revenue & Forecasts
6.2.1 By Region – Global Quartz Tank for Semiconductor Revenue, 2020-2025
6.2.2 By Region – Global Quartz Tank for Semiconductor Revenue, 2026-2032
6.2.3 By Region – Global Quartz Tank for Semiconductor Revenue Market Share, 2020-2032
6.3 By Region – Global Quartz Tank for Semiconductor Sales & Forecasts
6.3.1 By Region – Global Quartz Tank for Semiconductor Sales, 2020-2025
6.3.2 By Region – Global Quartz Tank for Semiconductor Sales, 2026-2032
6.3.3 By Region – Global Quartz Tank for Semiconductor Sales Market Share, 2020-2032
6.4 North America
6.4.1 By Country – North America Quartz Tank for Semiconductor Revenue, 2020-2032
6.4.2 By Country – North America Quartz Tank for Semiconductor Sales, 2020-2032
6.4.3 United States Quartz Tank for Semiconductor Market Size, 2020-2032
6.4.4 Canada Quartz Tank for Semiconductor Market Size, 2020-2032
6.4.5 Mexico Quartz Tank for Semiconductor Market Size, 2020-2032
6.5 Europe
6.5.1 By Country – Europe Quartz Tank for Semiconductor Revenue, 2020-2032
6.5.2 By Country – Europe Quartz Tank for Semiconductor Sales, 2020-2032
6.5.3 Germany Quartz Tank for Semiconductor Market Size, 2020-2032
6.5.4 France Quartz Tank for Semiconductor Market Size, 2020-2032
6.5.5 U.K. Quartz Tank for Semiconductor Market Size, 2020-2032
6.5.6 Italy Quartz Tank for Semiconductor Market Size, 2020-2032
6.5.7 Russia Quartz Tank for Semiconductor Market Size, 2020-2032
6.5.8 Nordic Countries Quartz Tank for Semiconductor Market Size, 2020-2032
6.5.9 Benelux Quartz Tank for Semiconductor Market Size, 2020-2032
6.6 Asia
6.6.1 By Region – Asia Quartz Tank for Semiconductor Revenue, 2020-2032
6.6.2 By Region – Asia Quartz Tank for Semiconductor Sales, 2020-2032
6.6.3 China Quartz Tank for Semiconductor Market Size, 2020-2032
6.6.4 Japan Quartz Tank for Semiconductor Market Size, 2020-2032
6.6.5 South Korea Quartz Tank for Semiconductor Market Size, 2020-2032
6.6.6 Southeast Asia Quartz Tank for Semiconductor Market Size, 2020-2032
6.6.7 India Quartz Tank for Semiconductor Market Size, 2020-2032
6.7 South America
6.7.1 By Country – South America Quartz Tank for Semiconductor Revenue, 2020-2032
6.7.2 By Country – South America Quartz Tank for Semiconductor Sales, 2020-2032
6.7.3 Brazil Quartz Tank for Semiconductor Market Size, 2020-2032
6.7.4 Argentina Quartz Tank for Semiconductor Market Size, 2020-2032
6.8 Middle East & Africa
6.8.1 By Country – Middle East & Africa Quartz Tank for Semiconductor Revenue, 2020-2032
6.8.2 By Country – Middle East & Africa Quartz Tank for Semiconductor Sales, 2020-2032
6.8.3 Turkey Quartz Tank for Semiconductor Market Size, 2020-2032
6.8.4 Israel Quartz Tank for Semiconductor Market Size, 2020-2032
6.8.5 Saudi Arabia Quartz Tank for Semiconductor Market Size, 2020-2032
6.8.6 UAE Quartz Tank for Semiconductor Market Size, 2020-2032
7 Manufacturers & Brands Profiles
7.1 Tosoh Quartz Group
7.1.1 Tosoh Quartz Group Company Summary
7.1.2 Tosoh Quartz Group Business Overview
7.1.3 Tosoh Quartz Group Quartz Tank for Semiconductor Major Product Offerings
7.1.4 Tosoh Quartz Group Quartz Tank for Semiconductor Sales and Revenue in Global (2020-2025)
7.1.5 Tosoh Quartz Group Key News & Latest Developments
7.2 Ferrotec
7.2.1 Ferrotec Company Summary
7.2.2 Ferrotec Business Overview
7.2.3 Ferrotec Quartz Tank for Semiconductor Major Product Offerings
7.2.4 Ferrotec Quartz Tank for Semiconductor Sales and Revenue in Global (2020-2025)
7.2.5 Ferrotec Key News & Latest Developments
7.3 Wacom Quartz
7.3.1 Wacom Quartz Company Summary
7.3.2 Wacom Quartz Business Overview
7.3.3 Wacom Quartz Quartz Tank for Semiconductor Major Product Offerings
7.3.4 Wacom Quartz Quartz Tank for Semiconductor Sales and Revenue in Global (2020-2025)
7.3.5 Wacom Quartz Key News & Latest Developments
7.4 Daico Mfg
7.4.1 Daico Mfg Company Summary
7.4.2 Daico Mfg Business Overview
7.4.3 Daico Mfg Quartz Tank for Semiconductor Major Product Offerings
7.4.4 Daico Mfg Quartz Tank for Semiconductor Sales and Revenue in Global (2020-2025)
7.4.5 Daico Mfg Key News & Latest Developments
7.5 Pyromatics
7.5.1 Pyromatics Company Summary
7.5.2 Pyromatics Business Overview
7.5.3 Pyromatics Quartz Tank for Semiconductor Major Product Offerings
7.5.4 Pyromatics Quartz Tank for Semiconductor Sales and Revenue in Global (2020-2025)
7.5.5 Pyromatics Key News & Latest Developments
7.6 TOCHANCE TECHNOLOGY
7.6.1 TOCHANCE TECHNOLOGY Company Summary
7.6.2 TOCHANCE TECHNOLOGY Business Overview
7.6.3 TOCHANCE TECHNOLOGY Quartz Tank for Semiconductor Major Product Offerings
7.6.4 TOCHANCE TECHNOLOGY Quartz Tank for Semiconductor Sales and Revenue in Global (2020-2025)
7.6.5 TOCHANCE TECHNOLOGY Key News & Latest Developments
7.7 SCREEN SPE Quartz
7.7.1 SCREEN SPE Quartz Company Summary
7.7.2 SCREEN SPE Quartz Business Overview
7.7.3 SCREEN SPE Quartz Quartz Tank for Semiconductor Major Product Offerings
7.7.4 SCREEN SPE Quartz Quartz Tank for Semiconductor Sales and Revenue in Global (2020-2025)
7.7.5 SCREEN SPE Quartz Key News & Latest Developments
7.8 Jiangsu Hongwei Quartz Technology
7.8.1 Jiangsu Hongwei Quartz Technology Company Summary
7.8.2 Jiangsu Hongwei Quartz Technology Business Overview
7.8.3 Jiangsu Hongwei Quartz Technology Quartz Tank for Semiconductor Major Product Offerings
7.8.4 Jiangsu Hongwei Quartz Technology Quartz Tank for Semiconductor Sales and Revenue in Global (2020-2025)
7.8.5 Jiangsu Hongwei Quartz Technology Key News & Latest Developments
7.9 Huzhou Dongke Electron Quartz
7.9.1 Huzhou Dongke Electron Quartz Company Summary
7.9.2 Huzhou Dongke Electron Quartz Business Overview
7.9.3 Huzhou Dongke Electron Quartz Quartz Tank for Semiconductor Major Product Offerings
7.9.4 Huzhou Dongke Electron Quartz Quartz Tank for Semiconductor Sales and Revenue in Global (2020-2025)
7.9.5 Huzhou Dongke Electron Quartz Key News & Latest Developments
7.10 Cheng-Hwa Technology
7.10.1 Cheng-Hwa Technology Company Summary
7.10.2 Cheng-Hwa Technology Business Overview
7.10.3 Cheng-Hwa Technology Quartz Tank for Semiconductor Major Product Offerings
7.10.4 Cheng-Hwa Technology Quartz Tank for Semiconductor Sales and Revenue in Global (2020-2025)
7.10.5 Cheng-Hwa Technology Key News & Latest Developments
7.11 Shanghai Wechance Industrial
7.11.1 Shanghai Wechance Industrial Company Summary
7.11.2 Shanghai Wechance Industrial Business Overview
7.11.3 Shanghai Wechance Industrial Quartz Tank for Semiconductor Major Product Offerings
7.11.4 Shanghai Wechance Industrial Quartz Tank for Semiconductor Sales and Revenue in Global (2020-2025)
7.11.5 Shanghai Wechance Industrial Key News & Latest Developments
7.12 Lianyungang Hong Kang quartz Products
7.12.1 Lianyungang Hong Kang quartz Products Company Summary
7.12.2 Lianyungang Hong Kang quartz Products Business Overview
7.12.3 Lianyungang Hong Kang quartz Products Quartz Tank for Semiconductor Major Product Offerings
7.12.4 Lianyungang Hong Kang quartz Products Quartz Tank for Semiconductor Sales and Revenue in Global (2020-2025)
7.12.5 Lianyungang Hong Kang quartz Products Key News & Latest Developments
8 Global Quartz Tank for Semiconductor Production Capacity, Analysis
8.1 Global Quartz Tank for Semiconductor Production Capacity, 2020-2032
8.2 Quartz Tank for Semiconductor Production Capacity of Key Manufacturers in Global Market
8.3 Global Quartz Tank for Semiconductor Production by Region
9 Key Market Trends, Opportunity, Drivers and Restraints
9.1 Market Opportunities & Trends
9.2 Market Drivers
9.3 Market Restraints
10 Quartz Tank for Semiconductor Supply Chain Analysis
10.1 Quartz Tank for Semiconductor Industry Value Chain
10.2 Quartz Tank for Semiconductor Upstream Market
10.3 Quartz Tank for Semiconductor Downstream and Clients
10.4 Marketing Channels Analysis
10.4.1 Marketing Channels
10.4.2 Quartz Tank for Semiconductor Distributors and Sales Agents in Global
11 Conclusion
12 Appendix
12.1 Note
12.2 Examples of Clients
12.3 DisclaimerList of Tables
Table 1. Key Players of Quartz Tank for Semiconductor in Global Market
Table 2. Top Quartz Tank for Semiconductor Players in Global Market, Ranking by Revenue (2024)
Table 3. Global Quartz Tank for Semiconductor Revenue by Companies, (US$, Mn), 2020-2025
Table 4. Global Quartz Tank for Semiconductor Revenue Share by Companies, 2020-2025
Table 5. Global Quartz Tank for Semiconductor Sales by Companies, (K Units), 2020-2025
Table 6. Global Quartz Tank for Semiconductor Sales Share by Companies, 2020-2025
Table 7. Key Manufacturers Quartz Tank for Semiconductor Price (2020-2025) & (US$/Unit)
Table 8. Global Manufacturers Quartz Tank for Semiconductor Product Type
Table 9. List of Global Tier 1 Quartz Tank for Semiconductor Companies, Revenue (US$, Mn) in 2024 and Market Share
Table 10. List of Global Tier 2 and Tier 3 Quartz Tank for Semiconductor Companies, Revenue (US$, Mn) in 2024 and Market Share
Table 11. Segment by Type – Global Quartz Tank for Semiconductor Revenue, (US$, Mn), 2024 & 2032
Table 12. Segment by Type – Global Quartz Tank for Semiconductor Revenue (US$, Mn), 2020-2025
Table 13. Segment by Type – Global Quartz Tank for Semiconductor Revenue (US$, Mn), 2026-2032
Table 14. Segment by Type – Global Quartz Tank for Semiconductor Sales (K Units), 2020-2025
Table 15. Segment by Type – Global Quartz Tank for Semiconductor Sales (K Units), 2026-2032
Table 16. Segment by Application – Global Quartz Tank for Semiconductor Revenue, (US$, Mn), 2024 & 2032
Table 17. Segment by Application – Global Quartz Tank for Semiconductor Revenue, (US$, Mn), 2020-2025
Table 18. Segment by Application – Global Quartz Tank for Semiconductor Revenue, (US$, Mn), 2026-2032
Table 19. Segment by Application – Global Quartz Tank for Semiconductor Sales, (K Units), 2020-2025
Table 20. Segment by Application – Global Quartz Tank for Semiconductor Sales, (K Units), 2026-2032
Table 21. By Region – Global Quartz Tank for Semiconductor Revenue, (US$, Mn), 2025-2032
Table 22. By Region – Global Quartz Tank for Semiconductor Revenue, (US$, Mn), 2020-2025
Table 23. By Region – Global Quartz Tank for Semiconductor Revenue, (US$, Mn), 2026-2032
Table 24. By Region – Global Quartz Tank for Semiconductor Sales, (K Units), 2020-2025
Table 25. By Region – Global Quartz Tank for Semiconductor Sales, (K Units), 2026-2032
Table 26. By Country – North America Quartz Tank for Semiconductor Revenue, (US$, Mn), 2020-2025
Table 27. By Country – North America Quartz Tank for Semiconductor Revenue, (US$, Mn), 2026-2032
Table 28. By Country – North America Quartz Tank for Semiconductor Sales, (K Units), 2020-2025
Table 29. By Country – North America Quartz Tank for Semiconductor Sales, (K Units), 2026-2032
Table 30. By Country – Europe Quartz Tank for Semiconductor Revenue, (US$, Mn), 2020-2025
Table 31. By Country – Europe Quartz Tank for Semiconductor Revenue, (US$, Mn), 2026-2032
Table 32. By Country – Europe Quartz Tank for Semiconductor Sales, (K Units), 2020-2025
Table 33. By Country – Europe Quartz Tank for Semiconductor Sales, (K Units), 2026-2032
Table 34. By Region – Asia Quartz Tank for Semiconductor Revenue, (US$, Mn), 2020-2025
Table 35. By Region – Asia Quartz Tank for Semiconductor Revenue, (US$, Mn), 2026-2032
Table 36. By Region – Asia Quartz Tank for Semiconductor Sales, (K Units), 2020-2025
Table 37. By Region – Asia Quartz Tank for Semiconductor Sales, (K Units), 2026-2032
Table 38. By Country – South America Quartz Tank for Semiconductor Revenue, (US$, Mn), 2020-2025
Table 39. By Country – South America Quartz Tank for Semiconductor Revenue, (US$, Mn), 2026-2032
Table 40. By Country – South America Quartz Tank for Semiconductor Sales, (K Units), 2020-2025
Table 41. By Country – South America Quartz Tank for Semiconductor Sales, (K Units), 2026-2032
Table 42. By Country – Middle East & Africa Quartz Tank for Semiconductor Revenue, (US$, Mn), 2020-2025
Table 43. By Country – Middle East & Africa Quartz Tank for Semiconductor Revenue, (US$, Mn), 2026-2032
Table 44. By Country – Middle East & Africa Quartz Tank for Semiconductor Sales, (K Units), 2020-2025
Table 45. By Country – Middle East & Africa Quartz Tank for Semiconductor Sales, (K Units), 2026-2032
Table 46. Tosoh Quartz Group Company Summary
Table 47. Tosoh Quartz Group Quartz Tank for Semiconductor Product Offerings
Table 48. Tosoh Quartz Group Quartz Tank for Semiconductor Sales (K Units), Revenue (US$, Mn) and Average Price (US$/Unit) & (2020-2025)
Table 49. Tosoh Quartz Group Key News & Latest Developments
Table 50. Ferrotec Company Summary
Table 51. Ferrotec Quartz Tank for Semiconductor Product Offerings
Table 52. Ferrotec Quartz Tank for Semiconductor Sales (K Units), Revenue (US$, Mn) and Average Price (US$/Unit) & (2020-2025)
Table 53. Ferrotec Key News & Latest Developments
Table 54. Wacom Quartz Company Summary
Table 55. Wacom Quartz Quartz Tank for Semiconductor Product Offerings
Table 56. Wacom Quartz Quartz Tank for Semiconductor Sales (K Units), Revenue (US$, Mn) and Average Price (US$/Unit) & (2020-2025)
Table 57. Wacom Quartz Key News & Latest Developments
Table 58. Daico Mfg Company Summary
Table 59. Daico Mfg Quartz Tank for Semiconductor Product Offerings
Table 60. Daico Mfg Quartz Tank for Semiconductor Sales (K Units), Revenue (US$, Mn) and Average Price (US$/Unit) & (2020-2025)
Table 61. Daico Mfg Key News & Latest Developments
Table 62. Pyromatics Company Summary
Table 63. Pyromatics Quartz Tank for Semiconductor Product Offerings
Table 64. Pyromatics Quartz Tank for Semiconductor Sales (K Units), Revenue (US$, Mn) and Average Price (US$/Unit) & (2020-2025)
Table 65. Pyromatics Key News & Latest Developments
Table 66. TOCHANCE TECHNOLOGY Company Summary
Table 67. TOCHANCE TECHNOLOGY Quartz Tank for Semiconductor Product Offerings
Table 68. TOCHANCE TECHNOLOGY Quartz Tank for Semiconductor Sales (K Units), Revenue (US$, Mn) and Average Price (US$/Unit) & (2020-2025)
Table 69. TOCHANCE TECHNOLOGY Key News & Latest Developments
Table 70. SCREEN SPE Quartz Company Summary
Table 71. SCREEN SPE Quartz Quartz Tank for Semiconductor Product Offerings
Table 72. SCREEN SPE Quartz Quartz Tank for Semiconductor Sales (K Units), Revenue (US$, Mn) and Average Price (US$/Unit) & (2020-2025)
Table 73. SCREEN SPE Quartz Key News & Latest Developments
Table 74. Jiangsu Hongwei Quartz Technology Company Summary
Table 75. Jiangsu Hongwei Quartz Technology Quartz Tank for Semiconductor Product Offerings
Table 76. Jiangsu Hongwei Quartz Technology Quartz Tank for Semiconductor Sales (K Units), Revenue (US$, Mn) and Average Price (US$/Unit) & (2020-2025)
Table 77. Jiangsu Hongwei Quartz Technology Key News & Latest Developments
Table 78. Huzhou Dongke Electron Quartz Company Summary
Table 79. Huzhou Dongke Electron Quartz Quartz Tank for Semiconductor Product Offerings
Table 80. Huzhou Dongke Electron Quartz Quartz Tank for Semiconductor Sales (K Units), Revenue (US$, Mn) and Average Price (US$/Unit) & (2020-2025)
Table 81. Huzhou Dongke Electron Quartz Key News & Latest Developments
Table 82. Cheng-Hwa Technology Company Summary
Table 83. Cheng-Hwa Technology Quartz Tank for Semiconductor Product Offerings
Table 84. Cheng-Hwa Technology Quartz Tank for Semiconductor Sales (K Units), Revenue (US$, Mn) and Average Price (US$/Unit) & (2020-2025)
Table 85. Cheng-Hwa Technology Key News & Latest Developments
Table 86. Shanghai Wechance Industrial Company Summary
Table 87. Shanghai Wechance Industrial Quartz Tank for Semiconductor Product Offerings
Table 88. Shanghai Wechance Industrial Quartz Tank for Semiconductor Sales (K Units), Revenue (US$, Mn) and Average Price (US$/Unit) & (2020-2025)
Table 89. Shanghai Wechance Industrial Key News & Latest Developments
Table 90. Lianyungang Hong Kang quartz Products Company Summary
Table 91. Lianyungang Hong Kang quartz Products Quartz Tank for Semiconductor Product Offerings
Table 92. Lianyungang Hong Kang quartz Products Quartz Tank for Semiconductor Sales (K Units), Revenue (US$, Mn) and Average Price (US$/Unit) & (2020-2025)
Table 93. Lianyungang Hong Kang quartz Products Key News & Latest Developments
Table 94. Quartz Tank for Semiconductor Capacity of Key Manufacturers in Global Market, 2023-2025 (K Units)
Table 95. Global Quartz Tank for Semiconductor Capacity Market Share of Key Manufacturers, 2023-2025
Table 96. Global Quartz Tank for Semiconductor Production by Region, 2020-2025 (K Units)
Table 97. Global Quartz Tank for Semiconductor Production by Region, 2026-2032 (K Units)
Table 98. Quartz Tank for Semiconductor Market Opportunities & Trends in Global Market
Table 99. Quartz Tank for Semiconductor Market Drivers in Global Market
Table 100. Quartz Tank for Semiconductor Market Restraints in Global Market
Table 101. Quartz Tank for Semiconductor Raw Materials
Table 102. Quartz Tank for Semiconductor Raw Materials Suppliers in Global Market
Table 103. Typical Quartz Tank for Semiconductor Downstream
Table 104. Quartz Tank for Semiconductor Downstream Clients in Global Market
Table 105. Quartz Tank for Semiconductor Distributors and Sales Agents in Global Market

List of Figures
Figure 1. Quartz Tank for Semiconductor Product Picture
Figure 2. Quartz Tank for Semiconductor Segment by Type in 2024
Figure 3. Quartz Tank for Semiconductor Segment by Application in 2024
Figure 4. Global Quartz Tank for Semiconductor Market Overview: 2024
Figure 5. Key Caveats
Figure 6. Global Quartz Tank for Semiconductor Market Size: 2024 VS 2032 (US$, Mn)
Figure 7. Global Quartz Tank for Semiconductor Revenue: 2020-2032 (US$, Mn)
Figure 8. Quartz Tank for Semiconductor Sales in Global Market: 2020-2032 (K Units)
Figure 9. The Top 3 and 5 Players Market Share by Quartz Tank for Semiconductor Revenue in 2024
Figure 10. Segment by Type – Global Quartz Tank for Semiconductor Revenue, (US$, Mn), 2024 & 2032
Figure 11. Segment by Type – Global Quartz Tank for Semiconductor Revenue Market Share, 2020-2032
Figure 12. Segment by Type – Global Quartz Tank for Semiconductor Sales Market Share, 2020-2032
Figure 13. Segment by Type – Global Quartz Tank for Semiconductor Price (US$/Unit), 2020-2032
Figure 14. Segment by Application – Global Quartz Tank for Semiconductor Revenue, (US$, Mn), 2024 & 2032
Figure 15. Segment by Application – Global Quartz Tank for Semiconductor Revenue Market Share, 2020-2032
Figure 16. Segment by Application – Global Quartz Tank for Semiconductor Sales Market Share, 2020-2032
Figure 17. Segment by Application -Global Quartz Tank for Semiconductor Price (US$/Unit), 2020-2032
Figure 18. By Region – Global Quartz Tank for Semiconductor Revenue, (US$, Mn), 2025 & 2032
Figure 19. By Region – Global Quartz Tank for Semiconductor Revenue Market Share, 2020 VS 2024 VS 2032
Figure 20. By Region – Global Quartz Tank for Semiconductor Revenue Market Share, 2020-2032
Figure 21. By Region – Global Quartz Tank for Semiconductor Sales Market Share, 2020-2032
Figure 22. By Country – North America Quartz Tank for Semiconductor Revenue Market Share, 2020-2032
Figure 23. By Country – North America Quartz Tank for Semiconductor Sales Market Share, 2020-2032
Figure 24. United States Quartz Tank for Semiconductor Revenue, (US$, Mn), 2020-2032
Figure 25. Canada Quartz Tank for Semiconductor Revenue, (US$, Mn), 2020-2032
Figure 26. Mexico Quartz Tank for Semiconductor Revenue, (US$, Mn), 2020-2032
Figure 27. By Country – Europe Quartz Tank for Semiconductor Revenue Market Share, 2020-2032
Figure 28. By Country – Europe Quartz Tank for Semiconductor Sales Market Share, 2020-2032
Figure 29. Germany Quartz Tank for Semiconductor Revenue, (US$, Mn), 2020-2032
Figure 30. France Quartz Tank for Semiconductor Revenue, (US$, Mn), 2020-2032
Figure 31. U.K. Quartz Tank for Semiconductor Revenue, (US$, Mn), 2020-2032
Figure 32. Italy Quartz Tank for Semiconductor Revenue, (US$, Mn), 2020-2032
Figure 33. Russia Quartz Tank for Semiconductor Revenue, (US$, Mn), 2020-2032
Figure 34. Nordic Countries Quartz Tank for Semiconductor Revenue, (US$, Mn), 2020-2032
Figure 35. Benelux Quartz Tank for Semiconductor Revenue, (US$, Mn), 2020-2032
Figure 36. By Region – Asia Quartz Tank for Semiconductor Revenue Market Share, 2020-2032
Figure 37. By Region – Asia Quartz Tank for Semiconductor Sales Market Share, 2020-2032
Figure 38. China Quartz Tank for Semiconductor Revenue, (US$, Mn), 2020-2032
Figure 39. Japan Quartz Tank for Semiconductor Revenue, (US$, Mn), 2020-2032
Figure 40. South Korea Quartz Tank for Semiconductor Revenue, (US$, Mn), 2020-2032
Figure 41. Southeast Asia Quartz Tank for Semiconductor Revenue, (US$, Mn), 2020-2032
Figure 42. India Quartz Tank for Semiconductor Revenue, (US$, Mn), 2020-2032
Figure 43. By Country – South America Quartz Tank for Semiconductor Revenue Market Share, 2020-2032
Figure 44. By Country – South America Quartz Tank for Semiconductor Sales, Market Share, 2020-2032
Figure 45. Brazil Quartz Tank for Semiconductor Revenue, (US$, Mn), 2020-2032
Figure 46. Argentina Quartz Tank for Semiconductor Revenue, (US$, Mn), 2020-2032
Figure 47. By Country – Middle East & Africa Quartz Tank for Semiconductor Revenue, Market Share, 2020-2032
Figure 48. By Country – Middle East & Africa Quartz Tank for Semiconductor Sales, Market Share, 2020-2032
Figure 49. Turkey Quartz Tank for Semiconductor Revenue, (US$, Mn), 2020-2032
Figure 50. Israel Quartz Tank for Semiconductor Revenue, (US$, Mn), 2020-2032
Figure 51. Saudi Arabia Quartz Tank for Semiconductor Revenue, (US$, Mn), 2020-2032
Figure 52. UAE Quartz Tank for Semiconductor Revenue, (US$, Mn), 2020-2032
Figure 53. Global Quartz Tank for Semiconductor Production Capacity (K Units), 2020-2032
Figure 54. The Percentage of Production Quartz Tank for Semiconductor by Region, 2024 VS 2032
Figure 55. Quartz Tank for Semiconductor Industry Value Chain
Figure 56. Marketing Channels