Key Statistics
Key Takeaways
- Quartz tubes are the largest source-defined type, with the source page assigning them a 38% share in 2024; broad furnace use makes them the volume anchor of semiconductor quartz demand.
- Quartz crucibles and ultra-high-purity synthetic grades gain strategic importance as 300 mm crystal growth and leading-edge processing tighten impurity, thermal-stability and lifecycle requirements.
- Oxidation processes are the largest application in the source segmentation, while deposition, etch, cleaning and compound-semiconductor uses broaden demand inside the source-defined Others category.
- Asia Pacific is the largest and fastest-growing region because it concentrates fabs, memory production, silicon crystal growth and a growing local materials supply base.
- High-purity feedstock concentration, energy-intensive fusion and long qualification cycles are the main structural restraints, favoring suppliers with stable purification and machining capability.
Quartz Materials for Semiconductor Market Overview
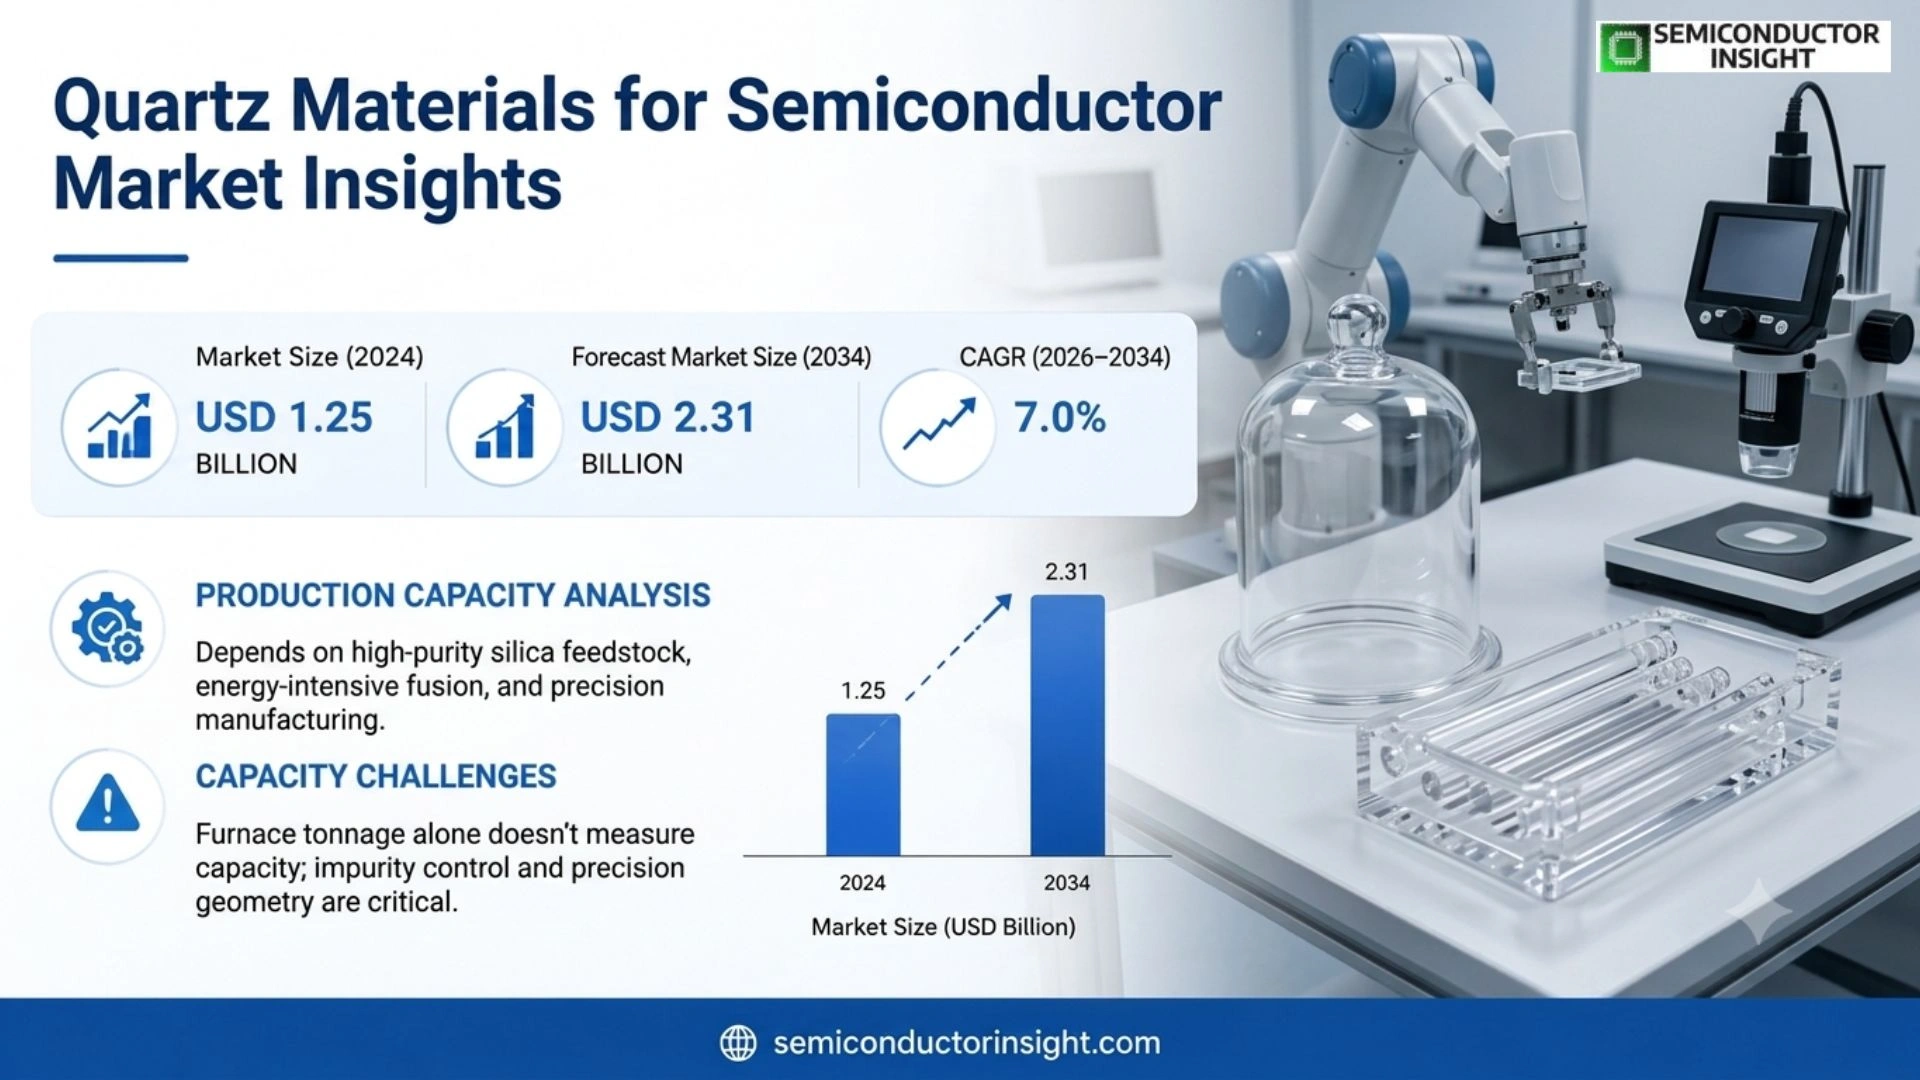
Quartz Materials For Semiconductor Market was valued at USD 1.26 billion in 2025 and is projected to reach USD 2.31 billion by 2034, representing a 7.0% CAGR during 2026–2034. The 2026 estimated market size is USD 1.35 billion. Asia Pacific is the largest and fastest-growing market in 2025 because it concentrates wafer fabrication, memory production, silicon crystal growth and a growing local high-purity quartz supply base.
Semiconductor-grade quartz is high-purity silica used as tubes, crucibles, flanges and custom process components wherever wafers or silicon feedstock encounter high temperatures, aggressive chemistries or strict contamination limits. Low thermal expansion, heat resistance and chemical stability allow process equipment to operate repeatedly without adding unacceptable metallic or particulate contamination to the wafer environment.
Quartz carries economic value far beyond its share of total fab equipment cost. A furnace tube, boat or crucible can influence contamination, uniformity, maintenance intervals and yield across large wafer lots, so fabs qualify material formulations, cleaning methods and geometry carefully. Successful suppliers therefore sell process stability, documentation and continuity rather than undifferentiated glassware.
Demand expands with the installed base of 300 mm fabs and with process complexity. SEMI’s April 2026 outlook placed global 300 mm fab equipment spending at USD 133 billion for 2026 and USD 151 billion for 2027, while memory investment is accelerated by HBM and advanced DRAM. Each new thermal-processing module creates an initial quartz bill of materials followed by replacement cycles.
Segment Analysis: By Type
The source page defines Quartz Tube, Quartz Crucible, Quartz Flange and Others. Quartz Tube is the largest category, supported by broad oxidation and diffusion-furnace use. Crucibles are strategically important to large-diameter silicon crystal growth, while flanges and custom parts capture value where equipment geometries, seals and process conditions require supplier-specific machining and qualification.
| Type | Technical / purchasing role | Market position |
|---|---|---|
| Quartz Tube | High-purity tubes form controlled process chambers or liners in oxidation, diffusion and related thermal operations. They withstand repeated heating, cleaning chemistries and handling without unacceptable deformation or contamination, making dimensional repeatability and impurity control central purchasing criteria. This matters commercially because process qualification, integration effort, supply continuity, engineering support and total manufacturing risk often influence purchasing decisions as strongly as component price, so suppliers that solve deployment constraints can defend approved positions even when technically similar alternatives are available. | Largest type. The source page assigns quartz tubes a 38% share in 2024. Their position is supported by the installed furnace base and recurring replacement demand, while leading-edge fabs increasingly specify synthetic or tightly controlled high-purity grades that raise value per component. This matters commercially because process qualification, integration effort, supply continuity, engineering support and total manufacturing risk often influence purchasing decisions as strongly as component price, so suppliers that solve deployment constraints can defend approved positions even when technically similar alternatives are available. |
| Quartz Crucible | Crucibles hold molten silicon during crystal pulling and must combine high-purity silica with controlled thermal behavior and mechanical integrity. Large 300 mm silicon ingots increase the consequence of defects, so crucible consistency affects crystal quality and the economics of long crystal-growth campaigns. This matters commercially because process qualification, integration effort, supply continuity, engineering support and total manufacturing risk often influence purchasing decisions as strongly as component price, so suppliers that solve deployment constraints can defend approved positions even when technically similar alternatives are available. | The source page places crucibles at 29% of the market in 2024. Growth is linked to 300 mm wafer demand, memory and logic capacity expansion and the need for higher-purity silicon inputs. Qualification is demanding because contamination can propagate into many downstream wafers. This matters commercially because process qualification, integration effort, supply continuity, engineering support and total manufacturing risk often influence purchasing decisions as strongly as component price, so suppliers that solve deployment constraints can defend approved positions even when technically similar alternatives are available. |
| Quartz Flange | Flanges, rings and sealing interfaces connect quartz process chambers to gas delivery, vacuum and mechanical assemblies. Their value comes from precision machining, flatness, joint quality and compatibility with a specific tool platform rather than raw silica content alone. This matters commercially because process qualification, integration effort, supply continuity, engineering support and total manufacturing risk often influence purchasing decisions as strongly as component price, so suppliers that solve deployment constraints can defend approved positions even when technically similar alternatives are available. | The source page assigns quartz flanges a 21% share in 2024. This segment benefits from replacement and equipment-specific customization, with suppliers competing on machining accuracy, clean finishing, documentation and the ability to reproduce qualified geometries across multiple fab sites. This matters commercially because process qualification, integration effort, supply continuity, engineering support and total manufacturing risk often influence purchasing decisions as strongly as component price, so suppliers that solve deployment constraints can defend approved positions even when technically similar alternatives are available. |
| Others | The source-defined Others category includes boats, liners, pedestals, windows and custom components used across specialized deposition, etch, cleaning and compound-semiconductor processes. These parts vary by tool architecture and often require close engineering collaboration between material supplier, equipment maker and fab. This matters commercially because process qualification, integration effort, supply continuity, engineering support and total manufacturing risk often influence purchasing decisions as strongly as component price, so suppliers that solve deployment constraints can defend approved positions even when technically similar alternatives are available. | Smaller in aggregate than tubes, crucibles or flanges, this category can grow faster in value as advanced tools use more specialized high-purity geometries. The opportunity is based on custom process compatibility, OEM collaboration and premium pricing for difficult shapes rather than standardized volume. This matters commercially because process qualification, integration effort, supply continuity, engineering support and total manufacturing risk often influence purchasing decisions as strongly as component price, so suppliers that solve deployment constraints can defend approved positions even when technically similar alternatives are available. |
Purity and process-compatibility requirements
Purity is the key economic differentiator across semiconductor quartz. Leading-edge customers control metallic impurities, hydroxyl content, bubbles, inclusions, surface finish and cleaning history because each can influence particles, thermal behavior or contamination. Synthetic fused silica can command a premium where natural-feedstock variation is unacceptable, while established natural-quartz grades remain competitive in mature processes with stable qualification baselines.
Segment Analysis: By Application
The source page defines Oxidation Process, Diffusion Process and Others. Oxidation is the leading application because furnace tubes and related quartz parts are fundamental to controlled high-temperature wafer treatment. Diffusion remains a large recurring use, while Others expands with deposition, etch, cleaning, compound-semiconductor and specialty process steps that require custom high-purity quartz components.
| Application | Demand characteristics |
|---|---|
| Oxidation Process | Largest application. Thermal oxidation exposes silicon wafers to controlled oxygen- or steam-containing environments at elevated temperature, placing quartz directly around the wafer load. Purchasing is driven by contamination control, dimensional stability, furnace lifetime and repeatable cleaning performance because processware failure can affect uniformity and yield across an entire batch. This matters commercially because process qualification, integration effort, supply continuity, engineering support and total manufacturing risk often influence purchasing decisions as strongly as component price, so suppliers that solve deployment constraints can defend approved positions even when technically similar alternatives are available. |
| Diffusion Process | Diffusion furnaces use high-temperature gas chemistry to introduce dopants or perform related thermal treatments. Quartz tubes, boats and fittings must remain chemically compatible and dimensionally stable over repeated cycles. Demand follows the installed base of batch furnaces, making replacement intervals, cleanability and matching legacy geometries important commercial factors. This matters commercially because process qualification, integration effort, supply continuity, engineering support and total manufacturing risk often influence purchasing decisions as strongly as component price, so suppliers that solve deployment constraints can defend approved positions even when technically similar alternatives are available. |
| Others | The source-defined Others application includes deposition, etching, cleaning, research and compound-semiconductor processing. Growth is supported by equipment diversification and SiC and GaN manufacturing, where temperature and chemical environments can differ from mainstream silicon. Suppliers compete through material formulation, custom machining and rapid qualification with tool builders and specialty fabs. This matters commercially because process qualification, integration effort, supply continuity, engineering support and total manufacturing risk often influence purchasing decisions as strongly as component price, so suppliers that solve deployment constraints can defend approved positions even when technically similar alternatives are available. |
Regional Analysis
Asia Pacific leads because semiconductor quartz is consumed close to wafer fabrication, silicon crystal growth and equipment installation. North America is expanding with localized advanced fabs, Europe emphasizes precision materials and equipment collaboration, while South America and Middle East & Africa remain smaller project markets dependent on imported high-purity components. This matters commercially because process qualification, integration effort, supply continuity, engineering support and total manufacturing risk often influence purchasing decisions as strongly as component price, so suppliers that solve deployment constraints can defend approved positions even when technically similar alternatives are available.
How does regional demand differ across the quartz materials for semiconductor market?
Regional demand follows the location and type of semiconductor manufacturing rather than population or general electronics consumption. Asia Pacific combines high-volume wafer starts with a large local material ecosystem; North America values resilient supply for new advanced fabs; Europe rewards high-purity co-engineering and documentation. Emerging regions buy smaller custom volumes through distributors and research channels, creating a different service model.
| Region | Position | Growth outlook | Demand profile | What decides supplier selection |
|---|---|---|---|---|
| Asia Pacific | Largest | Highest in market | Fab, memory and crystal-growth led | Purity, local availability and qualification history |
| North America | Major established market | Strong | Advanced fab and localization led | Qualification, documentation and supply resilience |
| Europe | Major established market | Steady | Precision materials and specialty-fab led | Traceability and co-engineering |
| South America | Emerging | Selective | Import and research led | Distributor reach and landed cost |
| Middle East & Africa | Emerging | Selective | Research and diversification led | Project support and import reliability |
Competitive Landscape
Competition is concentrated among high-purity quartz specialists because semiconductor qualification creates a substantial barrier to entry. Customers evaluate impurity control, synthetic versus natural material capability, machining precision, cleaning protocols, local technical service and the ability to reproduce a qualified component across multiple plants. The strongest moat is stable process history accepted by major fabs and equipment makers.
Momentive, Heraeus, Qsil and Tosoh compete on material science and established semiconductor qualifications, while Chinese suppliers such as Feilihua and Jiangsu Pacific Quartz benefit from proximity to expanding domestic fabs. Global incumbents are localizing production in Asia while regional suppliers upgrade purity, documentation and international customer support to move into higher-value applications.
Heraeus Covantics’ Shenyang investment shows how capacity location is becoming a competitive variable. Producing high-purity synthetic quartz close to Chinese semiconductor customers can shorten logistics, accelerate troubleshooting and strengthen local supply resilience. The commercial return is not simply lower freight; it is the ability to support qualification, replenishment and custom engineering on the same cadence as rapidly expanding fabs.
Customer switching is slow because fabs validate quartz components against particles, contamination, thermal cycling, cleaning behavior and dimensional tolerances before production use. A lower-priced alternative that requires requalification can cost more than it saves, so incumbents with consistent manufacturing and disciplined change control retain meaningful pricing power in critical applications. This matters commercially because process qualification, integration effort, supply continuity, engineering support and total manufacturing risk often influence purchasing decisions as strongly as component price, so suppliers that solve deployment constraints can defend approved positions even when technically similar alternatives are available.
Tier structure
| Competitive tier | Representative participants | How suppliers compete |
|---|---|---|
| Global high-purity leaders | Momentive; Heraeus; Tosoh | Compete through proprietary material, global fab qualifications, custom machining and multi-region service. Their advantage is strongest in leading-edge and mission-critical processes where contamination risk and continuity of supply outweigh modest differences in component price. This matters commercially because process qualification, integration effort, supply continuity, engineering support and total manufacturing risk often influence purchasing decisions as strongly as component price, so suppliers that solve deployment constraints can defend approved positions even when technically similar alternatives are available. |
| Precision quartz specialists | Qsil; Feilihua Quartz Glass | Compete through specialty geometries, fused-quartz expertise and focused semiconductor applications. They can win by matching equipment-specific requirements quickly and by developing high-purity grades for compound-semiconductor or advanced thermal processes where standard catalog parts are insufficient. This matters commercially because process qualification, integration effort, supply continuity, engineering support and total manufacturing risk often influence purchasing decisions as strongly as component price, so suppliers that solve deployment constraints can defend approved positions even when technically similar alternatives are available. |
| Regional scale challengers | Jiangsu Pacific Quartz and other qualified Asian suppliers | Benefit from proximity to the world’s largest semiconductor manufacturing base. Moving into higher-value accounts requires tighter purification, traceability, change control and international qualification support, making process discipline the bridge from regional volume to global tier-one supply. This matters commercially because process qualification, integration effort, supply continuity, engineering support and total manufacturing risk often influence purchasing decisions as strongly as component price, so suppliers that solve deployment constraints can defend approved positions even when technically similar alternatives are available. |
Key companies profiled
The source report profiles Momentive; Heraeus; Qsil; Tosoh; Feilihua Quartz Glass; Jiangsu Pacific Quartz Co., Ltd.. The group spans global high-purity material leaders and regional suppliers serving fabs and equipment companies. Competitive position should be assessed by material purity, synthetic-quartz capability, machining range, production footprint, qualification history and local application support rather than total corporate revenue, which includes businesses outside semiconductor quartz.
Quartz Materials for Semiconductor Production Capacity Analysis
Production capacity depends on access to high-purity silica feedstock, energy-intensive fusion or synthetic-silica processes, controlled forming and annealing, precision machining, clean finishing and semiconductor-grade inspection. Capacity cannot be judged only by furnace tonnage because a supplier may have glass volume but lack the impurity control, geometry or qualification required for leading-edge fabs.
The most strategic capacity is high-purity synthetic and tightly controlled natural-quartz capacity capable of supporting advanced semiconductor customers. Heraeus Covantics’ 2025 Shenyang plant illustrates localization near Asian fabs. Proximity reduces logistics risk and speeds engineering response, but suppliers still need stable raw-material and process controls because local output without reproducible purity is not semiconductor-qualified supply.
Energy is a production constraint because quartz fusion and thermal processing run at very high temperatures. Energy price volatility affects conversion cost and can influence where capacity is built. However, semiconductor customers do not accept uncontrolled recipe or equipment changes made only to reduce cost, so producers must balance efficiency programs with formal change control and possible requalification.
Precision machining and clean finishing can become bottlenecks even when fused-quartz capacity is adequate. Advanced tool parts require tight dimensions, polished or fire-finished surfaces, clean packaging and traceability. As equipment platforms become more specialized, machining complex geometries at semiconductor cleanliness levels can become a higher-value constraint than bulk glass availability. This matters commercially because process qualification, integration effort, supply continuity, engineering support and total manufacturing risk often influence purchasing decisions as strongly as component price, so suppliers that solve deployment constraints can defend approved positions even when technically similar alternatives are available.
Quartz Materials for Semiconductor Market Dynamics: Drivers, Restraints and Opportunities
Growth is driven by expansion of 300 mm capacity, rising process complexity and tighter contamination limits, while restraints include concentrated high-purity inputs, energy-intensive production and long qualification. Opportunities shift toward synthetic quartz, complex geometries, compound-semiconductor processware and regional capacity positioned close to new fabs. This matters commercially because process qualification, integration effort, supply continuity, engineering support and total manufacturing risk often influence purchasing decisions as strongly as component price, so suppliers that solve deployment constraints can defend approved positions even when technically similar alternatives are available.
MARKET DRIVERS
Drivers Impact Analysis*
| Factor | Relative impact* | Commercial mechanism |
|---|---|---|
| 300 mm fab expansion | High | New furnace, crystal-growth and wafer-processing tools create initial and replacement quartz demand. |
| Advanced-node purity requirements | High | Tighter contamination budgets increase the value of synthetic and ultra-high-purity grades. |
| Memory and AI investment | Medium-High | HBM, DRAM and advanced logic capacity raise tool utilization and replacement cycles. |
| Compound-semiconductor growth | Medium | SiC and GaN create specialized high-temperature quartz requirements. |
300 mm fab investment expands the installed quartz base
SEMI’s April 2026 outlook placed global 300 mm fab equipment spending at USD 133 billion in 2026 and USD 151 billion in 2027. The investment adds furnaces and wafer-processing equipment. Quartz suppliers benefit first from tool installation and then from recurring replacement as heat, cleaning and handling consume qualified processware. This matters commercially because process qualification, integration effort, supply continuity, engineering support and total manufacturing risk often influence purchasing decisions as strongly as component price, so suppliers that solve deployment constraints can defend approved positions even when technically similar alternatives are available.
Leading-edge nodes raise the value of purity
As device geometries shrink, allowable contamination budgets tighten. A trace metal or particle tolerated in a mature process can create yield loss at advanced nodes, pushing suppliers toward lower impurity levels, stronger traceability and cleaner finishing. This shifts revenue mix toward premium quartz rather than simply increasing physical component volume. This matters commercially because process qualification, integration effort, supply continuity, engineering support and total manufacturing risk often influence purchasing decisions as strongly as component price, so suppliers that solve deployment constraints can defend approved positions even when technically similar alternatives are available.
AI-driven memory investment increases process intensity
SEMI projected 300 mm memory equipment investment at USD 52 billion in 2026, led by HBM, DDR5 and AI infrastructure. Higher capacity and utilization increase replacement demand for qualified quartz while also raising the penalty for a processware shortage that could idle expensive production equipment. This matters commercially because process qualification, integration effort, supply continuity, engineering support and total manufacturing risk often influence purchasing decisions as strongly as component price, so suppliers that solve deployment constraints can defend approved positions even when technically similar alternatives are available.
Compound semiconductors broaden the application base
SiC and GaN devices for electric vehicles, power conversion and communications use high-temperature and chemically demanding environments. Although volumes are smaller than mainstream silicon, they expand the addressable market for specialized tubes, boats and custom parts, creating defensible niches for suppliers that adapt material grade and geometry. This matters commercially because process qualification, integration effort, supply continuity, engineering support and total manufacturing risk often influence purchasing decisions as strongly as component price, so suppliers that solve deployment constraints can defend approved positions even when technically similar alternatives are available.
MARKET RESTRAINTS
Restraints Impact Analysis*
| Factor | Relative impact* | Commercial mechanism |
|---|---|---|
| High-purity feedstock concentration | High | Limited qualified raw-material sources expose producers to supply and pricing volatility. |
| Energy-intensive processing | Medium-High | High thermal input raises conversion cost and influences regional economics. |
| Fab qualification cycles | High | New suppliers require extended testing before production approval. |
| Custom geometry burden | Medium | Equipment-specific parts increase engineering cost and reduce standardization. |
High-purity raw material is not a commodity input
Semiconductor quartz requires feedstock with impurity control far beyond general glass applications. Qualified sources are limited, and changes in mineral origin or purification can alter behavior. Producers carry strategic inventory and dual-source where possible, but upstream concentration still creates lead-time and price risk that cannot be solved by substituting lower-grade silica. This matters commercially because process qualification, integration effort, supply continuity, engineering support and total manufacturing risk often influence purchasing decisions as strongly as component price, so suppliers that solve deployment constraints can defend approved positions even when technically similar alternatives are available.
Fusion, forming and annealing consume significant energy
Quartz production requires very high process temperatures, making electricity and fuel costs meaningful. Producers can improve furnace efficiency, but large recipe or equipment changes may require material characterization and customer review. This limits how quickly suppliers can respond to energy shocks without risking a qualified product baseline. This matters commercially because process qualification, integration effort, supply continuity, engineering support and total manufacturing risk often influence purchasing decisions as strongly as component price, so suppliers that solve deployment constraints can defend approved positions even when technically similar alternatives are available.
Long qualification slows new capacity monetization
A new plant or material grade does not become revenue immediately. Customers validate impurity levels, particles, dimensions, thermal behavior and cleaning response before production use. Qualification can take many months, so capacity announcements represent future supply potential rather than instantly interchangeable output, especially at leading-edge fabs. This matters commercially because process qualification, integration effort, supply continuity, engineering support and total manufacturing risk often influence purchasing decisions as strongly as component price, so suppliers that solve deployment constraints can defend approved positions even when technically similar alternatives are available.
Custom processware reduces manufacturing flexibility
Many quartz components are tied to a particular furnace, tool or customer design. Suppliers maintain drawings, tooling, inspection plans and change-control records for a broad catalog of low-to-medium-volume parts. That complexity raises inventory and machining costs and makes scheduling less efficient than a market built around standardized high-volume products. This matters commercially because process qualification, integration effort, supply continuity, engineering support and total manufacturing risk often influence purchasing decisions as strongly as component price, so suppliers that solve deployment constraints can defend approved positions even when technically similar alternatives are available.
MARKET OPPORTUNITIES
Synthetic quartz for tighter contamination budgets
Synthetic fused silica offers more controlled impurity and thermal properties for demanding processes. As leading-edge fabs reduce contamination budgets, suppliers with scalable synthetic capability can move into premium processware where customers value predictable material chemistry enough to justify higher component cost and formal qualification. This matters commercially because process qualification, integration effort, supply continuity, engineering support and total manufacturing risk often influence purchasing decisions as strongly as component price, so suppliers that solve deployment constraints can defend approved positions even when technically similar alternatives are available.
Localization beside new semiconductor hubs
New fabs in the United States, China, Southeast Asia and Europe create opportunities to place machining, cleaning, inventory or full production near customers. Local presence shortens replacement lead times and improves engineering response during ramp, provided global raw-material and process controls keep quality consistent. This matters commercially because process qualification, integration effort, supply continuity, engineering support and total manufacturing risk often influence purchasing decisions as strongly as component price, so suppliers that solve deployment constraints can defend approved positions even when technically similar alternatives are available.
Quartz processware for SiC and GaN
Power and RF compound-semiconductor investment broadens demand beyond silicon logic and memory. Suppliers can develop components for specialized furnace, epitaxy and cleaning processes where higher temperatures and aggressive chemistries create demanding requirements. Early co-development with equipment makers can secure specification positions before volumes scale. This matters commercially because process qualification, integration effort, supply continuity, engineering support and total manufacturing risk often influence purchasing decisions as strongly as component price, so suppliers that solve deployment constraints can defend approved positions even when technically similar alternatives are available.
Lifecycle services and refurbishment
Fabs increasingly evaluate total cost per process cycle rather than purchase price alone. Suppliers that provide cleaning guidance, failure analysis, dimensional inspection, refurbishment where technically suitable and replacement recommendations can extend customer relationships beyond the initial part sale and use service data to improve future designs. This matters commercially because process qualification, integration effort, supply continuity, engineering support and total manufacturing risk often influence purchasing decisions as strongly as component price, so suppliers that solve deployment constraints can defend approved positions even when technically similar alternatives are available.
Quartz Materials for Semiconductor Supply Chain Analysis
High-purity silica & synthesis
Upstream value begins with impurity-controlled silica. Natural high-purity quartz requires selective mineral sources and purification, while synthetic routes build silica from controlled chemical precursors. Customers care about the final impurity profile, and feedstock consistency determines how much downstream processing is required to hold a qualified specification. This matters commercially because process qualification, integration effort, supply continuity, engineering support and total manufacturing risk often influence purchasing decisions as strongly as component price, so suppliers that solve deployment constraints can defend approved positions even when technically similar alternatives are available.
Fusion, forming & annealing
Fusion and forming establish density, bubble content, stress and dimensional potential. Producers use high-temperature equipment to create tubes, crucibles or billets and anneal them to manage internal stress. Yield loss at this stage is expensive because defects may appear only after substantial energy and processing have been consumed. This matters commercially because process qualification, integration effort, supply continuity, engineering support and total manufacturing risk often influence purchasing decisions as strongly as component price, so suppliers that solve deployment constraints can defend approved positions even when technically similar alternatives are available.
Precision machining & cleaning
Machining turns semi-finished quartz into tool-specific components. Grinding, joining, fire polishing, dimensional inspection and high-purity cleaning add value because the final part must fit an equipment platform and enter a clean environment. Documentation and packaging become part of the product when customers require traceability across every lot. This matters commercially because process qualification, integration effort, supply continuity, engineering support and total manufacturing risk often influence purchasing decisions as strongly as component price, so suppliers that solve deployment constraints can defend approved positions even when technically similar alternatives are available.
Fab qualification & replacement
Fabs and equipment makers validate parts before production use and then manage them through preventive or condition-based replacement. Once approved, a supplier can receive recurring orders for years, but material, process or site changes may trigger review. Lifecycle consistency is therefore as important as winning the initial qualification. This matters commercially because process qualification, integration effort, supply continuity, engineering support and total manufacturing risk often influence purchasing decisions as strongly as component price, so suppliers that solve deployment constraints can defend approved positions even when technically similar alternatives are available.
Recent Developments in the Quartz Materials for Semiconductor Market
Recent primary-source developments point to localization of high-purity quartz manufacturing near Asian fabs and continued growth in 300 mm semiconductor investment. Together they raise the installed base of quartz-consuming process equipment and the strategic value of suppliers that can deliver qualified synthetic materials, precision components and responsive local engineering support. This matters commercially because process qualification, integration effort, supply continuity, engineering support and total manufacturing risk often influence purchasing decisions as strongly as component price, so suppliers that solve deployment constraints can defend approved positions even when technically similar alternatives are available.
SEMI projected worldwide 300 mm memory equipment investment at USD 52 billion in 2026 and USD 57 billion in 2027, citing HBM, DDR5 and AI infrastructure. The expansion matters to quartz suppliers because new and more heavily utilized memory equipment creates both initial processware demand and recurring replacement cycles. This matters commercially because process qualification, integration effort, supply continuity, engineering support and total manufacturing risk often influence purchasing decisions as strongly as component price, so suppliers that solve deployment constraints can defend approved positions even when technically similar alternatives are available.
SEMI reported global 300 mm fab equipment spending expected at USD 133 billion in 2026 and USD 151 billion in 2027. The spending wave increases the installed base of thermal and wafer-processing equipment that uses quartz parts, while regional self-sufficiency programs encourage materials suppliers to place capacity closer to new fabs. This matters commercially because process qualification, integration effort, supply continuity, engineering support and total manufacturing risk often influence purchasing decisions as strongly as component price, so suppliers that solve deployment constraints can defend approved positions even when technically similar alternatives are available.
Heraeus Covantics opened a new Shenyang plant following an investment close to RMB 600 million. The facility specializes in high-purity synthetic quartz for semiconductor applications and includes automated production and R&D capability, demonstrating localization of advanced quartz capacity close to a large manufacturing cluster. This matters commercially because process qualification, integration effort, supply continuity, engineering support and total manufacturing risk often influence purchasing decisions as strongly as component price, so suppliers that solve deployment constraints can defend approved positions even when technically similar alternatives are available.
REPORT SCOPE & SEGMENTATION
The report scope preserves the source page’s product, application and end-user segmentation while converting its published 2024 and 2032 size anchors into a common 2025 base, 2026 estimate and 2034 forecast. The source page’s printed growth rate is replaced where it conflicts with its own market-size anchors, keeping the financial series internally consistent.
| Report attribute | Coverage |
|---|---|
| Market | Quartz Materials for Semiconductor |
| Base year | 2025 |
| Estimated year | 2026 |
| Forecast period | 2026–2034 |
| 2025 market size | USD 1.26 billion |
| 2034 forecast size | USD 2.31 billion |
| CAGR | 7.0% during 2026–2034 |
| Largest market in 2025 | Asia Pacific |
| By Type | Quartz Tube (High-purity quartz tubes; opaque quartz tubes; others); Quartz Crucible; Quartz Flange; Others |
| By Application | Oxidation Process; Diffusion Process; Others |
| Additional segmentation | By End User: Integrated Device Manufacturers (IDMs); Foundries; Research Institutes |
| Regions | North America; Europe; Asia Pacific; South America; Middle East & Africa |
| Companies profiled | Momentive; Heraeus; Qsil; Tosoh; Feilihua Quartz Glass; Jiangsu Pacific Quartz Co., Ltd. |
Frequently Asked Questions
What is the quartz materials for semiconductor market size in 2025?
The global quartz materials for semiconductor market is valued at USD 1.26 billion in 2025 under the standardized series used in this overview. The value is carried consistently through the Key Statistics, Market Overview, report scope and FAQ sections so that the article uses one market definition and one financial baseline rather than mixing figures from different source windows.
What is the forecast size of the quartz materials for semiconductor market by 2034?
The market is projected to reach USD 2.31 billion by 2034. The endpoint follows the annual growth factor implied by the source page’s published market-size anchors, keeping the 2025 base value, 2026 estimate, 2034 forecast and stated compound rate mathematically consistent across the full report overview. This matters commercially because process qualification, integration effort, supply continuity, engineering support and total manufacturing risk often influence purchasing decisions as strongly as component price, so suppliers that solve deployment constraints can defend approved positions even when technically similar alternatives are available.
What CAGR is expected for the quartz materials for semiconductor market during 2026–2034?
The standardized forecast corresponds to a 7.0% CAGR during 2026–2034. This rate is derived from the two published market-size anchors and is used consistently throughout the article, providing a stable reference for comparing segment momentum, regional demand, supplier positioning and the balance between growth drivers and operating constraints. This matters commercially because process qualification, integration effort, supply continuity, engineering support and total manufacturing risk often influence purchasing decisions as strongly as component price, so suppliers that solve deployment constraints can defend approved positions even when technically similar alternatives are available.
Which region is the largest quartz materials for semiconductor market in 2025?
Asia Pacific is identified as the largest market in 2025. Its leadership reflects the concentration of the relevant semiconductor manufacturing, packaging, display, device-production or supply-chain activities, giving suppliers a deeper installed base, more frequent qualification events and stronger local demand for technical support and continuity of supply. This matters commercially because process qualification, integration effort, supply continuity, engineering support and total manufacturing risk often influence purchasing decisions as strongly as component price, so suppliers that solve deployment constraints can defend approved positions even when technically similar alternatives are available.
Which product type leads the quartz materials for semiconductor market?
Quartz Tube is the leading source-defined type in this overview. Its position reflects broad use in established production flows, a large qualified installed base and purchasing familiarity among semiconductor manufacturers, while newer material or technology formats can grow faster from smaller bases as advanced devices create tighter thermal, mechanical, purity or resolution requirements.
Which application is most important in the quartz materials for semiconductor market?
Oxidation Process is the principal application within the source-defined segmentation. Purchasing is shaped by the consequence of failure in production: the selected material or component must meet process, yield, reliability and integration requirements, making qualification history and supplier engineering support important commercial variables alongside the nominal product specification. This matters commercially because process qualification, integration effort, supply continuity, engineering support and total manufacturing risk often influence purchasing decisions as strongly as component price, so suppliers that solve deployment constraints can defend approved positions even when technically similar alternatives are available.
Which region is growing fastest in the quartz materials for semiconductor market?
Asia Pacific has the strongest growth profile in this overview. New fabs, advanced packaging lines, localized supply chains or technology migrations create repeated qualification events, and suppliers benefit most where they can support these projects locally with dependable logistics, process engineering and product variants aligned with each customer’s manufacturing roadmap. This matters commercially because process qualification, integration effort, supply continuity, engineering support and total manufacturing risk often influence purchasing decisions as strongly as component price, so suppliers that solve deployment constraints can defend approved positions even when technically similar alternatives are available.
What are the main growth drivers for the quartz materials for semiconductor market?
The principal drivers are semiconductor capacity expansion, higher device integration, tighter manufacturing tolerances, advanced packaging or lithography adoption and the need for materials or components that protect yield as process complexity rises. These forces create new purchasing events whenever a fab adds capacity, changes a process module or qualifies a new technology generation.
What are the main restraints on the quartz materials for semiconductor market?
The principal restraints are long customer qualification cycles, manufacturing complexity, concentrated upstream supply, demanding defect or purity specifications and the high cost of process failure. These conditions slow supplier switching and new-product revenue conversion, while strengthening incumbents that can demonstrate stable process control, dependable capacity and application-engineering support. This matters commercially because process qualification, integration effort, supply continuity, engineering support and total manufacturing risk often influence purchasing decisions as strongly as component price, so suppliers that solve deployment constraints can defend approved positions even when technically similar alternatives are available.
Who are the key suppliers in the quartz materials for semiconductor market?
The source report profiles Momentive; Heraeus; Qsil; Tosoh; Feilihua Quartz Glass; Jiangsu Pacific Quartz Co., Ltd.. Competitive advantage depends on process capability, material consistency, customer qualification, intellectual property, capacity planning and technical support. The strongest suppliers translate product performance into repeatable fab or packaging yield while maintaining continuity of supply across multi-year semiconductor product and equipment cycles.
Research Sources & Evidence Base
Get Sample Report PDF for Exclusive Insights
Report Sample Includes
- Table of Contents
- List of Tables & Figures
- Charts, Research Methodology, and more...