SEMICONDUCTOR INSIGHT
MARKET RESEARCH REPORT

Periodically Poled Crystals Market

2026 to 2034
MARKET INTELLIGENCE
ACROSS KEY REGIONS
2026 EDITION
OPTOELECTRONICS Semiconductor Market Research

Periodically Poled Crystals Market

Size, Share & Industry Analysis, By Type (PPLN, PPKTP, PPLT, Others), By Application (Medical Industry, Consumer Electronics, Defense Industry, Others), By Form Factor (Bulk Crystal, Waveguide, Fiber-Coupled Module), By Nonlinear Process (SHG, SFG, DFG, OPO/OPA, SPDC), and Regional Forecast, 2026-2034

◷
UPDATED 05 October 2026
▤
REPORT LENGTH Detailed Report
▣
REPORT CODE 380b619aef65
▯
FORMATS PDF

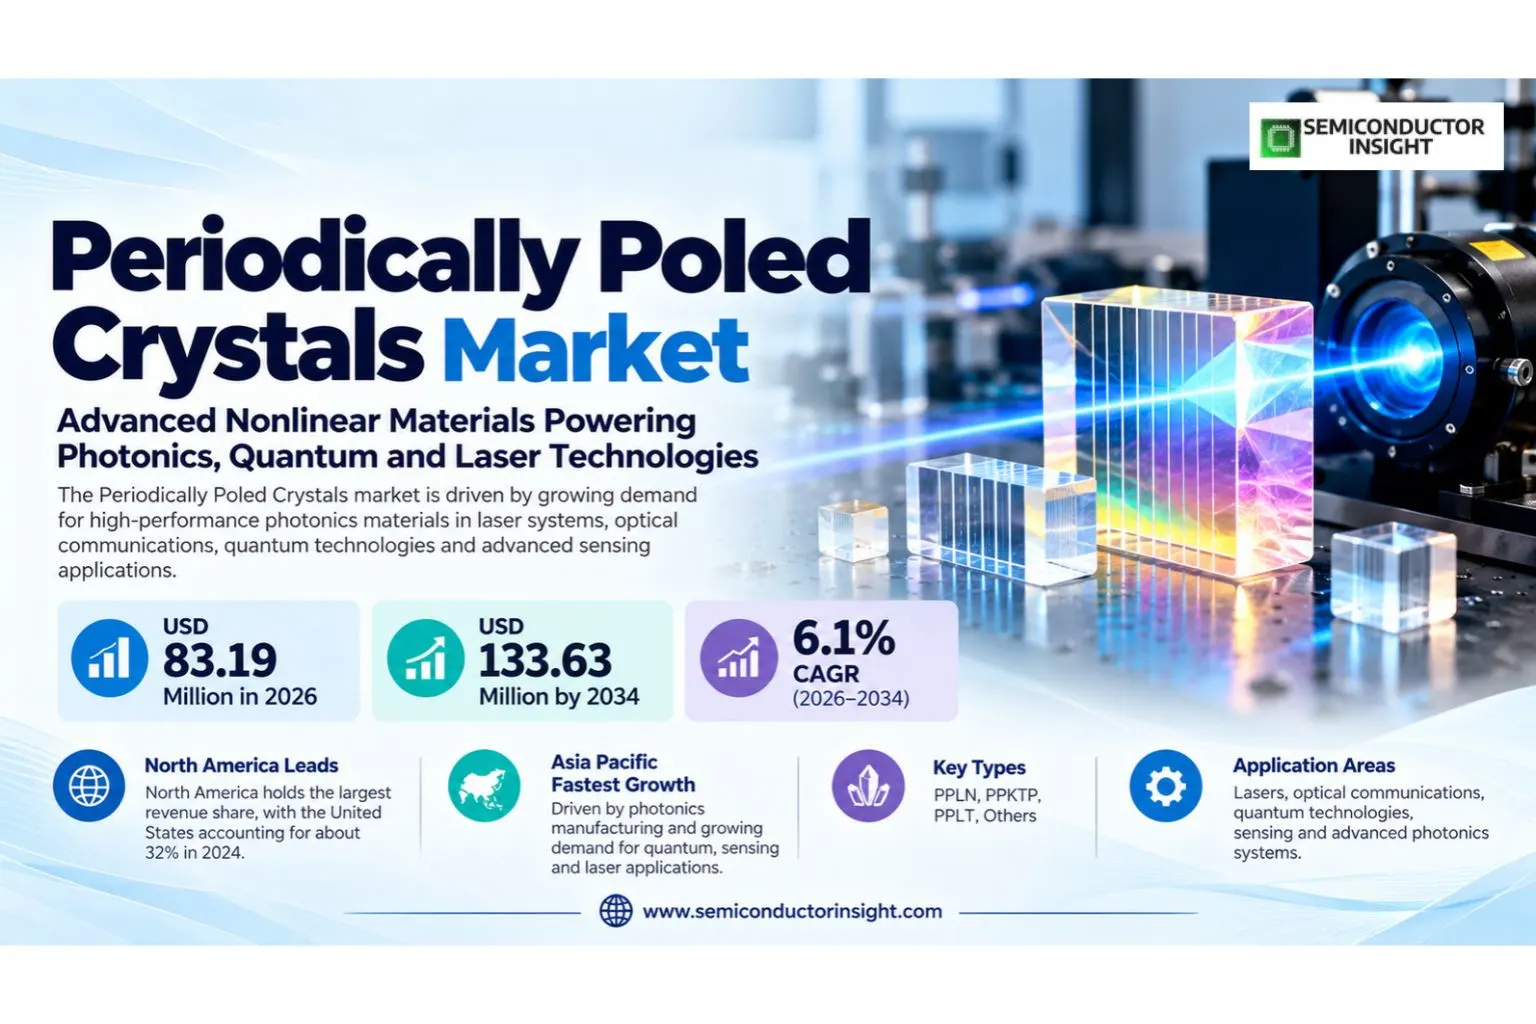
Periodically poled crystals market is valued at USD 78.41 million in 2025 and is projected to reach USD 133.63 million by 2034, expanding at a 6.1% CAGR during 2026–2034. The 2026 market level is USD 83.19 million. North America leads current revenue, with the United States holding about 32% share in 2024 in the underlying evidence. Asia Pacific is the fastest-growth region through photonics manufacturing and quantum, sensing and laser applications.

Get the sample PDF with study scope, segmentation and methodology details.

Key Statistics

2025 Market Size
USD 78.41 million
2034 Projected Market Size
USD 133.63 million
CAGR (2026–2034)
6.1%
Largest Market in 2025
North America

Key Takeaways

  • Market size: The market is valued at USD 78.41 million in 2025 and is projected to reach USD 133.63 million by 2034, representing a 6.1% CAGR during 2026–2034.
  • PPLN is a leading segment, reflecting broad use across the largest volume applications.
  • North America leads the market, while Asia Pacific provides the strongest growth profile.
  • Medical Industry is a major application, supported by rising performance and reliability requirements.
  • waveguide PPLN, quasi-phase matching and quantum-photonics integration is becoming a central competitive differentiator as customers seek higher performance and lower system-level cost.

Periodically Poled Crystals Market Overview

Periodically poled crystals market is valued at USD 78.41 million in 2025 and is projected to reach USD 133.63 million by 2034, expanding at a 6.1% CAGR during 2026–2034. The 2026 market level is USD 83.19 million. North America leads current revenue, with the United States holding about 32% share in 2024 in the underlying evidence. Asia Pacific is the fastest-growth region through photonics manufacturing and quantum, sensing and laser applications.

Base year: 2025 · Estimated year: 2026 · Forecast period: 2026–2034 · Values stated in U.S. dollars

Periodically Poled Crystals products provide a critical functional layer inside modern electronic and industrial systems. Their commercial value depends on performance, reliability, manufacturability, qualification and compatibility with the broader hardware architecture. Customers increasingly assess total system impact rather than component price alone, which favors suppliers that combine proven technology with consistent global support.

Technology development is focused on waveguide ppln, quasi-phase matching and quantum-photonics integration, tighter integration and more automated manufacturing. These trends raise the value of precision process control and application engineering because smaller geometries, higher data rates or greater power density leave less margin for variation. Qualification therefore becomes a major barrier to entry in premium applications.

Commercial competition combines scale with specialization. Large suppliers benefit from purchasing power, engineering resources and global manufacturing, while specialist vendors can win through process expertise or application-specific performance. Design wins are often durable because changing suppliers can require requalification of electrical, thermal, mechanical or reliability performance. Commercial decisions in the Periodically Poled Crystals market also depend on qualification history, integration effort, operating reliability, lifecycle support and measurable system-level value.

Segment Analysis: By Type

By type, the market is segmented into PPLN, PPKTP, PPLT, Others. Product selection depends on performance, cost, manufacturing complexity and the target system architecture. Higher-value variants generally offer tighter tolerances, greater integration or improved reliability, while mainstream categories retain volume leadership because of lower cost and broad compatibility. Commercial decisions in the Periodically Poled Crystals market also depend on qualification history, integration effort, operating reliability, lifecycle support and measurable system-level value.

Type Commercial role
PPLN PPLN serves a distinct portion of the Periodically Poled Crystals market based on performance, cost and integration requirements.
PPKTP PPKTP serves a distinct portion of the Periodically Poled Crystals market based on performance, cost and integration requirements.
PPLT PPLT serves a distinct portion of the Periodically Poled Crystals market based on performance, cost and integration requirements.
Others Others serves a distinct portion of the Periodically Poled Crystals market based on performance, cost and integration requirements.

Additional Segmentation: By Form Factor

Form Factor segmentation highlights important technical or commercial differences inside the Periodically Poled Crystals market. These categories affect pricing, qualification, process requirements and customer fit, making them useful for evaluating where value growth differs from simple unit growth. Commercial decisions in the Periodically Poled Crystals market also depend on qualification history, integration effort, operating reliability, lifecycle support and measurable system-level value.

Form Factor Demand characteristics
Bulk Crystal Higher optical-power handling and flexible laboratory or laser integration.
Waveguide High conversion efficiency and compact photonic integration.
Fiber-Coupled Module Turnkey wavelength-conversion modules for easier system integration.

Segment Analysis: By Application

By application, the market covers Medical Industry, Consumer Electronics, Defense Industry, Others. Demand varies by reliability, performance and product lifecycle. Premium applications usually require stricter qualification and long-term supply support, while higher-volume applications place more emphasis on cost, manufacturing scale and rapid technology migration. Commercial decisions in the Periodically Poled Crystals market also depend on qualification history, integration effort, operating reliability, lifecycle support and measurable system-level value.

Application Demand characteristics
Medical Industry Medical Industry is a material demand segment where reliability, cost and system performance influence purchasing decisions.
Consumer Electronics Consumer Electronics is a material demand segment where reliability, cost and system performance influence purchasing decisions.
Defense Industry Defense Industry is a material demand segment where reliability, cost and system performance influence purchasing decisions.
Others Others is a material demand segment where reliability, cost and system performance influence purchasing decisions.

Additional Segmentation: By Nonlinear Process

Nonlinear Process provides a second analytical view of the Periodically Poled Crystals market. It captures how product architecture and end-use requirements change supplier economics, qualification effort and technology roadmaps across the forecast period. Commercial decisions in the Periodically Poled Crystals market also depend on qualification history, integration effort, operating reliability, lifecycle support and measurable system-level value.

Nonlinear Process Commercial relevance
SHG Second-harmonic generation for wavelength doubling.
SFG Sum-frequency generation for visible and UV sources.
DFG Difference-frequency generation for tunable mid-infrared output.
OPO / OPA Optical parametric oscillation and amplification.
SPDC Photon-pair generation for quantum optics and sensing.

Regional Analysis

North America is the largest regional market, while Asia Pacific is the fastest-growth region. Regional positioning reflects manufacturing concentration, downstream electronics demand, capital investment and the availability of qualified suppliers. Commercial decisions in the Periodically Poled Crystals market also depend on qualification history, integration effort, operating reliability, lifecycle support and measurable system-level value.

Why does regional demand differ across the Periodically Poled Crystals market?

Regional demand varies with electronics manufacturing, technology adoption and local investment. North America has strong quantum, defense and photonics research demand, while Asia Pacific is expanding production capability and commercial laser applications. Commercial decisions in the Periodically Poled Crystals market also depend on qualification history, integration effort, operating reliability, lifecycle support and measurable system-level value.

Region Position Demand profile Supplier-selection factor
Asia Pacific Fastest growth Technology and end-market demand Qualification, cost and local support
North America Largest / strategic Technology and end-market demand Qualification, cost and local support
Europe Strategic Technology and end-market demand Qualification, cost and local support
South America Strategic Technology and end-market demand Qualification, cost and local support
Middle East & Africa Strategic Technology and end-market demand Qualification, cost and local support
Asia Pacific FAST GROWTH

How does Asia Pacific participate in the Periodically Poled Crystals market?

Asia Pacific is a major Periodically Poled Crystals market because China, Japan, South Korea, Taiwan and Southeast Asia combine electronics manufacturing, semiconductor production and fast infrastructure investment. North America has strong quantum, defense and photonics research demand, while Asia Pacific is expanding production capability and commercial laser applications. Commercial decisions in the Periodically Poled Crystals market also depend on qualification history, integration effort, operating reliability, lifecycle support and measurable system-level value.

Country / cluster Commercial logic
China / Taiwan Manufacturing scale and electronics demand.
Japan / South Korea / Southeast Asia High-value technology and supply-chain depth.

Market instances

  • Regional manufacturing capacity supports the Periodically Poled Crystals supply chain.
  • Electronics and semiconductor investment drives local demand.
  • Supplier proximity improves qualification and logistics.
North America LARGEST

How does North America participate in the Periodically Poled Crystals market?

North America is a high-value Periodically Poled Crystals market supported by U.S. technology companies, data centers, aerospace, automotive and advanced manufacturing. North America has strong quantum, defense and photonics research demand, while Asia Pacific is expanding production capability and commercial laser applications. Commercial decisions in the Periodically Poled Crystals market also depend on qualification history, integration effort, operating reliability, lifecycle support and measurable system-level value.

Country / cluster Commercial logic
United States Technology development, premium applications and design leadership.
Canada / Mexico Manufacturing and regional integration.

Market instances

  • U.S. technology investment supports Periodically Poled Crystals adoption.
  • Customers emphasize qualification and lifecycle support.
  • Regional supply diversification remains important.
Europe STRATEGIC

How does Europe participate in the Periodically Poled Crystals market?

Europe is strategically important in the Periodically Poled Crystals market through automotive, industrial, telecom and aerospace applications. Buyers emphasize reliability, environmental compliance and long product lifecycles. North America has strong quantum, defense and photonics research demand, while Asia Pacific is expanding production capability and commercial laser applications. Commercial decisions in the Periodically Poled Crystals market also depend on qualification history, integration effort, operating reliability, lifecycle support and measurable system-level value.

Country / cluster Commercial logic
Germany / France Industrial, automotive and technology demand.
UK / Nordics / Italy Specialty electronics and infrastructure.

Market instances

  • European customers favor high-reliability Periodically Poled Crystals solutions.
  • Industrial and automotive demand supports premium products.
  • Standards and sustainability influence supplier selection.
South America STRATEGIC

How does South America participate in the Periodically Poled Crystals market?

South America is an emerging Periodically Poled Crystals market led by Brazil. Demand is concentrated in industrial, automotive, telecom and imported electronics platforms, with local manufacturing more limited than the core regions. Commercial decisions in the Periodically Poled Crystals market also depend on qualification history, integration effort, operating reliability, lifecycle support and measurable system-level value.

Country / cluster Commercial logic
Brazil Largest regional electronics and industrial market.
Argentina / Chile / Colombia Smaller application-specific demand.

Market instances

  • Most advanced Periodically Poled Crystals products are imported.
  • Price sensitivity shapes product mix.
  • Growth follows industrial and electronics investment.
Middle East & Africa STRATEGIC

How does Middle East & Africa participate in the Periodically Poled Crystals market?

The Middle East and Africa remain emerging markets for Periodically Poled Crystals. Gulf investment in digital infrastructure and advanced manufacturing creates selective opportunities, while African demand is more concentrated in telecom, industrial and imported electronics. Commercial decisions in the Periodically Poled Crystals market also depend on qualification history, integration effort, operating reliability, lifecycle support and measurable system-level value.

Country / cluster Commercial logic
UAE / Saudi Arabia Smart infrastructure and technology investment.
South Africa / Israel Industrial, telecom and advanced electronics.

Market instances

  • Greenfield projects can adopt modern Periodically Poled Crystals technologies.
  • Most supply is imported.
  • Local integration and service influence deployment.

Competitive Landscape

ALPHALAS, Covesion, HC Photonics, Raicol Crystals, Hangzhou Shalom Electro-optics, Inrad Optics and nonlinear photonics specialists form the core competitive landscape. Suppliers differentiate through process capability, product breadth, qualification history, manufacturing scale and technical support. Commercial decisions in the Periodically Poled Crystals market also depend on qualification history, integration effort, operating reliability, lifecycle support and measurable system-level value.

The competitive frontier is shifting toward waveguide ppln, quasi-phase matching and quantum-photonics integration, which raises the value of engineering integration and reduces the importance of price alone in premium segments. Commercial decisions in the Periodically Poled Crystals market also depend on qualification history, integration effort, operating reliability, lifecycle support and measurable system-level value.

Customer relationships are durable because qualified products become embedded inside longer-lived systems. This creates switching costs but also requires suppliers to maintain lifecycle support and predictable quality. Commercial decisions in the Periodically Poled Crystals market also depend on qualification history, integration effort, operating reliability, lifecycle support and measurable system-level value.

Competitive tier Representative companies Primary differentiation
Global leaders ALPHALAS, Covesion, HC Photonics, Raicol Crystals, Hangzhou Shalom Electro-optics, Inrad Optics and nonlinear photonics specialists Scale, technology and customer qualification.
Specialists Regional and application-focused vendors Process expertise and niche performance.
Emerging suppliers New regional entrants Cost, local capacity and diversification.

Key companies profiled

ALPHALAS, Covesion, HC Photonics, Raicol Crystals, Hangzhou Shalom Electro-optics, Inrad Optics and nonlinear photonics specialists are included in the competitive scope. Their positions differ by product mix, technology capability, geographic manufacturing footprint and customer qualification. Commercial decisions in the Periodically Poled Crystals market also depend on qualification history, integration effort, operating reliability, lifecycle support and measurable system-level value.

Production Capacity Analysis

Capacity depends on specialized materials, precision manufacturing, automated inspection and qualified final test. Effective output is determined by saleable yield and customer-approved capacity rather than nominal equipment throughput alone. Commercial decisions in the Periodically Poled Crystals market also depend on qualification history, integration effort, operating reliability, lifecycle support and measurable system-level value.

Supply expansion increasingly requires duplicated qualification across several factories. This is strategically important because customers want resilience without sacrificing consistency, particularly in automotive, data-center, industrial and high-reliability applications. Commercial decisions in the Periodically Poled Crystals market also depend on qualification history, integration effort, operating reliability, lifecycle support and measurable system-level value.

Market Dynamics

The market is driven by electronics content growth, system performance requirements and supply-chain modernization. Growth is restrained by capital intensity, qualification cycles and pricing pressure. waveguide PPLN, quasi-phase matching and quantum-photonics integration creates the strongest opportunity for premium value growth. Commercial decisions in the Periodically Poled Crystals market also depend on qualification history, integration effort, operating reliability, lifecycle support and measurable system-level value.

Market Drivers

Driver Impact Commercial mechanism
Technology migration High waveguide PPLN, quasi-phase matching and quantum-photonics integration increases product value and complexity.
Electronics demand High More electronic content increases component consumption.
Supply diversification Medium-High Customers want qualified capacity across several regions.
Automation Medium Higher automation improves yield and throughput.

Technology migration

Customers are adopting more advanced architectures to improve performance, density or efficiency. This raises qualification and process-control requirements and supports premium pricing for technically differentiated suppliers. Commercial decisions in the Periodically Poled Crystals market also depend on qualification history, integration effort, operating reliability, lifecycle support and measurable system-level value. Buyers therefore evaluate technical performance together with manufacturability, supply continuity and the cost of maintaining the solution across its intended service life.

Electronics demand

Growth in automotive, data centers, industrial automation and connected devices expands the installed base requiring Periodically Poled Crystals products. Commercial decisions in the Periodically Poled Crystals market also depend on qualification history, integration effort, operating reliability, lifecycle support and measurable system-level value. Buyers therefore evaluate technical performance together with manufacturability, supply continuity and the cost of maintaining the solution across its intended service life.

Supply diversification

Geopolitical and logistics risk encourage multi-site sourcing, creating opportunities for suppliers that can replicate quality across factories. Commercial decisions in the Periodically Poled Crystals market also depend on qualification history, integration effort, operating reliability, lifecycle support and measurable system-level value. Buyers therefore evaluate technical performance together with manufacturability, supply continuity and the cost of maintaining the solution across its intended service life.

Automation

Automated process control, inspection and material handling can reduce variation and support larger production volumes. Commercial decisions in the Periodically Poled Crystals market also depend on qualification history, integration effort, operating reliability, lifecycle support and measurable system-level value. Buyers therefore evaluate technical performance together with manufacturability, supply continuity and the cost of maintaining the solution across its intended service life.

Market Restraints

Restraint Impact Commercial consequence
Capital intensity High Advanced manufacturing requires specialized equipment.
Qualification cycles Medium-High Customer approval can take many months.
Price pressure Medium High-volume segments face continuing cost reduction.
Supply-chain risk Medium Specialized materials or equipment can be concentrated.

Capital intensity

New Periodically Poled Crystals capacity can require significant equipment and qualification investment before revenue scales. Commercial decisions in the Periodically Poled Crystals market also depend on qualification history, integration effort, operating reliability, lifecycle support and measurable system-level value. Buyers therefore evaluate technical performance together with manufacturability, supply continuity and the cost of maintaining the solution across its intended service life.

Qualification cycles

Reliability validation and system integration slow supplier switching and delay new-factory ramps. Commercial decisions in the Periodically Poled Crystals market also depend on qualification history, integration effort, operating reliability, lifecycle support and measurable system-level value. Buyers therefore evaluate technical performance together with manufacturability, supply continuity and the cost of maintaining the solution across its intended service life.

Price pressure

Suppliers must offset lower average selling prices with yield, automation and differentiated technology. Commercial decisions in the Periodically Poled Crystals market also depend on qualification history, integration effort, operating reliability, lifecycle support and measurable system-level value. Buyers therefore evaluate technical performance together with manufacturability, supply continuity and the cost of maintaining the solution across its intended service life.

Supply-chain risk

Dependence on limited upstream suppliers can affect lead times and create the need for strategic inventory or second sourcing. Commercial decisions in the Periodically Poled Crystals market also depend on qualification history, integration effort, operating reliability, lifecycle support and measurable system-level value. Buyers therefore evaluate technical performance together with manufacturability, supply continuity and the cost of maintaining the solution across its intended service life.

Market Opportunities

waveguide PPLN, quasi-phase matching and quantum-photonics integration

waveguide PPLN, quasi-phase matching and quantum-photonics integration can expand value per unit and improve system performance. Commercial decisions in the Periodically Poled Crystals market also depend on qualification history, integration effort, operating reliability, lifecycle support and measurable system-level value. Buyers therefore evaluate technical performance together with manufacturability, supply continuity and the cost of maintaining the solution across its intended service life.

Regional manufacturing

New qualified capacity can support customers seeking geographic diversification. Commercial decisions in the Periodically Poled Crystals market also depend on qualification history, integration effort, operating reliability, lifecycle support and measurable system-level value. Buyers therefore evaluate technical performance together with manufacturability, supply continuity and the cost of maintaining the solution across its intended service life.

Automation and inspection

Better process control can raise yield and reduce lifecycle cost. Commercial decisions in the Periodically Poled Crystals market also depend on qualification history, integration effort, operating reliability, lifecycle support and measurable system-level value. Buyers therefore evaluate technical performance together with manufacturability, supply continuity and the cost of maintaining the solution across its intended service life.

Application-specific products

Tailored designs can capture premium niches with stronger qualification barriers. Commercial decisions in the Periodically Poled Crystals market also depend on qualification history, integration effort, operating reliability, lifecycle support and measurable system-level value. Buyers therefore evaluate technical performance together with manufacturability, supply continuity and the cost of maintaining the solution across its intended service life.

Supply Chain Analysis

Specialized materials & equipment
Precision manufacturing
Qualification & system integration
End-market deployment

Upstream. Specialized materials, wafers, laminates, metals or process equipment provide the technical foundation. Quality at this stage influences downstream yield and reliability. Commercial decisions in the Periodically Poled Crystals market also depend on qualification history, integration effort, operating reliability, lifecycle support and measurable system-level value. Buyers therefore evaluate technical performance together with manufacturability, supply continuity and the cost of maintaining the solution across its intended service life.

Manufacturing. Suppliers use precision process control and automated inspection to produce Periodically Poled Crystals products within tight tolerances. Yield improvement is a major economic lever. Commercial decisions in the Periodically Poled Crystals market also depend on qualification history, integration effort, operating reliability, lifecycle support and measurable system-level value. Buyers therefore evaluate technical performance together with manufacturability, supply continuity and the cost of maintaining the solution across its intended service life.

Integration. Products are qualified inside customer systems where electrical, thermal or mechanical behavior is validated. Design changes can trigger additional testing. Commercial decisions in the Periodically Poled Crystals market also depend on qualification history, integration effort, operating reliability, lifecycle support and measurable system-level value. Buyers therefore evaluate technical performance together with manufacturability, supply continuity and the cost of maintaining the solution across its intended service life.

Deployment. Finished products enter electronics, industrial, automotive, data-center or aerospace systems. Lifecycle support and supply continuity determine long-term customer value. Commercial decisions in the Periodically Poled Crystals market also depend on qualification history, integration effort, operating reliability, lifecycle support and measurable system-level value. Buyers therefore evaluate technical performance together with manufacturability, supply continuity and the cost of maintaining the solution across its intended service life.

Recent Developments in the Periodically Poled Crystals Market

Developments tracked through September 2026 and limited to events that materially affect technology, capacity, adoption or competition.

  • 2026 Current Portfolio
    HC Photonics continues supplying bulk and waveguide PPLN/PPLT devices for SHG, SFG, DFG, OPO, OPA, OPG and SPDC across 350 nm to 5 µm wavelength-conversion applications. Source
  • 2026 Product Availability
    HC Photonics lists off-the-shelf MgO:PPLN bulk and waveguide chips for nonlinear frequency mixing, with waveguide products supporting high conversion efficiency and commercial delivery. Source
  • 2025–2026 Technology Trend
    Commercial periodically poled crystal suppliers continue moving toward waveguide and fiber-coupled formats for quantum optics, spectroscopy, sensing and compact laser systems. Source

Report Scope & Segmentation

Attribute Scope
Base year 2025
Estimated year 2026
Forecast period 2026–2034
2025 market size USD 78.41 million
2026 estimated size USD 83.19 million
2034 projected size USD 133.63 million
CAGR (2026–2034) 6.1%
Largest market in 2025 North America
By Type PPLN; PPKTP; PPLT; Others
By Application Medical Industry; Consumer Electronics; Defense Industry; Others
By Form Factor Bulk Crystal; Waveguide; Fiber-Coupled Module
By Nonlinear Process SHG; SFG; DFG; OPO / OPA; SPDC
Companies profiled ALPHALAS, Covesion, HC Photonics, Raicol Crystals, Hangzhou Shalom Electro-optics, Inrad Optics and nonlinear photonics specialists

Frequently Asked Questions

What is the Periodically Poled Crystals market size in 2025?

The global market is valued at USD 78.41 million in 2025.

What is the market forecast for 2034?

The market is projected to reach USD 133.63 million by 2034, representing a 6.1% CAGR during 2026–2034. The 2026 market level is USD 83.19 million.

Which region leads the market?

North America is the largest market, while Asia Pacific has the strongest growth profile.

Which type is most important?

PPLN is a leading category within the current market structure.

Which applications matter most?

Medical Industry and other listed applications are the principal demand segments.

What technology trend matters most?

waveguide PPLN, quasi-phase matching and quantum-photonics integration is a major technology and competitive trend.

Who are the major suppliers?

Major participants include ALPHALAS, Covesion, HC Photonics, Raicol Crystals, Hangzhou Shalom Electro-optics, Inrad Optics and nonlinear photonics specialists.

What drives market growth?

Electronics content, technology upgrades, automation and supply-chain modernization are the main growth drivers.

What limits growth?

Capital intensity, qualification cycles, price pressure and supply-chain concentration are the main restraints.

What will shape the market through 2034?

waveguide PPLN, quasi-phase matching and quantum-photonics integration, regional manufacturing diversification and more automated production will shape the market through 2034.

Research Sources & Evidence Base

View research sources used in this market overview
  1. HC Photonics — PPLN and PPLT Portfolio. Current nonlinear-process, wavelength and form-factor evidence.
  2. HC Photonics — PPLN Chips. Bulk and waveguide product availability and performance context.

Periodically Poled Crystals Market Size, Share & Industry Analysis, By Type (PPLN, PPKTP, PPLT, Others), By Application (Medical Industry, Consumer Electronics, Defense Industry, Others), By Form Factor (Bulk Crystal, Waveguide, Fiber-Coupled Module), By Nonlinear Process (SHG, SFG, DFG, OPO/OPA, SPDC), and Regional Forecast, 2026-2034

Get Sample Report PDF for Exclusive Insights

Report Sample Includes

  • Table of Contents
  • List of Tables & Figures
  • Charts, Research Methodology, and more...

PDF Icon Download Sample Report PDF

Download Sample Report

Table of Content

1 Introduction to Research & Analysis Reports
1.1 Periodically Poled Crystals Market Definition
1.2 Market Segments
1.2.1 Segment by Type
1.2.2 Segment by Application
1.3 Global Periodically Poled Crystals Market Overview
1.4 Features & Benefits of This Report
1.5 Methodology & Sources of Information
1.5.1 Research Methodology
1.5.2 Research Process
1.5.3 Base Year
1.5.4 Report Assumptions & Caveats
2 Global Periodically Poled Crystals Overall Market Size
2.1 Global Periodically Poled Crystals Market Size: 2024 VS 2032
2.2 Global Periodically Poled Crystals Market Size, Prospects & Forecasts: 2026-2034
2.3 Global Periodically Poled Crystals Sales: 2026-2034
3 Company Landscape
3.1 Top Periodically Poled Crystals Players in Global Market
3.2 Top Global Periodically Poled Crystals Companies Ranked by Revenue
3.3 Global Periodically Poled Crystals Revenue by Companies
3.4 Global Periodically Poled Crystals Sales by Companies
3.5 Global Periodically Poled Crystals Price by Manufacturer (2020-2025)
3.6 Top 3 and Top 5 Periodically Poled Crystals Companies in Global Market, by Revenue in 2024
3.7 Global Manufacturers Periodically Poled Crystals Product Type
3.8 Tier 1, Tier 2, and Tier 3 Periodically Poled Crystals Players in Global Market
3.8.1 List of Global Tier 1 Periodically Poled Crystals Companies
3.8.2 List of Global Tier 2 and Tier 3 Periodically Poled Crystals Companies
4 Sights by Product
4.1 Overview
4.1.1 Segment by Type – Global Periodically Poled Crystals Market Size Markets, 2024 & 2032
4.1.2 PPLN
4.1.3 PPKTP
4.1.4 PPLT
4.2 Segment by Type – Global Periodically Poled Crystals Revenue & Forecasts
4.2.1 Segment by Type – Global Periodically Poled Crystals Revenue, 2020-2025
4.2.2 Segment by Type – Global Periodically Poled Crystals Revenue, 2026-2032
4.2.3 Segment by Type – Global Periodically Poled Crystals Revenue Market Share, 2026-2034
4.3 Segment by Type – Global Periodically Poled Crystals Sales & Forecasts
4.3.1 Segment by Type – Global Periodically Poled Crystals Sales, 2020-2025
4.3.2 Segment by Type – Global Periodically Poled Crystals Sales, 2026-2032
4.3.3 Segment by Type – Global Periodically Poled Crystals Sales Market Share, 2026-2034
4.4 Segment by Type – Global Periodically Poled Crystals Price (Manufacturers Selling Prices), 2026-2034
5 Sights by Application
5.1 Overview
5.1.1 Segment by Application – Global Periodically Poled Crystals Market Size, 2024 & 2032
5.1.2 Medical Industry
5.1.3 Consumer Electronic
5.1.4 Defense Industry
5.1.5 Others
5.2 Segment by Application – Global Periodically Poled Crystals Revenue & Forecasts
5.2.1 Segment by Application – Global Periodically Poled Crystals Revenue, 2020-2025
5.2.2 Segment by Application – Global Periodically Poled Crystals Revenue, 2026-2032
5.2.3 Segment by Application – Global Periodically Poled Crystals Revenue Market Share, 2026-2034
5.3 Segment by Application – Global Periodically Poled Crystals Sales & Forecasts
5.3.1 Segment by Application – Global Periodically Poled Crystals Sales, 2020-2025
5.3.2 Segment by Application – Global Periodically Poled Crystals Sales, 2026-2032
5.3.3 Segment by Application – Global Periodically Poled Crystals Sales Market Share, 2026-2034
5.4 Segment by Application – Global Periodically Poled Crystals Price (Manufacturers Selling Prices), 2026-2034
6 Sights by Region
6.1 By Region – Global Periodically Poled Crystals Market Size, 2024 & 2032
6.2 By Region – Global Periodically Poled Crystals Revenue & Forecasts
6.2.1 By Region – Global Periodically Poled Crystals Revenue, 2020-2025
6.2.2 By Region – Global Periodically Poled Crystals Revenue, 2026-2032
6.2.3 By Region – Global Periodically Poled Crystals Revenue Market Share, 2026-2034
6.3 By Region – Global Periodically Poled Crystals Sales & Forecasts
6.3.1 By Region – Global Periodically Poled Crystals Sales, 2020-2025
6.3.2 By Region – Global Periodically Poled Crystals Sales, 2026-2032
6.3.3 By Region – Global Periodically Poled Crystals Sales Market Share, 2026-2034
6.4 North America
6.4.1 By Country – North America Periodically Poled Crystals Revenue, 2026-2034
6.4.2 By Country – North America Periodically Poled Crystals Sales, 2026-2034
6.4.3 United States Periodically Poled Crystals Market Size, 2026-2034
6.4.4 Canada Periodically Poled Crystals Market Size, 2026-2034
6.4.5 Mexico Periodically Poled Crystals Market Size, 2026-2034
6.5 Europe
6.5.1 By Country – Europe Periodically Poled Crystals Revenue, 2026-2034
6.5.2 By Country – Europe Periodically Poled Crystals Sales, 2026-2034
6.5.3 Germany Periodically Poled Crystals Market Size, 2026-2034
6.5.4 France Periodically Poled Crystals Market Size, 2026-2034
6.5.5 U.K. Periodically Poled Crystals Market Size, 2026-2034
6.5.6 Italy Periodically Poled Crystals Market Size, 2026-2034
6.5.7 Russia Periodically Poled Crystals Market Size, 2026-2034
6.5.8 Nordic Countries Periodically Poled Crystals Market Size, 2026-2034
6.5.9 Benelux Periodically Poled Crystals Market Size, 2026-2034
6.6 Asia
6.6.1 By Region – Asia Periodically Poled Crystals Revenue, 2026-2034
6.6.2 By Region – Asia Periodically Poled Crystals Sales, 2026-2034
6.6.3 China Periodically Poled Crystals Market Size, 2026-2034
6.6.4 Japan Periodically Poled Crystals Market Size, 2026-2034
6.6.5 South Korea Periodically Poled Crystals Market Size, 2026-2034
6.6.6 Southeast Asia Periodically Poled Crystals Market Size, 2026-2034
6.6.7 India Periodically Poled Crystals Market Size, 2026-2034
6.7 South America
6.7.1 By Country – South America Periodically Poled Crystals Revenue, 2026-2034
6.7.2 By Country – South America Periodically Poled Crystals Sales, 2026-2034
6.7.3 Brazil Periodically Poled Crystals Market Size, 2026-2034
6.7.4 Argentina Periodically Poled Crystals Market Size, 2026-2034
6.8 Middle East & Africa
6.8.1 By Country – Middle East & Africa Periodically Poled Crystals Revenue, 2026-2034
6.8.2 By Country – Middle East & Africa Periodically Poled Crystals Sales, 2026-2034
6.8.3 Turkey Periodically Poled Crystals Market Size, 2026-2034
6.8.4 Israel Periodically Poled Crystals Market Size, 2026-2034
6.8.5 Saudi Arabia Periodically Poled Crystals Market Size, 2026-2034
6.8.6 UAE Periodically Poled Crystals Market Size, 2026-2034
7 Manufacturers & Brands Profiles
7.1 ALPHALAS
7.1.1 ALPHALAS Company Summary
7.1.2 ALPHALAS Business Overview
7.1.3 ALPHALAS Periodically Poled Crystals Major Product Offerings
7.1.4 ALPHALAS Periodically Poled Crystals Sales and Revenue in Global (2020-2025)
7.1.5 ALPHALAS Key News & Latest Developments
7.2 Photonic Solutions
7.2.1 Photonic Solutions Company Summary
7.2.2 Photonic Solutions Business Overview
7.2.3 Photonic Solutions Periodically Poled Crystals Major Product Offerings
7.2.4 Photonic Solutions Periodically Poled Crystals Sales and Revenue in Global (2020-2025)
7.2.5 Photonic Solutions Key News & Latest Developments
7.3 Covesion
7.3.1 Covesion Company Summary
7.3.2 Covesion Business Overview
7.3.3 Covesion Periodically Poled Crystals Major Product Offerings
7.3.4 Covesion Periodically Poled Crystals Sales and Revenue in Global (2020-2025)
7.3.5 Covesion Key News & Latest Developments
7.4 G and H
7.4.1 G and H Company Summary
7.4.2 G and H Business Overview
7.4.3 G and H Periodically Poled Crystals Major Product Offerings
7.4.4 G and H Periodically Poled Crystals Sales and Revenue in Global (2020-2025)
7.4.5 G and H Key News & Latest Developments
7.5 GWU-Lasertechnik
7.5.1 GWU-Lasertechnik Company Summary
7.5.2 GWU-Lasertechnik Business Overview
7.5.3 GWU-Lasertechnik Periodically Poled Crystals Major Product Offerings
7.5.4 GWU-Lasertechnik Periodically Poled Crystals Sales and Revenue in Global (2020-2025)
7.5.5 GWU-Lasertechnik Key News & Latest Developments
7.6 SRICO
7.6.1 SRICO Company Summary
7.6.2 SRICO Business Overview
7.6.3 SRICO Periodically Poled Crystals Major Product Offerings
7.6.4 SRICO Periodically Poled Crystals Sales and Revenue in Global (2020-2025)
7.6.5 SRICO Key News & Latest Developments
7.7 Opton Laser
7.7.1 Opton Laser Company Summary
7.7.2 Opton Laser Business Overview
7.7.3 Opton Laser Periodically Poled Crystals Major Product Offerings
7.7.4 Opton Laser Periodically Poled Crystals Sales and Revenue in Global (2020-2025)
7.7.5 Opton Laser Key News & Latest Developments
7.8 Deltronic Crystal Industries
7.8.1 Deltronic Crystal Industries Company Summary
7.8.2 Deltronic Crystal Industries Business Overview
7.8.3 Deltronic Crystal Industries Periodically Poled Crystals Major Product Offerings
7.8.4 Deltronic Crystal Industries Periodically Poled Crystals Sales and Revenue in Global (2020-2025)
7.8.5 Deltronic Crystal Industries Key News & Latest Developments
7.9 HC Photonics
7.9.1 HC Photonics Company Summary
7.9.2 HC Photonics Business Overview
7.9.3 HC Photonics Periodically Poled Crystals Major Product Offerings
7.9.4 HC Photonics Periodically Poled Crystals Sales and Revenue in Global (2020-2025)
7.9.5 HC Photonics Key News & Latest Developments
7.10 Hangzhou Shalom Electro-optics Technology
7.10.1 Hangzhou Shalom Electro-optics Technology Company Summary
7.10.2 Hangzhou Shalom Electro-optics Technology Business Overview
7.10.3 Hangzhou Shalom Electro-optics Technology Periodically Poled Crystals Major Product Offerings
7.10.4 Hangzhou Shalom Electro-optics Technology Periodically Poled Crystals Sales and Revenue in Global (2020-2025)
7.10.5 Hangzhou Shalom Electro-optics Technology Key News & Latest Developments
8 Global Periodically Poled Crystals Production Capacity, Analysis
8.1 Global Periodically Poled Crystals Production Capacity, 2026-2034
8.2 Periodically Poled Crystals Production Capacity of Key Manufacturers in Global Market
8.3 Global Periodically Poled Crystals Production by Region
9 Key Market Trends, Opportunity, Drivers and Restraints
9.1 Market Opportunities & Trends
9.2 Market Drivers
9.3 Market Restraints
10 Periodically Poled Crystals Supply Chain Analysis
10.1 Periodically Poled Crystals Industry Value Chain
10.2 Periodically Poled Crystals Upstream Market
10.3 Periodically Poled Crystals Downstream and Clients
10.4 Marketing Channels Analysis
10.4.1 Marketing Channels
10.4.2 Periodically Poled Crystals Distributors and Sales Agents in Global
11 Conclusion
12 Appendix
12.1 Note
12.2 Examples of Clients
12.3 DisclaimerList of Tables
Table 1. Key Players of Periodically Poled Crystals in Global Market
Table 2. Top Periodically Poled Crystals Players in Global Market, Ranking by Revenue (2024)
Table 3. Global Periodically Poled Crystals Revenue by Companies, (US$, Mn), 2020-2025
Table 4. Global Periodically Poled Crystals Revenue Share by Companies, 2020-2025
Table 5. Global Periodically Poled Crystals Sales by Companies, (Kg), 2020-2025
Table 6. Global Periodically Poled Crystals Sales Share by Companies, 2020-2025
Table 7. Key Manufacturers Periodically Poled Crystals Price (2020-2025) & (US$/Kg)
Table 8. Global Manufacturers Periodically Poled Crystals Product Type
Table 9. List of Global Tier 1 Periodically Poled Crystals Companies, Revenue (US$, Mn) in 2024 and Market Share
Table 10. List of Global Tier 2 and Tier 3 Periodically Poled Crystals Companies, Revenue (US$, Mn) in 2024 and Market Share
Table 11. Segment by Type – Global Periodically Poled Crystals Revenue, (US$, Mn), 2024 & 2032
Table 12. Segment by Type – Global Periodically Poled Crystals Revenue (US$, Mn), 2020-2025
Table 13. Segment by Type – Global Periodically Poled Crystals Revenue (US$, Mn), 2026-2032
Table 14. Segment by Type – Global Periodically Poled Crystals Sales (Kg), 2020-2025
Table 15. Segment by Type – Global Periodically Poled Crystals Sales (Kg), 2026-2032
Table 16. Segment by Application – Global Periodically Poled Crystals Revenue, (US$, Mn), 2024 & 2032
Table 17. Segment by Application – Global Periodically Poled Crystals Revenue, (US$, Mn), 2020-2025
Table 18. Segment by Application – Global Periodically Poled Crystals Revenue, (US$, Mn), 2026-2032
Table 19. Segment by Application – Global Periodically Poled Crystals Sales, (Kg), 2020-2025
Table 20. Segment by Application – Global Periodically Poled Crystals Sales, (Kg), 2026-2032
Table 21. By Region – Global Periodically Poled Crystals Revenue, (US$, Mn), 2025-2032
Table 22. By Region – Global Periodically Poled Crystals Revenue, (US$, Mn), 2020-2025
Table 23. By Region – Global Periodically Poled Crystals Revenue, (US$, Mn), 2026-2032
Table 24. By Region – Global Periodically Poled Crystals Sales, (Kg), 2020-2025
Table 25. By Region – Global Periodically Poled Crystals Sales, (Kg), 2026-2032
Table 26. By Country – North America Periodically Poled Crystals Revenue, (US$, Mn), 2020-2025
Table 27. By Country – North America Periodically Poled Crystals Revenue, (US$, Mn), 2026-2032
Table 28. By Country – North America Periodically Poled Crystals Sales, (Kg), 2020-2025
Table 29. By Country – North America Periodically Poled Crystals Sales, (Kg), 2026-2032
Table 30. By Country – Europe Periodically Poled Crystals Revenue, (US$, Mn), 2020-2025
Table 31. By Country – Europe Periodically Poled Crystals Revenue, (US$, Mn), 2026-2032
Table 32. By Country – Europe Periodically Poled Crystals Sales, (Kg), 2020-2025
Table 33. By Country – Europe Periodically Poled Crystals Sales, (Kg), 2026-2032
Table 34. By Region – Asia Periodically Poled Crystals Revenue, (US$, Mn), 2020-2025
Table 35. By Region – Asia Periodically Poled Crystals Revenue, (US$, Mn), 2026-2032
Table 36. By Region – Asia Periodically Poled Crystals Sales, (Kg), 2020-2025
Table 37. By Region – Asia Periodically Poled Crystals Sales, (Kg), 2026-2032
Table 38. By Country – South America Periodically Poled Crystals Revenue, (US$, Mn), 2020-2025
Table 39. By Country – South America Periodically Poled Crystals Revenue, (US$, Mn), 2026-2032
Table 40. By Country – South America Periodically Poled Crystals Sales, (Kg), 2020-2025
Table 41. By Country – South America Periodically Poled Crystals Sales, (Kg), 2026-2032
Table 42. By Country – Middle East & Africa Periodically Poled Crystals Revenue, (US$, Mn), 2020-2025
Table 43. By Country – Middle East & Africa Periodically Poled Crystals Revenue, (US$, Mn), 2026-2032
Table 44. By Country – Middle East & Africa Periodically Poled Crystals Sales, (Kg), 2020-2025
Table 45. By Country – Middle East & Africa Periodically Poled Crystals Sales, (Kg), 2026-2032
Table 46. ALPHALAS Company Summary
Table 47. ALPHALAS Periodically Poled Crystals Product Offerings
Table 48. ALPHALAS Periodically Poled Crystals Sales (Kg), Revenue (US$, Mn) and Average Price (US$/Kg) & (2020-2025)
Table 49. ALPHALAS Key News & Latest Developments
Table 50. Photonic Solutions Company Summary
Table 51. Photonic Solutions Periodically Poled Crystals Product Offerings
Table 52. Photonic Solutions Periodically Poled Crystals Sales (Kg), Revenue (US$, Mn) and Average Price (US$/Kg) & (2020-2025)
Table 53. Photonic Solutions Key News & Latest Developments
Table 54. Covesion Company Summary
Table 55. Covesion Periodically Poled Crystals Product Offerings
Table 56. Covesion Periodically Poled Crystals Sales (Kg), Revenue (US$, Mn) and Average Price (US$/Kg) & (2020-2025)
Table 57. Covesion Key News & Latest Developments
Table 58. G and H Company Summary
Table 59. G and H Periodically Poled Crystals Product Offerings
Table 60. G and H Periodically Poled Crystals Sales (Kg), Revenue (US$, Mn) and Average Price (US$/Kg) & (2020-2025)
Table 61. G and H Key News & Latest Developments
Table 62. GWU-Lasertechnik Company Summary
Table 63. GWU-Lasertechnik Periodically Poled Crystals Product Offerings
Table 64. GWU-Lasertechnik Periodically Poled Crystals Sales (Kg), Revenue (US$, Mn) and Average Price (US$/Kg) & (2020-2025)
Table 65. GWU-Lasertechnik Key News & Latest Developments
Table 66. SRICO Company Summary
Table 67. SRICO Periodically Poled Crystals Product Offerings
Table 68. SRICO Periodically Poled Crystals Sales (Kg), Revenue (US$, Mn) and Average Price (US$/Kg) & (2020-2025)
Table 69. SRICO Key News & Latest Developments
Table 70. Opton Laser Company Summary
Table 71. Opton Laser Periodically Poled Crystals Product Offerings
Table 72. Opton Laser Periodically Poled Crystals Sales (Kg), Revenue (US$, Mn) and Average Price (US$/Kg) & (2020-2025)
Table 73. Opton Laser Key News & Latest Developments
Table 74. Deltronic Crystal Industries Company Summary
Table 75. Deltronic Crystal Industries Periodically Poled Crystals Product Offerings
Table 76. Deltronic Crystal Industries Periodically Poled Crystals Sales (Kg), Revenue (US$, Mn) and Average Price (US$/Kg) & (2020-2025)
Table 77. Deltronic Crystal Industries Key News & Latest Developments
Table 78. HC Photonics Company Summary
Table 79. HC Photonics Periodically Poled Crystals Product Offerings
Table 80. HC Photonics Periodically Poled Crystals Sales (Kg), Revenue (US$, Mn) and Average Price (US$/Kg) & (2020-2025)
Table 81. HC Photonics Key News & Latest Developments
Table 82. Hangzhou Shalom Electro-optics Technology Company Summary
Table 83. Hangzhou Shalom Electro-optics Technology Periodically Poled Crystals Product Offerings
Table 84. Hangzhou Shalom Electro-optics Technology Periodically Poled Crystals Sales (Kg), Revenue (US$, Mn) and Average Price (US$/Kg) & (2020-2025)
Table 85. Hangzhou Shalom Electro-optics Technology Key News & Latest Developments
Table 86. Periodically Poled Crystals Capacity of Key Manufacturers in Global Market, 2023-2025 (Kg)
Table 87. Global Periodically Poled Crystals Capacity Market Share of Key Manufacturers, 2023-2025
Table 88. Global Periodically Poled Crystals Production by Region, 2020-2025 (Kg)
Table 89. Global Periodically Poled Crystals Production by Region, 2026-2032 (Kg)
Table 90. Periodically Poled Crystals Market Opportunities & Trends in Global Market
Table 91. Periodically Poled Crystals Market Drivers in Global Market
Table 92. Periodically Poled Crystals Market Restraints in Global Market
Table 93. Periodically Poled Crystals Raw Materials
Table 94. Periodically Poled Crystals Raw Materials Suppliers in Global Market
Table 95. Typical Periodically Poled Crystals Downstream
Table 96. Periodically Poled Crystals Downstream Clients in Global Market
Table 97. Periodically Poled Crystals Distributors and Sales Agents in Global Market

List of Figures
Figure 1. Periodically Poled Crystals Product Picture
Figure 2. Periodically Poled Crystals Segment by Type in 2024
Figure 3. Periodically Poled Crystals Segment by Application in 2024
Figure 4. Global Periodically Poled Crystals Market Overview: 2024
Figure 5. Key Caveats
Figure 6. Global Periodically Poled Crystals Market Size: 2024 VS 2032 (US$, Mn)
Figure 7. Global Periodically Poled Crystals Revenue: 2026-2034 (US$, Mn)
Figure 8. Periodically Poled Crystals Sales in Global Market: 2026-2034 (Kg)
Figure 9. The Top 3 and 5 Players Market Share by Periodically Poled Crystals Revenue in 2024
Figure 10. Segment by Type – Global Periodically Poled Crystals Revenue, (US$, Mn), 2024 & 2032
Figure 11. Segment by Type – Global Periodically Poled Crystals Revenue Market Share, 2026-2034
Figure 12. Segment by Type – Global Periodically Poled Crystals Sales Market Share, 2026-2034
Figure 13. Segment by Type – Global Periodically Poled Crystals Price (US$/Kg), 2026-2034
Figure 14. Segment by Application – Global Periodically Poled Crystals Revenue, (US$, Mn), 2024 & 2032
Figure 15. Segment by Application – Global Periodically Poled Crystals Revenue Market Share, 2026-2034
Figure 16. Segment by Application – Global Periodically Poled Crystals Sales Market Share, 2026-2034
Figure 17. Segment by Application -Global Periodically Poled Crystals Price (US$/Kg), 2026-2034
Figure 18. By Region – Global Periodically Poled Crystals Revenue, (US$, Mn), 2025 & 2032
Figure 19. By Region – Global Periodically Poled Crystals Revenue Market Share, 2020 VS 2024 VS 2032
Figure 20. By Region – Global Periodically Poled Crystals Revenue Market Share, 2026-2034
Figure 21. By Region – Global Periodically Poled Crystals Sales Market Share, 2026-2034
Figure 22. By Country – North America Periodically Poled Crystals Revenue Market Share, 2026-2034
Figure 23. By Country – North America Periodically Poled Crystals Sales Market Share, 2026-2034
Figure 24. United States Periodically Poled Crystals Revenue, (US$, Mn), 2026-2034
Figure 25. Canada Periodically Poled Crystals Revenue, (US$, Mn), 2026-2034
Figure 26. Mexico Periodically Poled Crystals Revenue, (US$, Mn), 2026-2034
Figure 27. By Country – Europe Periodically Poled Crystals Revenue Market Share, 2026-2034
Figure 28. By Country – Europe Periodically Poled Crystals Sales Market Share, 2026-2034
Figure 29. Germany Periodically Poled Crystals Revenue, (US$, Mn), 2026-2034
Figure 30. France Periodically Poled Crystals Revenue, (US$, Mn), 2026-2034
Figure 31. U.K. Periodically Poled Crystals Revenue, (US$, Mn), 2026-2034
Figure 32. Italy Periodically Poled Crystals Revenue, (US$, Mn), 2026-2034
Figure 33. Russia Periodically Poled Crystals Revenue, (US$, Mn), 2026-2034
Figure 34. Nordic Countries Periodically Poled Crystals Revenue, (US$, Mn), 2026-2034
Figure 35. Benelux Periodically Poled Crystals Revenue, (US$, Mn), 2026-2034
Figure 36. By Region – Asia Periodically Poled Crystals Revenue Market Share, 2026-2034
Figure 37. By Region – Asia Periodically Poled Crystals Sales Market Share, 2026-2034
Figure 38. China Periodically Poled Crystals Revenue, (US$, Mn), 2026-2034
Figure 39. Japan Periodically Poled Crystals Revenue, (US$, Mn), 2026-2034
Figure 40. South Korea Periodically Poled Crystals Revenue, (US$, Mn), 2026-2034
Figure 41. Southeast Asia Periodically Poled Crystals Revenue, (US$, Mn), 2026-2034
Figure 42. India Periodically Poled Crystals Revenue, (US$, Mn), 2026-2034
Figure 43. By Country – South America Periodically Poled Crystals Revenue Market Share, 2026-2034
Figure 44. By Country – South America Periodically Poled Crystals Sales, Market Share, 2026-2034
Figure 45. Brazil Periodically Poled Crystals Revenue, (US$, Mn), 2026-2034
Figure 46. Argentina Periodically Poled Crystals Revenue, (US$, Mn), 2026-2034
Figure 47. By Country – Middle East & Africa Periodically Poled Crystals Revenue, Market Share, 2026-2034
Figure 48. By Country – Middle East & Africa Periodically Poled Crystals Sales, Market Share, 2026-2034
Figure 49. Turkey Periodically Poled Crystals Revenue, (US$, Mn), 2026-2034
Figure 50. Israel Periodically Poled Crystals Revenue, (US$, Mn), 2026-2034
Figure 51. Saudi Arabia Periodically Poled Crystals Revenue, (US$, Mn), 2026-2034
Figure 52. UAE Periodically Poled Crystals Revenue, (US$, Mn), 2026-2034
Figure 53. Global Periodically Poled Crystals Production Capacity (Kg), 2026-2034
Figure 54. The Percentage of Production Periodically Poled Crystals by Region, 2024 VS 2032
Figure 55. Periodically Poled Crystals Industry Value Chain
Figure 56. Marketing Channels