SEMICONDUCTOR INSIGHT
MARKET RESEARCH REPORT

Optical Lens for Mobile Phone Market

2026 to 2034
MARKET INTELLIGENCE
ACROSS KEY REGIONS
2026 EDITION
OPTOELECTRONICS Semiconductor Market Research

Optical Lens for Mobile Phone Market

Size Size, Share and Industry Analysis, 2026–2034

◷
UPDATED 03 November 2026
▤
REPORT LENGTH Detailed Report
▣
REPORT CODE 222bc60a7efe
▯
FORMATS PDF

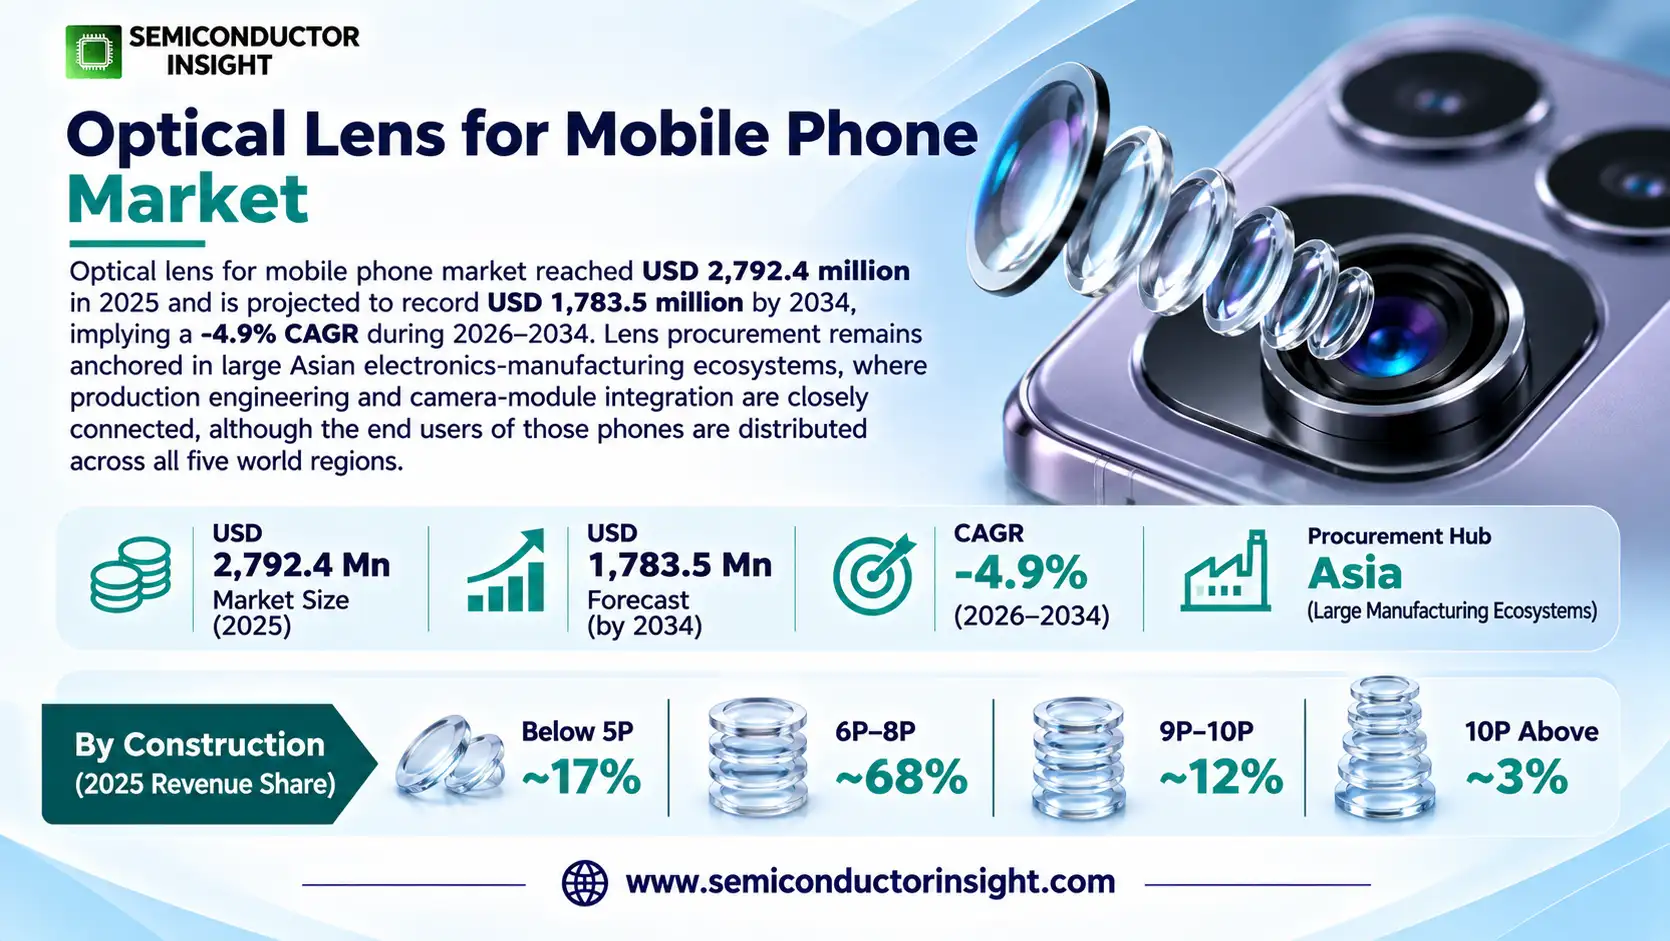
Optical lens for mobile phone market reached USD 2,792.4 million in 2025 and is projected to record USD 1,783.5 million by 2034, implying a -4.9% CAGR during 2026–2034. Lens procurement remains anchored in large Asian electronics-manufacturing ecosystems, where production engineering and camera-module integration are closely connected, although the end users of those phones are distributed across all five world regions.

Get the sample PDF with study scope, segmentation and methodology details.

Key Statistics

2025 Market Size
USD 2,792.4 million
2034 Projected Size
USD 1,783.5 million
CAGR (2026–2034)
-4.9%
Largest Market in 2025
Asia-Pacific (~60%)

Key Takeaways

  • Forecast reset: the value of optical lens sets for smartphones is modeled at USD 2,792.4 million for 2025 and USD 1,783.5 million for 2034, corresponding to -4.9% annual change. This revenue outlook recognizes downward pricing and weak low-end handset demand even though sophisticated imaging paths command specialist optical expertise.
  • Core optical constructions with six to eight plastic elements represent an estimated ~68% of 2025 sales value. Their extensive use across different rear-camera formats leaves this group most exposed to mass-market production cycles, while high-element-count lenses in specialized telephoto paths capture a smaller but more resilient expenditure pool.
  • Camera orientation divides revenue into an estimated ~76% rear-facing lens group and ~24% front-facing group. Per-device camera count rather than selfie usage explains the difference: handset makers typically buy multiple independent optical designs for their main, wide and magnified rear imaging channels.
  • Production footprint favors Asia-Pacific, with modeled 2025 share of ~60%, primarily due to optical-tooling capacity, plastic aspherical production and alignment expertise. Premium imaging specifications originate globally, but a small number of regional optical clusters perform a high proportion of the actual component fabrication.
  • Product strategy is becoming more selective as expensive memory and semiconductors reduce entry-tier device affordability. Suppliers serving 9P–10P and hybrid designs may still secure technically challenging flagship orders, whereas firms depending on inexpensive legacy optics are vulnerable to skipped models and longer phone retention.

Optical Lens for Mobile Phone Market Overview

Optical lens for mobile phone market reached USD 2,792.4 million in 2025 and is projected to record USD 1,783.5 million by 2034, implying a -4.9% CAGR during 2026–2034. Lens procurement remains anchored in large Asian electronics-manufacturing ecosystems, where production engineering and camera-module integration are closely connected, although the end users of those phones are distributed across all five world regions.

Base year: 2025 · Estimated year: 2026 · Forecast period: 2026–2034 · Historical data: 2020–2024 · Values in USD million

Camera optics are the refractive assemblies that gather scene light and project a controlled image onto a mobile-device sensor. The commercial unit is ordinarily a designed group of several plastic or hybrid elements mounted within a small barrel, with its configuration chosen for a particular field of view, f-number and sensor geometry. Manufacturing economics depend on mold precision and the percentage of assemblies meeting image-quality criteria after coating and alignment, not simply the weight of material used in each lens.

This industry scope counts the finished optical lens sets built into front and back cameras in handsets. A folded telephoto solution or a glass-plastic lens set is included when its optical assembly is supplied as a lens product, whereas the finished multi-part camera module and the separate CMOS image sensor are outside the market boundary. The complete phone, independent autofocus motors, stabilizer electronics and display glass likewise sit downstream or adjacent to the defined lens revenue stream.

The source series for this outlook describes a structural reduction in total revenue, an assumption that needs to be interpreted alongside improving camera technology. Faster lenses and higher resolution increase design expense on select phones, but cheaper mass-market optics still represent a large production volume. Declining device units, competitive supplier prices and a shift toward holding phones longer can outweigh increases in lens complexity, producing contraction in the total value of shipped lens assemblies over a multi-year cycle.

One key commercial distinction is between the number of optical elements and their optical value. A seven-plastic-element wide lens could be a high-volume mainstream design, while a hybrid design containing fewer optical pieces can require more difficult glass forming and precise coating. Smartphone imaging roadmaps increasingly balance folded optical routes, sensor size, autofocus travel, camera protrusion and field-edge sharpness, so procurement teams evaluate whole-lens quality rather than treating element count as a sufficient performance rating.

Demand conditions deteriorated during 2026 as smartphone suppliers faced greater memory procurement costs and difficult affordability decisions. Camera module content cannot be separated from those device economics: an original-equipment manufacturer may remove a secondary camera, postpone a midrange launch or negotiate a lower lens-set price to protect retail margins. Even premium programs can be more selective when unit forecasts become uncertain, resulting in different outcomes for camera component specialists and for finished-device brands.

Successful lens suppliers therefore operate close to camera-module engineering teams and support repeated prototype changes before a mass-production release. Optical design simulations must translate into reproducible plastic surfaces, consistent barrel bonding and robust environmental reliability, while the final production batch must pass measurements that replicate customer image-quality thresholds. Companies with deep experience in aspherical molds and optical metrology can defend qualified programs; others may compete almost entirely on cost in standard designs.

Segment Analysis: By Type

By construction, suppliers divide phone optical lenses into Below 5P, 6P–8P, 9P–10P and 10P Above. Estimated 2025 revenue is weighted toward 6P–8P systems at ~68%, reflecting their balance of image correction and mass-production cost. Simpler optics occupy about ~17%, nine- to ten-element products roughly ~12%, and configurations above ten plastic elements around ~3%.

Element count Typical technical requirements Revenue and purchasing character
Below 5P Basic camera designs using fewer than five plastic refractive pieces can satisfy low-resolution supporting cameras and selected budget selfie applications. Fewer molded surfaces make the stack compact and usually less expensive to assemble, provided the lens is not required to correct large apertures or demanding off-axis imagery. An estimated ~17% of 2025 value, with modeled annual decline near ~11.0%. These lens types face the strongest pressure from simplified affordable handsets and low vendor switching barriers. A producer may need exceptionally efficient mold utilization and automated visual checks to retain reasonable margins when customers demand recurring reductions in per-unit prices.
6P–8P Six-, seven- and eight-element plastic assemblies remain the practical middle of smartphone-camera optical design because they create sufficient degrees of freedom for correction without requiring a specialist glass process. They are used in ordinary wide-angle and ultra-wide camera systems and may employ aspherical surfaces to manage aberrations within the thin body of a phone. Revenue contribution is modeled at ~68% in 2025, with a ~5.4% yearly decline as the mass-market phone base contracts. Seven-element optics may command more engineering attention than older lenses, but they are bought in large production programs where qualification strength and unit economics are just as important as headline resolution.
9P–10P High-element-count lens groups provide additional optical correction surfaces, often used when a project requires strong resolution across larger sensors or challenging zoom designs. More surfaces raise the risks of decentering, flare and cumulative assembly tolerance, so premium qualification can demand specialized inspections, low-defect coatings and sophisticated mold fabrication. This category is a smaller estimated ~12% slice of 2025 revenue but has modeled growth of about ~1.0%, contrasting with the industry decline. A high price per accepted lens creates an attractive niche; customer dependence, prototype rework and restricted production yields can nevertheless keep participation concentrated among a relatively small number of specialized suppliers.
10P Above Camera architectures involving more than ten plastic lens elements are uncommon and highly design-specific. Engineers often prefer folded light paths, sensor signal processing or hybrid glass elements as alternatives to lengthening a purely refractive stack. When very complex systems are selected, retaining uniform optical performance across multiple production lines is a significant engineering challenge. Only about ~3% of the modeled 2025 sales value is allocated to this specialist segment, with a ~2.0% rate of growth. Commercial orders depend on isolated high-performance programs, and scaling output may require new molding tools, stricter material controls and additional in-line metrology. Complexity by itself does not guarantee a profitable product contract.

How material selection changes element economics

A glass element can provide optical properties or dimensional stability that differ from plastic, but glass forming may require more involved production tooling. Hybrid stacks combine these materials and add thermal matching and bonding requirements, especially in long focal-length or folded camera assemblies. AAC has documented the expansion of seven-element and hybrid constructions, indicating that component value increasingly depends on glass-shaping and assembly capabilities not fully captured by counting pieces labeled P.

The type groupings should not be confused with sensor megapixel categories. A device using a 200MP camera may also rely on sophisticated software binning, and its optical stack needs specific resolution, contrast and distortion characteristics to exploit the sensor. Optical precision, aperture, coatings and the mechanical barrel remain separate design decisions from electrical pixel count, which is a measure of the image sensor rather than the number of molded lens surfaces.

Element-count mix as a revenue model

The four element-count classes are assigned 2025 revenue contributions of roughly USD 474.7 million for Below 5P, USD 1,898.8 million for 6P–8P, USD 335.1 million for 9P–10P, and USD 83.8 million for 10P Above. These derived values are scenario allocations rather than independently disclosed manufacturer sales. They correspond to ~17%, ~68%, ~12% and ~3% of the same global basis, preserving a total ~100% allocation in the 2025 reference period.

The modeled annual changes for 2026–2034 differ meaningfully by construction complexity: Below 5P declines near ~11.0%, 6P–8P near ~5.4%, while 9P–10P can gain around ~1.0% and 10P Above around ~2.0%. Those paths deliberately contrast legacy unit-driven pricing with specialist imaging programs. They should be read as analytical scenarios describing category economics rather than as a guarantee that any supplier will achieve the category-wide rate.

Segment Analysis: By Application

Application is separated into Front Lens and Rear Lens based on camera orientation. Rear optics account for approximately ~76% of the modeled 2025 revenue base because several different rear optical channels may be purchased for one phone. Front camera optics represent approximately ~24% and prioritize thin integration, portrait framing and reliable imaging at typical video-call distances.

Application Demand characteristics
Front Lens The selfie camera occupies a tightly constrained space beside the display and must work across close portrait distances, changing indoor light and face-tracking conditions. Its optical design often uses fewer elements than a premium rear camera stack because physical depth and cost are unusually restrictive. This application is modeled at ~24% revenue share in 2025 and a ~5.2% decline, driven primarily by fewer affordable phones entering the market.
Rear Lens Rear camera lens assemblies serve normal, panoramic and magnified image capture and are often supplied through separate manufacturing qualifications. A single phone can purchase a primary wide lens, an ultra-wide unit and a refractive or folded telephoto group, each requiring different mechanical spacing and aberration correction. Together these optical routes capture an estimated ~76% of value while the modeled category declines ~4.8% annually under wider smartphone shipment pressure.

Lens demand follows the complete image system rather than a simple front-versus-rear preference among users. An OEM can revise the rear camera module by changing sensor format, making a previously qualified lens unusable even when the exterior phone body barely changes. Conversely, one approved front optical design can serve several device configurations, creating a more concentrated price negotiation. Suppliers therefore measure opportunity through specific active device platforms, lens sockets per phone and accepted factory shipments.
Regional Analysis

Asia-Pacific is modeled at ~60% of global optical-lens revenue in 2025, substantially ahead of North America at ~17% and Europe at ~15%. Its lead reflects the location of precision optical molding, smartphone module assembly and supplier qualification teams rather than the residence of all end users. South America accounts for ~5% and the Middle East and Africa for ~3%. These are analytical estimates of component demand by commercial geography, not a census of factory shipments.

Why does the geography of lens fabrication differ from the geography of smartphone sales?

The chain of custody can cross borders more than once before a finished handset reaches its buyer. Smartphone brands plan optics in laboratories worldwide, but molds are often produced near specialist Asian supply clusters, and lens barrels can be integrated at a separate camera-module facility. A camera assembly may then travel to another handset factory for final fitting. Consequently, location-based analysis should examine original customer purchasing, production qualification and the destination of complete devices without counting the same lens several times.

For Asia-Pacific, a country allocation exercise gives China ~52%, Taiwan ~16%, South Korea ~12%, Japan ~10%, India ~7% and remaining economies ~3% of the regional optical-component expenditure. These shares are analytical allocations within the region and should not be interpreted as national industry statistics. In a 2025 baseline the largest order streams would still be linked to handset makers and camera integrators operating through the broader 2026–2034 procurement cycle.

North America is allocated an internal country mix of ~82% for the United States, ~11% for Canada and ~7% for Mexico within its ~17% global weight. Those figures refer to an assumed destination-market split, not to the location of lens molding or registered supplier headquarters. The modeled regional value changes at ~4.2% a year through the 2026–2034 window, a slower contraction than the analogous ~5.2% reference for Asia-Pacific.

Europe is modeled with United Kingdom demand at ~25% of regional value, Germany at ~22%, France at ~20%, Italy at ~18% and other European markets at ~15%. The distribution reflects an illustrative device-consumption allocation for 2025 rather than an audited shipment dataset. A ~4.8% annual decline in optical-component value is attributed to the region for 2026–2034, including both the premium and less sophisticated camera purchases embedded in each national handset mix.

Within South America, the estimated local apportionment is Brazil ~58%, Argentina ~22%, Chile ~12% and other destinations ~8% for the 2025 comparison year. As a share of the ~5% global regional pool, these proportions indicate where device-market mix could affect upstream optical procurement. Under a ~4.2% CAGR value contraction, lens sellers would need to win additional high-content cameras simply to offset some of the continuing price pressure in basic handset models.

For the Middle East and Africa, an illustrative within-region split gives Saudi Arabia ~24%, South Africa ~20%, the United Arab Emirates ~18% and other countries ~38%. These 2025 assumptions are not statements about the place where finished optics are molded or assembled. The region retains only ~3% of the global component allocation and is modeled with a ~4.0% annual decline through 2034, reflecting different retail and upgrade choices across its submarkets.

Region Position Growth outlook Demand profile What decides supplier selection
Asia-Pacific Largest (~60%) Contraction (~5.2% CAGR) Lens fabrication and phone assembly Advanced molding yields, qualification cycles and regional customer relationships
North America Second (~17%) Contraction (~4.2% CAGR) Premium device design and end demand Brand roadmap access, specification stability and traceability
Europe Third (~15%) Contraction (~4.8% CAGR) Optics research and demanding imaging buyers Coating quality, technical cooperation and environmental standards
South America Fourth (~5%) Contraction (~4.2% CAGR) Affordable handset distribution Imported bill of materials, duty structure and retail affordability
Middle East & Africa Fifth (~3%) Contraction (~4.0% CAGR) Replacement devices and selective high-end sales Price thresholds, service networks and channel inventory

Asia-Pacific LARGEST · ~60% SHARE

What keeps Asia-Pacific central to the mobile-camera lens value chain?

Asia-Pacific is assigned an estimated ~60% of lens revenue in 2025, and its modeled ~5.2% CAGR decline is connected to pricing and the balance between premium and low-cost optics. The region still possesses a dense network of precision molding facilities, image testing stations and module assembly partners. China provides substantial manufacturing scale, Taiwan contributes established optical design and component expertise, and Japan and South Korea influence camera specifications through image sensors and leading handset brands.

Market positionLargest (~60% share)
Growth outlookDeclining (~5.2% CAGR)
Demand profileOptical assembly hub
Market access gateYield qualification
Country Position in region What drives demand
China Manufacturing center Chinese equipment and optics manufacturers support multiple stages of the smartphone-camera chain, from optical molds to integration and validation. Their opportunity is affected by camera counts on 2025 and 2026 phone introductions, while low-cost models can exert considerable price pressure. Suppliers serving more than one handset brand need flexible tooling and reliable photographic test equipment to manage changing focal lengths without extensive scrap during production transfers.
Taiwan Precision optics Taiwan has a longstanding cluster of lens design, polymer optical processing and high-resolution quality control, with providers serving premium phone projects as well as industrial imaging. A single 7P lens design can require multiple development loops before ramp, making engineering responsiveness a selling point in addition to price. Taiwan-linked suppliers may therefore remain technically important even when a handset is finally assembled in another economy.
Japan Imaging technology Japanese companies contribute mobile imaging sensor design, coatings technology and specialist optoelectronic materials. Sony Semiconductor Solutions announced a 200MP mobile sensor in November 2025, an adjacent development that increases pressure on lens performance without representing direct lens sales. Japanese quality practices affect how surface errors, flare and temperature behavior are tested in high-end camera optical groups, particularly when large sensors require sharp corners.
South Korea Brand specifications South Korea contributes demand through smartphone design organizations and their supplier qualification programs. Samsung announced the Galaxy S26 family in 2026 with advanced imaging specifications, indicating continued investment in computational and high-resolution cameras. Camera module and lens partners still face commercial trade-offs because adding a high-performance camera can increase cost just as mainstream buyers become more sensitive to handset prices.
India Device assembly Indian handset assembly and component-localization initiatives are relevant to camera optics because brand procurement can eventually establish regional qualification and shipping routines. Government announcements during 2025 addressed domestic electronics-component investment, but optics tooling remains a demanding specialization. India is therefore a developing integration and customer-access market rather than evidence that high-precision lens production has already shifted in full from the established east Asian clusters.

Market instances

  • A 200MP sensor raises lens-resolution requirements. Sony Semiconductor Solutions detailed a new 200MP mobile sensor in November 2025. That launch was an image-sensor development, not a value estimate for smartphone lens sets. It matters because higher sensor sampling can make corner blur and imperfect coatings more noticeable, requiring tighter control of lens manufacturing processes. Optical suppliers that cannot consistently reproduce high modulation transfer across a production batch may have difficulty winning premium assembly qualifications.
  • Manufacturing investment does not automatically deliver optical yield. India publicized additional electronics-component manufacturing investments in August 2025, creating a potential route for deeper device supply networks. Smartphone optics require precision molds, high-volume inspection and stable clean processing in addition to factory buildings, however. For lens suppliers the relevant development is the gradual formation of qualified local production teams, not a claim that every announced electronics project includes high-element-count camera lens fabrication.
In the full report: country-level revenue assumptions, producer and integrator roles, lens construction demand and front-versus-rear camera application splits for China, Taiwan, Japan, South Korea and India.

North America SECOND · ~17% SHARE

How does North American product strategy affect global optical lens demand?

North America represents an estimated ~17% of lens market value in 2025 and follows a modeled ~4.2% CAGR decline in the base outlook. Its importance comes from consumer device brands, camera product specifications, and the propensity to purchase premium smartphones rather than from local mass production of small plastic lens stacks. When a handset design team specifies a larger sensor or different optical zoom, suppliers worldwide must revise the relevant components even if final assembly takes place far from the buyer.

Market positionSecond (~17% share)
Growth outlookDeclining (~4.2% CAGR)
Demand profilePremium design influence
Market access gateRoadmap qualification
Country Position in region What drives demand
United States Premium device buyers The United States is a major destination for high-priced smartphones and the location of important camera system design decisions. Apple described new iPhone 17 Pro imaging configurations in September 2025, including sophisticated telephoto capability. Each physical camera path can require a separate refractive optical group, although the complete module carries additional sensor and actuator value that must not be folded into a lens-only market total.
Canada Established replacement Canadian demand is linked to replacement cycles, carrier promotions and the relative cost of premium phones against monthly service spending. A consumer upgrading to a three-camera device increases camera-lens sockets relative to an inexpensive single-camera handset, but remaining with the existing phone delays all lens orders. Lens assemblers do not usually invoice Canadian end consumers; the national allocation is a way to relate global component consumption to handset destinations.
Mexico Integrated electronics Mexico participates in wider North American electronics supply and phone distribution, supporting demand for camera systems in several price classes. The commercial focus is landed unit cost and availability rather than local discovery of new plastic optical designs. A change in customs treatment or currency can shift device choice toward budget handsets, changing the mix between simpler selfie optics and more involved rear lenses purchased upstream by factories elsewhere.

Market instances

  • Apple refreshed premium camera optics in 2025. The September 2025 announcement of iPhone 17 Pro and Pro Max emphasized computational photography and high-resolution multi-camera hardware. This is a device introduction, not a directly disclosed value for its independent lens suppliers. For component manufacturers the commercial implication is tighter specification management and multiple optical paths per phone, together with a risk that a delayed or revised premium launch disrupts specialized lens tooling utilization.
  • A mainstream model can set a different optical ceiling. Apple also presented the standard iPhone 17 in September 2025, reinforcing that camera architecture can vary within the same product family. The price difference between a mainstream and a premium configuration can determine whether an additional optical path is commercially justified. Lens manufacturers should therefore analyze order books by specific model and camera function, rather than converting overall smartphone shipments directly into high-end lens revenue.
In the full report: country-level device-class demand, camera optical specifications and procurement implications for the United States, Canada and Mexico.

Europe THIRD · ~15% SHARE

Why does European influence extend beyond regional smartphone assembly?

Europe holds an estimated ~15% market share in 2025 and a modeled ~4.8% CAGR decline over the comparison window. It contributes optical engineering partnerships, coating expertise and buyers who scrutinize camera quality in expensive devices. Many lens stacks supplied into European phones are manufactured in Asia, but a supplier that works with European optical specialists may differentiate its production through light transmission, stray-light suppression and demanding photographic validation rather than through bare element counts.

Market positionThird (~15% share)
Growth outlookDeclining (~4.8% CAGR)
Demand profileOptical R&D influence
Market access gateImage-quality testing
Country Position in region What drives demand
Germany Optical engineering Germany is important as a source of precision optics expertise and coatings knowledge. ZEISS renewed its mobile imaging cooperation with vivo in August 2025, demonstrating how a European optics brand can help shape products assembled and sold globally. Such collaborations may influence the required performance of lens surfaces and coatings, but they do not indicate that all physical lenses are produced within Germany or that consulting fees equal lens shipment revenue.
United Kingdom Premium consumption United Kingdom handset demand is concentrated in a competitive retail market where consumers weigh photography capability against monthly affordability. A broad economic slowdown can extend upgrade intervals even if new devices offer better 5x or 10x zoom results. Suppliers of lens assemblies experience this as shifting camera orders placed upstream, so regional market estimates should not be mistaken for component deliveries into British optical factories.
France Photography-led buying French consumers evaluate mobile cameras for low-light pictures, portraits and video, encouraging phone makers to feature improved imaging at several retail price levels. More complex optics can boost the value of a limited premium device program, yet a large base of repaired or retained handsets reduces fresh parts consumption. The French demand pool is chiefly a downstream channel signal rather than a major center of smartphone lens molding.
Italy Distribution mix Italian retail offerings combine entry-level devices with premium branded phones, producing variable demand for front and rear camera assemblies. When the low-priced category gains share, a supplier may lose sales of specialized telephoto groups even if total handset units remain relatively steady. Exchange rates and dealer inventory also affect when a manufacturer replenishes optics, adding timing volatility to component revenue recognized in the production region.

Market instances

  • ZEISS extended its vivo imaging work. The ZEISS and vivo partnership update in August 2025 described continuing joint activity in mobile photography and optical imaging. The cooperation illustrates the role of optical design know-how in improving the performance of smartphone cameras, particularly where small geometry magnifies stray-light and color-fringing problems. Commercially it supports selective differentiation for specialist optical suppliers, while remaining distinct from a reported sale volume for molded phone lenses.
  • Coating science changes the value of a lens group. ZEISS documentation for mobile imaging highlights optical design and coating considerations aimed at photographs that are sharp, consistent and resistant to unwanted reflections. This means two apparently similar 7P assemblies can carry different engineering and inspection burdens. For equipment buyers the useful distinction is reproducible optical quality, not simply whether the vendor lists the same number of plastic elements on a specification sheet.
In the full report: premium smartphone channel demand, optical quality benchmarks and component-specification relationships across Germany, the United Kingdom, France and Italy.

South America FOURTH · ~5% SHARE

What determines camera-lens demand across South American device channels?

South America is modeled at ~5% of 2025 market value with a ~4.2% CAGR contraction in the forecast. Handset affordability and imported finished-device availability are more influential than local concentration of high-precision optical molding. Consumers often compare camera claims across brands while maintaining strict budget limits, and that tension can push manufacturers to prioritize a stronger primary camera over several lower-value auxiliary lenses, altering component spend per shipped device.

Market positionFourth (~5% share)
Growth outlookDeclining (~4.2% CAGR)
Demand profileImported device mix
Market access gateAffordability
Country Position in region What drives demand
Brazil Largest channel Brazilian smartphone purchasers face currency, import and retail-financing considerations that can shift camera-device mix between quarters. A handset with more rear cameras requires a greater number of separately specified optical groups, but the consumer decision depends on the complete device price rather than lens count alone. Component manufacturing is normally contracted by global brands, so the national lens value is analytically associated with phones distributed in Brazil.
Argentina Price-sensitive mix Argentina presents a device market in which price changes can significantly influence the timing of replacements and the popularity of inexpensive camera configurations. For upstream lens suppliers, an extended device holding period reduces both primary and selfie lens demand irrespective of improvement in lens manufacturing capability. A premium import segment can still support multiple optical paths, but its volume is too small to reverse the entire regional trend by itself.
Chile Premium niche Chile contains a comparatively affluent premium smartphone niche within a much smaller device market. Flagship purchases can support high-performance rear camera optical groups even as mainstream buyers seek cheaper handsets. The actual sale of those optical groups generally occurs through Asian component and module contracts; attributing demand to Chile is intended to map the destination of the finished camera-equipped phone, not the place of the component invoice.

Market instances

  • Imported phones transmit component pricing pressure. Brazilian handset channels combine global brand portfolios with changing tax and exchange-rate conditions. When imported-device economics deteriorate, retailers can promote older phone models or lower-specification configurations rather than absorbing the entire price increase. Lens producers then see orders concentrated in established designs where tooling investment was already recovered, while speculative high-element-count camera programs become less attractive to handset procurement teams.
  • The low-price camera trade-off is structural. A phone vendor serving Argentina or other cost-sensitive South American markets can add perceived photography value through processing software while retaining a simpler optical design. This substitution matters to lens suppliers because the improvement is not necessarily accompanied by more refractive elements or an additional lens socket. As a result, device marketing claims should not be treated as a direct indicator of optical-assembly revenue growth.
In the full report: handset distribution dynamics, front and rear optical content, retail affordability and trade-linked procurement exposure for Brazil, Argentina and Chile.

Middle East & Africa FIFTH · ~3% SHARE

Where is the remaining smartphone-lens demand concentrated?

The Middle East and Africa represent an estimated ~3% of 2025 component market value, with a modeled decline near ~4.0% CAGR under this value-based scenario. Higher-income Gulf buyers may select phones with several complex camera paths, while large parts of Africa remain particularly sensitive to entry-device pricing. Physical lens orders are generally upstream of these markets, making smartphone category choice, repair activity and replacement frequency the relevant links to global component consumption.

Market positionFifth (~3% share)
Growth outlookDeclining (~4.0% CAGR)
Demand profileMixed phone tiers
Market access gateChannel reach
Country Position in region What drives demand
United Arab Emirates High-end demand The United Arab Emirates has a visible premium phone category in which advanced optical zoom and imaging partnerships can influence consumer choice. High specification does not mean that the phone lens group is produced locally; suppliers are selected earlier through global brand qualification. The regional lens spend attributable to those devices depends on mix and replacement timing, which can change when a brand moves an expensive telephoto solution between flagship models.
Saudi Arabia Premium replacement Saudi Arabia combines a strong premium smartphone segment with a broad market for established device configurations. Consumers selecting a flagship can support several rear optical groups, while budget buyers may prioritize storage capacity and battery life ahead of an additional camera. Camera assembly manufacturers therefore face a heterogeneous demand signal that depends on specific handset families rather than the total number of mobile connections in the country.
South Africa Affordability constrained South African purchasing decisions are shaped by the affordability of handsets and mobile service, creating pressure to extend ownership periods or select inexpensive phones. These buying conditions tend to favor simpler front cameras and established rear optical designs. More ambitious lens stacks remain present in high-end devices but represent a niche, and the market cannot be mapped from consumer camera advertising directly into the sales revenue of precision lens manufacturers.

Market instances

  • Premium models can sustain specialty optics. Gulf retail channels carry devices with telephoto and wide-angle imaging systems similar to those sold in major Asian and American markets. A relatively small volume of these phones can support advanced optical design work, but high manufacturing cost and dependence on particular brand programs limit broad-based growth. Suppliers need to separate premium camera-lens revenue from the far larger value of the whole high-priced handset.
  • Longer device lifetimes delay component orders. In several African countries a consumer may purchase a refurbished phone or use an existing one for an additional year rather than buy a new model. That behavior affects lens producers even when end-user demand for photography remains strong. A second-hand transaction does not usually require a new factory-built camera lens group, so handset ownership and new optical component demand should be modeled with separate denominators.
In the full report: country channel assumptions, handset affordability effects, and high-end versus entry camera lens mix for the UAE, Saudi Arabia and South Africa.

Key Optical Lens Manufacturers and Competitive Landscape

Competition in smartphone camera lens assemblies is concentrated among specialist firms with mature tooling, high-precision plastics molding and repeated camera-system qualification experience. Sunny Optical, Largan Precision and AAC Technologies are important participants, while Ofilm has documented work in advanced plastic and periscope solutions. A supplier must win a design-in before commercial handset launch, then maintain acceptable photographic performance while manufacturing millions of small optical parts within a narrow price agreement.

Large camera lens programs are not won solely through quoted piece price. Camera module assemblers and handset engineering teams assess tolerance stability, batch-to-batch contrast, coating defects and whether the supplier can correct manufacturing excursions before a public device announcement. As a result, an established producer with a working mold library and experienced application engineers can retain an advantage over new entrants whose nominal optical design appears equivalent on paper.

Sunny Optical publishes optical-product and handset lens shipment information, giving investors insight into a business with exposure to the wider camera component market. AAC Technologies disclosed investment in high-end lenses, seven-element construction and hybrid glass-plastic processes in its 2025 annual report. These disclosures support the direction of technical investment but do not establish a combined market share for the entire category without consistent lens-only revenue boundaries.

Ofilm presents an additional source of optical engineering capability, including seven-element and folded telephoto designs, but a vendor profile must distinguish lens production from complete module integration and other group activities. Likewise, Sony produces mobile image sensors and ZEISS contributes optical know-how and branding partnerships; neither is automatically an independent high-volume plastic lens supplier simply because its technology is visible in a smartphone camera.

Smaller producers can compete where a customer needs a specialized material combination, limited-volume lens geometry or production close to a particular assembly plant. Their obstacle is that qualification can consume several prototype rounds without a guaranteed mass-production award. Conversely, major suppliers face concentrated buying power: a few handset manufacturers and camera module companies may account for substantial orders, making revenue sensitive to a shift of one platform between vendors.

Tier structure

Tier Companies Basis of competition
Major lens specialists Sunny Optical Technology, Largan Precision, AAC Technologies Established lens design and manufacturing capabilities, high-volume precision processing, broad camera specifications and close supplier qualification with global handset customers.
Advanced module and optics participants Ofilm Group, Cowell e Holdings, Truly International Camera module integration and selected optics development, with capabilities and reporting boundaries differing by company. Complete module revenue is not counted as lens revenue.
Optics and sensor ecosystem ZEISS, Sony Semiconductor Solutions, Apple, Samsung Electronics Participants that influence mobile imaging specifications or sell adjacent products rather than necessarily supplying independent finished lens assemblies to third parties.

Key companies profiled

  • Sunny Optical Technology (China)
  • Largan Precision (Taiwan)
  • AAC Technologies (China)
  • Ofilm Group (China)
  • Cowell e Holdings (China)
  • Truly International (Hong Kong)
  • ZEISS (Germany, optical technology partner)
  • Sony Semiconductor Solutions (Japan, image sensors)
  • Apple (United States, handset specification)
  • Samsung Electronics (South Korea, handset specification)

Optical Lens for Mobile Phone Production Capacity Analysis

The main constraint on smartphone lens capacity is not the number of generic injection-molding machines but the availability of qualified optical tooling, clean handling, coating processes and inspection systems. A producer may possess ample nominal machinery yet achieve poor usable output on an unfamiliar high-element-count design. New camera geometries also require expensive mold adjustment, alignment work and repeat sampling before the buyer will accept full-speed commercial shipments.

Precision plastic optics production starts with optical-grade resin selection and metal molds capable of reproducing aspherical profiles at tiny dimensions. Each lens piece is cleaned, coated where specified and assembled in a barrel using alignment procedures that control decentering and tilt. High-volume plants deploy automated metrology, but sensitive optical assemblies still need careful management of particles, thermal drift and equipment maintenance to achieve yields that justify customer target prices.

A lens with more optical surfaces can correct demanding aberrations, but the additional pieces also multiply opportunities for defects and tolerance accumulation. Moving from a 6P construction to a 7P or 8P program is therefore not a simple percentage increase in output per mold. The supplier may need new tools, revised adhesives and a more exact inspection sequence, and these investments can become stranded if the handset model is canceled before its originally planned production ramp.

Glass-plastic hybrids and folded camera routes introduce distinct supply requirements. Glass forming and optical polishing may involve different temperatures and surface treatments from all-plastic molding, and a micro-prism may be procured through an additional specialist. AAC Technologies has publicly discussed this movement toward hybrid solutions. The commercial implication is that value can migrate toward precision processes even as total handset lens revenue experiences downward pressure from mass-market price cuts.

Capacity planning also depends on the number of camera positions per phone and the range of designs requested by the same brand. Multiple variants increase the supplier burden for inventory, spare molds and long-term engineering support. When replacement cycles lengthen, a lens factory may keep qualified lines ready but run them below their practical ceiling, raising depreciation per accepted set and creating incentives to bid more aggressively for remaining purchase orders.

Optical Lens for Mobile Phone Market Dynamics: Drivers, Restraints and Opportunities

Premium camera engineering, multi-lens hardware and advances in optical materials support incremental value per selected device. These benefits are outweighed in the base scenario by cheaper component pricing, cautious upgrade behavior and handset makers reducing lower-value camera content. The negative outlook is a revenue model for this defined optical product, not a statement that every lens technology, camera specification or mobile device shipment category will shrink at the same rate.

MARKET DRIVERS

Drivers Impact Analysis*

Market Drivers Impact Rank CAGR Contribution (%) 2026–2028 2029–2031 2032–2034
Flagship camera complexity and demanding optical resolution High +1.20% High High High
More rear imaging paths in selected premium devices Medium-High +0.85% High Medium Medium
Glass-plastic hybrid and folded-camera design wins Medium +0.65% Medium High High
Higher lens manufacturing yield and coating value Low-Medium +0.50% Medium Medium High
Others (better mobile video and portrait image quality) Low +0.40% Medium Medium Low

Premium optics increase the value of qualified designs

Smartphone brands competing on photography still need effective optical resolution, low flare and reliable color correction. A flagship camera with a large sensor or complex zoom arrangement can require more demanding lens surfaces than a basic phone camera. This raises the value of certain approved designs, but those specialized programs represent a selected part of the market and are not sufficient by themselves to offset a decline across the larger pool of inexpensive lenses.

Additional rear imaging paths support component content

A phone carrying primary wide, ultra-wide and telephoto cameras uses separate lens assemblies even when the design team presents them as one imaging system to customers. This architecture raises potential lenses per handset relative to a simpler one-camera product. However, adoption varies sharply by price tier, and some vendors may remove auxiliary modules to preserve margins when processor, memory and display costs rise, limiting the broad market effect.

Hybrid constructions offer a technical premium

A mixed glass-and-plastic optical group may solve design requirements involving refractive behavior, thickness or environmental stability that are difficult for an all-plastic assembly. The additional process complexity can support a higher selling price for a qualified vendor. It also imposes costs for glass shaping, surface treatment and material matching, so the commercial benefit depends on reliable production yield and successful integration with the module maker.

Precision tooling can improve accepted output

Factory metrology and molding process improvements help a lens producer deliver more conforming components from each run, reducing defects, rework and customer complaints. Optical inspection becomes more valuable as apertures expand and camera sensors demand sharper edge performance. Increased yield improves the supplier economics of meeting a rigid contract price, although lower manufacturing costs can also translate into lower future selling prices when powerful handset buyers renegotiate agreements.

Image-led device launches preserve specialist demand

Mobile photography remains a visible product differentiation tool, particularly for portrait, telephoto and video capabilities. Marketing emphasis creates a reason for premium brands to invest in engineering and optical qualification even when many consumers keep older phones longer. A successful new camera feature can justify a specific higher-value lens group, but its influence should be assigned to that program rather than multiplied indiscriminately across all phones and all camera positions.

MARKET RESTRAINTS

Restraints Impact Analysis*

Market Restraints Impact Rank CAGR Contribution (%) 2026–2028 2029–2031 2032–2034
Selling-price pressure in mainstream optical assemblies High -3.10% High High Medium
Slower smartphone replacement and unit demand Medium-High -2.40% High Medium High
Reduced secondary cameras in cost-constrained phones Medium -1.80% High Medium Medium
Others (customer concentration, tooling risk and yield volatility) Low -1.20% Medium Medium Low
*CAGR contribution shows the percentage points each factor adds to or removes from the forecast CAGR for 2026–2034; driver contributions less restraint contributions equal the market CAGR. Period columns rate the strength of each factor in that window.

Price compression overwhelms some quality gains

A large share of phone lens procurement involves price-based competition for established plastic optical designs. Handset brands expect supplier productivity gains and may transfer contracts to alternative qualified producers after an initial program matures. As older cameras become standard across lower-priced products, the revenue captured for each assembly can fall more rapidly than optical production units change, producing a negative market value trajectory even where camera technology advances.

Consumers extend the handset replacement interval

An optical lens producer ultimately depends on a newly manufactured phone rather than on how often a current owner takes photographs. When buyers delay upgrades, repair a device or choose a refurbished model, existing camera lenses stay in service without generating another factory order. Slower unit replacement can therefore reduce demand across front and rear optical types, with the strongest impact on suppliers concentrated in mass-market models.

Cost-sensitive models can lose a lens socket

Camera specifications are a discretionary part of a low-priced phone bill of materials. A brand facing higher costs for memory, processors or screens may preserve a credible main camera but simplify the auxiliary imaging channels. Removing one secondary camera eliminates an associated lens assembly entirely rather than merely reducing its price, which is why the count of image sensors and optical paths should be monitored separately from nominal handset shipments.

Program concentration can strand specialized tools

The manufacturing process for a particular smartphone lens can require a customer-specific optical mold, barrel and elaborate image-quality inspection recipe. If that phone underperforms or the brand switches module suppliers, investment in the dedicated tooling may not be recoverable from another model. Contract concentration and variable first-pass yields create a meaningful restraint even for producers that retain strong optical engineering teams.

MARKET OPPORTUNITIES

Advanced telephoto assemblies favor specialist suppliers

Folded light paths and long-range imaging need careful alignment of refractive optics and sometimes glass or prism elements, creating opportunities for firms able to qualify complicated assemblies. The purchase volume is limited to products in which a brand can support additional camera cost. Suppliers that document yield, environmental reliability and optical consistency can defend a premium more credibly than vendors selling ordinary lens designs on element count alone.

New sensor formats generate redesign work

Sony and other imaging semiconductor vendors continue introducing mobile sensors with new performance characteristics, including large-resolution and high-dynamic-range devices. A change in sensor area or pixel density can lead the handset maker to commission a revised optical group, creating design opportunities for lens manufacturers. Sensor announcements are contextual technology signals, however, and must not be treated as completed lens orders until a brand qualifies the matching assembly.

Localized component ecosystems create another route to customers

Electronics manufacturing investments in countries such as India can make regional camera module integration more attractive. Qualified lens suppliers may serve these facilities through local logistics, engineering support and eventually selected processing steps. The opportunity depends on developing actual optical molding and inspection competence, since the presence of handset final assembly alone does not guarantee that difficult high-element-count lenses can be manufactured at acceptable yields nearby.

Optical Lens for Mobile Phone Supply Chain Analysis

The mobile lens chain begins with optical-grade plastics, glass and precision mold fabrication, then passes through individual element processing, coating, barrel alignment and camera-module integration. Several different companies may supply a phone camera, and only the finished optical lens group is included in the present value boundary. Sensor chips, stabilization hardware and completed phones are adjacent products whose performance requirements or buying cycles can influence lens demand.

MaterialsOptical polymers, specialty glass, anti-reflective coatings and precision mold inserts
Lens fabricationAspherical molding, cleaning, surface coating, barrel assembly and image quality inspection
Module integrationLens alignment with image sensors, actuators and stabilizing systems, followed by qualification
Handset customersModel-specific camera design approval, volume purchase agreements, inventory planning and replacement demand

Materials. An optical polymer needs predictable refractive properties and consistent molding performance, while glass adds different thermal and mechanical requirements. Coating quality influences glare, transmission and reflections that can degrade images in bright conditions. Material procurement is only one piece of the component value, because the exact curvature of a molded surface and its integration into the optical barrel often determine whether a lens assembly passes the demanding customer qualification test.

Lens fabrication. Factory operations convert a design into several matched optical elements and a mechanically stable assembly. Quality is controlled through surface measurements, contamination management and camera-oriented imaging tests. High-volume processes depend on reliable injection tools and optical metrology rather than on generic plastics capacity alone. When lens specifications are upgraded, the manufacturing cost can rise well before a supplier receives confirmed commercial orders from the handset brand.

Module integration. Camera module suppliers position the finished lens group alongside a CMOS image sensor and appropriate actuator systems. Tolerances at this stage affect focus and image consistency, and a lens that passed standalone optical measurements may still need adjustment when integrated with a specific sensor platform. The completed module has a broader revenue boundary than the lens itself, so sales by integrators should be separated from the optical-component allocation to avoid double counting.

Handset procurement. Smartphone design groups establish a target camera performance and then qualify parts through repeated testing and manufacturing trials. Once a design launches, the price schedule, approved supplier mix and the number of phones produced determine orders. A major model revision can quickly redirect demand away from an older lens even while the factory retains usable equipment, making program risk and customer concentration important features of the upstream market.

Recent Developments in Optical Lens for Mobile Phone Technology

  • 28 October 2026 Announced
    Sony Semiconductor Solutions introduced the LYTIA 720 mobile imaging sensor with new high-dynamic-range capabilities. Although the announcement concerns a sensor rather than a lens assembly, it establishes a potential new specification path for optical designers. Lens suppliers seeking future design wins must ensure their refractive groups support sensor resolution, light throughput and edge quality without forcing handset makers to accept excessive camera thickness. Source
  • 2026 Introduced
    Samsung presented the Galaxy S26 family with an emphasis on mobile imaging and artificial intelligence features. These handsets illustrate how camera hardware remains part of premium-device differentiation even during a cost-sensitive market period. For optics suppliers, the implication is model-specific lens qualification and high-resolution camera requirements; Samsung did not disclose independent lens assembly revenue in the product announcement. Source
  • April 2026 Published
    AAC Technologies released its 2025 annual report describing higher-end lens development, seven-element optical structures and hybrid glass-plastic technology. The document shows a supplier expanding optical manufacturing capability beyond elementary plastic stacks. These advances may help premium camera lens value, but group financial results contain other activities and should not be equated with the defined global market for finished smartphone refractive lens groups. Source
  • 2026 Filed
    Ofilm Group annual reporting described high-element-count mobile lens capabilities and work associated with folded or periscope imaging systems. The disclosure provides evidence that sophisticated phone optics remain a development priority among Asian camera suppliers. Commercial impact depends on customer qualification and production yields, however, so a product roadmap cannot be turned into a confirmed global revenue figure for any lens category. Source
  • 27 November 2025 Announced
    Sony Semiconductor Solutions announced a 200-megapixel mobile image sensor, emphasizing advances in high-resolution image capture. A device designer selecting such a sensor must also evaluate compatible optical resolution and the behavior of a lens across the whole imaging area. The event is a relevant demand signal for precision lenses but is not proof that shipments of plastic camera lens assemblies increased during that month. Source
  • September 2025 Introduced
    Apple introduced iPhone 17 Pro and Pro Max with premium multi-camera specifications and advanced telephoto capability. Different fields of view and optical routes require different lens group designs within a single phone family. The introduction is evidence of sophisticated consumer imaging requirements, while the value captured by an optical component provider still depends on its actual supplier contract, yields and production volumes. Source
  • September 2025 Introduced
    Apple announced the standard iPhone 17 with revised imaging features for a mainstream premium consumer category. This comparison with the professional models shows that one brand may operate several camera optical bills of materials at once. For suppliers the relevant implication is that element counts, camera position and approved lens designs should be forecast by model rather than assumed identical across a product launch. Source
  • August 2025 Extended
    ZEISS renewed its mobile imaging partnership with vivo, connecting optical design knowledge with new smartphone camera development. The cooperation highlights the importance of coatings, aberration correction and photographic system tuning in devices produced within Asia. A partnership announcement does not specify lens plant utilization or a transfer of independent lens revenue, but it strengthens the case for optical expertise as a product differentiation factor. Source
  • August 2025 Reported
    India publicized government-supported manufacturing investments across electronics components, including supply categories that could support more localized device ecosystems. High-performance phone camera lenses require a specialist process base beyond ordinary final assembly, but a deeper regional component network may eventually support new integration and supplier service arrangements. The importance of this development lies in potential sourcing diversification, not an assumed current national share of precision optics. Source
  • June 2025 Announced
    Sony Semiconductor Solutions introduced a mobile sensor designed for high dynamic range, creating another reason for camera engineering teams to revisit optical performance. A lens that produces excessive flare or vignetting can limit the useful capabilities of a sophisticated electronic sensor. This adjacent sensor announcement is best understood as a driver of component design revisions rather than as a shipment figure for completed smartphone lens groups. Source

REPORT SCOPE & SEGMENTATION

Attribute Details
Study Period 2020–2034
Base Year 2025
Estimated Year 2026
Forecast Period 2026–2034
Historical Period 2020–2024
Market Size 2025 USD 2,792.4 million
Estimated Size 2026 USD 2,656.7 million
Market Size 2034 USD 1,783.5 million
Growth Rate CAGR of -4.9% from 2026–2034
Measurement Value (USD Million) and optical lens assembly shipments
Segmentation By Type, By Application, and By Region
By Type Below 5P · 6P–8P · 9P–10P · 10P Above
By Application Front Lens · Rear Lens
By Region Each region analyzed by type, application and key end-market countries
North AmericaUnited States, Canada, Mexico
EuropeGermany, United Kingdom, France, Italy, Rest of Europe
Asia-PacificChina, Taiwan, Japan, South Korea, India, Rest of Asia-Pacific
South AmericaBrazil, Argentina, Chile, Rest of South America
Middle East & AfricaUAE, Saudi Arabia, South Africa, Rest of Middle East and Africa
Key Companies Profiled Sunny Optical Technology, Largan Precision, AAC Technologies, Ofilm Group, Cowell e Holdings, Truly International; ecosystem context: ZEISS, Sony Semiconductor Solutions, Apple and Samsung
Customization Scope Additional country breakdowns, optical construction comparisons and camera position analysis can be scoped according to specific client needs.

Frequently Asked Questions

How large is the optical lens for mobile phone market?

Lens assemblies used in mobile cameras are modeled at USD 2,792.4 million in 2025, with a forecast of USD 1,783.5 million in 2034 and a -4.9% CAGR across 2026–2034. The decline is a value trend for the optical components, reflecting mainstream selling-price reductions and cautious device replacement, rather than evidence that high-end imaging performance will deteriorate or that all smartphone classes will follow the same path.

What exactly is counted as a phone optical lens?

The product consists of the compact refractive lens group and associated mechanical optical assembly fitted into a front or rear handset camera. It contains designed plastic or hybrid optical elements rather than the electronic sensor that records the image. A complete camera module additionally includes other assemblies, which can have substantial value; those parts and the finished phone must be excluded to keep the lens market boundary consistent.

Which optical constructions make up the type segmentation?

Four element-count categories are considered: Below 5P, 6P–8P, 9P–10P and 10P Above. The middle group represents an estimated ~68% of 2025 market value because numerous mainstream wide-camera designs use that range. The simpler class is exposed to aggressive procurement savings, while high-element-count solutions appear primarily in imaging programs that can tolerate additional manufacturing complexity and cost.

How are front camera and rear camera lens demand different?

Rear lenses are assigned about ~76% of the market because one smartphone may contain main, ultra-wide and telephoto camera optical groups. Front optics, at ~24%, usually optimize selfie and video-call performance within a smaller physical space. Camera position is therefore a component purchasing classification, not a measure of how frequently the phone owner takes photographs using one camera or another.

Which geography accounts for the largest share?

Asia-Pacific leads with an estimated ~60% share of 2025 component value, reflecting precision optics supply clusters and proximity to camera module manufacturing. North America follows at ~17%, Europe accounts for ~15%, South America ~5% and the Middle East and Africa ~3%. The modeled split is designed to relate purchasing and production ecosystems without counting every overseas movement of the same lens as a separate sale.

Why can market value decline despite improving cameras?

Camera quality can improve at the same time as the number of newly purchased handsets falls or the prices of common optical groups decrease. Buyers also negotiate component discounts once production of a popular design becomes stable. A few expensive telephoto lenses cannot automatically outweigh millions of lower-priced mainstream assemblies, which explains how a downward revenue forecast can coexist with progress in sensor resolution and optical correction.

Which companies are most relevant to production?

Major specialist suppliers include Sunny Optical, Largan Precision and AAC Technologies, with Ofilm and other camera businesses contributing selected technologies or integration capabilities. A component supplier is best evaluated through qualified lens output rather than the size of an entire camera module business. ZEISS, Sony and leading handset brands influence design specifications, but their adjacent activities must not be mistaken for identical lens manufacturing roles.

What factors could improve the forecast?

Higher adoption of complicated rear camera arrangements, successful glass-plastic hybrid constructions and strong premium smartphone upgrade activity could raise component value. Sustained manufacturing yield improvements may also help suppliers serve demanding optical specifications profitably. These opportunities should be tested against actual phone models and lens contracts, since camera promotions and a new image sensor alone do not establish an industry-wide uplift in optical assembly shipments.

What are the central production risks?

Optical mold accuracy, surface contamination, coating defects and the consistency of barrel alignment all affect accepted output. A phone brand can modify or terminate its imaging program after a supplier has invested in dedicated tooling, leaving the producer with underutilized equipment. Lens manufacturing is therefore exposed both to process yield and to customer model concentration, even where demand for premium photography remains visible.

What period and categories does the study cover?

The base year is 2025, with 2026 used for estimates and 2034 as the forecast endpoint; historical context extends across 2020–2024. Two publisher type and application axes are used, supported by analysis across five international regions and key national markets. This lens-only boundary distinguishes refractive camera components from sensors, imaging software, completed camera modules and full mobile handsets.

Research Sources & Evidence Base

View research sources used for this overview
  1. Sunny Optical Technology. Investor relations annual and interim disclosures, Company filings and precision optical component manufacturing updates.
  2. Sunny Optical Technology. 2025 annual results, Shipment and production context for optical products, distinct from the industry market total.
  3. AAC Technologies. Annual Report 2025, Development of high-resolution mobile lenses, glass-plastic constructions and related processes.
  4. Ofilm Group. 2025 reporting, Documented capabilities in high-element-count and specialized camera optics.
  5. Apple. iPhone 17 Pro launch, Premium smartphone camera specifications and telephoto applications.
  6. Apple. iPhone 17 launch, Mainstream camera architecture and optical imaging features.
  7. Samsung. Galaxy S26 launch, High-resolution smartphone camera configurations and customer product roadmap.
  8. OPPO. Find X8 specifications, Specific front and rear lens configurations and glass-plastic telephoto specifications.
  9. Xiaomi. Xiaomi 15 Ultra specifications, Multiple camera optical paths, telephoto and imaging partner design examples.
  10. Xiaomi. 2025 device launch, Camera optics and premium photography positioning.
  11. ZEISS. vivo imaging cooperation, European optical engineering partnership relevant to camera quality.
  12. ZEISS. Mobile imaging technologies, Coatings, imaging performance and optical design objectives.
  13. Sony Semiconductor Solutions. 200MP sensor release, Adjacent high-resolution imaging demand and lens requirements.
  14. Sony Semiconductor Solutions. LYT-828 sensor announcement, High-dynamic-range mobile imaging context.
  15. Sony Semiconductor Solutions. LYTIA 720 sensor announcement, New mobile sensor roadmap and potential optics design requirements.
  16. Press Information Bureau of India. Electronics component manufacturing investment, Potential regional manufacturing ecosystems; not direct phone lens revenue.
Optical Lens for Mobile Phone Market Size Size, Share and Industry Analysis, 2026–2034

Get Sample Report PDF for Exclusive Insights

Report Sample Includes

  • Table of Contents
  • List of Tables & Figures
  • Charts, Research Methodology, and more...

PDF Icon Download Sample Report PDF

Download Sample Report

Table of Content

1 Introduction to Research & Analysis Reports
1.1 Optical Lens for Mobile Phone Market Definition
1.2 Market Segments
1.2.1 Segment by Type
1.2.2 Segment by Application
1.3 Global Optical Lens for Mobile Phone Market Overview
1.4 Features & Benefits of This Report
1.5 Methodology & Sources of Information
1.5.1 Research Methodology
1.5.2 Research Process
1.5.3 Base Year
1.5.4 Report Assumptions & Caveats
2 Global Optical Lens for Mobile Phone Overall Market Size
2.1 Global Optical Lens for Mobile Phone Market Size: 2024 VS 2031
2.2 Global Optical Lens for Mobile Phone Market Size, Prospects & Forecasts: 2026-2034
2.3 Global Optical Lens for Mobile Phone Sales: 2026-2034
3 Company Landscape
3.1 Top Optical Lens for Mobile Phone Players in Global Market
3.2 Top Global Optical Lens for Mobile Phone Companies Ranked by Revenue
3.3 Global Optical Lens for Mobile Phone Revenue by Companies
3.4 Global Optical Lens for Mobile Phone Sales by Companies
3.5 Global Optical Lens for Mobile Phone Price by Manufacturer (2020-2025)
3.6 Top 3 and Top 5 Optical Lens for Mobile Phone Companies in Global Market, by Revenue in 2024
3.7 Global Manufacturers Optical Lens for Mobile Phone Product Type
3.8 Tier 1, Tier 2, and Tier 3 Optical Lens for Mobile Phone Players in Global Market
3.8.1 List of Global Tier 1 Optical Lens for Mobile Phone Companies
3.8.2 List of Global Tier 2 and Tier 3 Optical Lens for Mobile Phone Companies
4 Sights by Product
4.1 Overview
4.1.1 Segment by Type – Global Optical Lens for Mobile Phone Market Size Markets, 2024 & 2031
4.1.2 Below 5P
4.1.3 6P-8P
4.1.4 9P-10P
4.1.5 10P Above
4.2 Segment by Type – Global Optical Lens for Mobile Phone Revenue & Forecasts
4.2.1 Segment by Type – Global Optical Lens for Mobile Phone Revenue, 2020-2025
4.2.2 Segment by Type – Global Optical Lens for Mobile Phone Revenue, 2026-2031
4.2.3 Segment by Type – Global Optical Lens for Mobile Phone Revenue Market Share, 2026-2034
4.3 Segment by Type – Global Optical Lens for Mobile Phone Sales & Forecasts
4.3.1 Segment by Type – Global Optical Lens for Mobile Phone Sales, 2020-2025
4.3.2 Segment by Type – Global Optical Lens for Mobile Phone Sales, 2026-2031
4.3.3 Segment by Type – Global Optical Lens for Mobile Phone Sales Market Share, 2026-2034
4.4 Segment by Type – Global Optical Lens for Mobile Phone Price (Manufacturers Selling Prices), 2026-2034
5 Sights by Application
5.1 Overview
5.1.1 Segment by Application – Global Optical Lens for Mobile Phone Market Size, 2024 & 2031
5.1.2 Front Lens
5.1.3 Rear Lens
5.2 Segment by Application – Global Optical Lens for Mobile Phone Revenue & Forecasts
5.2.1 Segment by Application – Global Optical Lens for Mobile Phone Revenue, 2020-2025
5.2.2 Segment by Application – Global Optical Lens for Mobile Phone Revenue, 2026-2031
5.2.3 Segment by Application – Global Optical Lens for Mobile Phone Revenue Market Share, 2026-2034
5.3 Segment by Application – Global Optical Lens for Mobile Phone Sales & Forecasts
5.3.1 Segment by Application – Global Optical Lens for Mobile Phone Sales, 2020-2025
5.3.2 Segment by Application – Global Optical Lens for Mobile Phone Sales, 2026-2031
5.3.3 Segment by Application – Global Optical Lens for Mobile Phone Sales Market Share, 2026-2034
5.4 Segment by Application – Global Optical Lens for Mobile Phone Price (Manufacturers Selling Prices), 2026-2034
6 Sights by Region
6.1 By Region – Global Optical Lens for Mobile Phone Market Size, 2024 & 2031
6.2 By Region – Global Optical Lens for Mobile Phone Revenue & Forecasts
6.2.1 By Region – Global Optical Lens for Mobile Phone Revenue, 2020-2025
6.2.2 By Region – Global Optical Lens for Mobile Phone Revenue, 2026-2031
6.2.3 By Region – Global Optical Lens for Mobile Phone Revenue Market Share, 2026-2034
6.3 By Region – Global Optical Lens for Mobile Phone Sales & Forecasts
6.3.1 By Region – Global Optical Lens for Mobile Phone Sales, 2020-2025
6.3.2 By Region – Global Optical Lens for Mobile Phone Sales, 2026-2031
6.3.3 By Region – Global Optical Lens for Mobile Phone Sales Market Share, 2026-2034
6.4 North America
6.4.1 By Country – North America Optical Lens for Mobile Phone Revenue, 2026-2034
6.4.2 By Country – North America Optical Lens for Mobile Phone Sales, 2026-2034
6.4.3 United States Optical Lens for Mobile Phone Market Size, 2026-2034
6.4.4 Canada Optical Lens for Mobile Phone Market Size, 2026-2034
6.4.5 Mexico Optical Lens for Mobile Phone Market Size, 2026-2034
6.5 Europe
6.5.1 By Country – Europe Optical Lens for Mobile Phone Revenue, 2026-2034
6.5.2 By Country – Europe Optical Lens for Mobile Phone Sales, 2026-2034
6.5.3 Germany Optical Lens for Mobile Phone Market Size, 2026-2034
6.5.4 France Optical Lens for Mobile Phone Market Size, 2026-2034
6.5.5 U.K. Optical Lens for Mobile Phone Market Size, 2026-2034
6.5.6 Italy Optical Lens for Mobile Phone Market Size, 2026-2034
6.5.7 Russia Optical Lens for Mobile Phone Market Size, 2026-2034
6.5.8 Nordic Countries Optical Lens for Mobile Phone Market Size, 2026-2034
6.5.9 Benelux Optical Lens for Mobile Phone Market Size, 2026-2034
6.6 Asia
6.6.1 By Region – Asia Optical Lens for Mobile Phone Revenue, 2026-2034
6.6.2 By Region – Asia Optical Lens for Mobile Phone Sales, 2026-2034
6.6.3 China Optical Lens for Mobile Phone Market Size, 2026-2034
6.6.4 Japan Optical Lens for Mobile Phone Market Size, 2026-2034
6.6.5 South Korea Optical Lens for Mobile Phone Market Size, 2026-2034
6.6.6 Southeast Asia Optical Lens for Mobile Phone Market Size, 2026-2034
6.6.7 India Optical Lens for Mobile Phone Market Size, 2026-2034
6.7 South America
6.7.1 By Country – South America Optical Lens for Mobile Phone Revenue, 2026-2034
6.7.2 By Country – South America Optical Lens for Mobile Phone Sales, 2026-2034
6.7.3 Brazil Optical Lens for Mobile Phone Market Size, 2026-2034
6.7.4 Argentina Optical Lens for Mobile Phone Market Size, 2026-2034
6.8 Middle East & Africa
6.8.1 By Country – Middle East & Africa Optical Lens for Mobile Phone Revenue, 2026-2034
6.8.2 By Country – Middle East & Africa Optical Lens for Mobile Phone Sales, 2026-2034
6.8.3 Turkey Optical Lens for Mobile Phone Market Size, 2026-2034
6.8.4 Israel Optical Lens for Mobile Phone Market Size, 2026-2034
6.8.5 Saudi Arabia Optical Lens for Mobile Phone Market Size, 2026-2034
6.8.6 UAE Optical Lens for Mobile Phone Market Size, 2026-2034
7 Manufacturers & Brands Profiles
7.1 SEKONIX
7.1.1 SEKONIX Company Summary
7.1.2 SEKONIX Business Overview
7.1.3 SEKONIX Optical Lens for Mobile Phone Major Product Offerings
7.1.4 SEKONIX Optical Lens for Mobile Phone Sales and Revenue in Global (2020-2025)
7.1.5 SEKONIX Key News & Latest Developments
7.2 Kantatsu
7.2.1 Kantatsu Company Summary
7.2.2 Kantatsu Business Overview
7.2.3 Kantatsu Optical Lens for Mobile Phone Major Product Offerings
7.2.4 Kantatsu Optical Lens for Mobile Phone Sales and Revenue in Global (2020-2025)
7.2.5 Kantatsu Key News & Latest Developments
7.3 Digital Optics
7.3.1 Digital Optics Company Summary
7.3.2 Digital Optics Business Overview
7.3.3 Digital Optics Optical Lens for Mobile Phone Major Product Offerings
7.3.4 Digital Optics Optical Lens for Mobile Phone Sales and Revenue in Global (2020-2025)
7.3.5 Digital Optics Key News & Latest Developments
7.4 Largan Precision
7.4.1 Largan Precision Company Summary
7.4.2 Largan Precision Business Overview
7.4.3 Largan Precision Optical Lens for Mobile Phone Major Product Offerings
7.4.4 Largan Precision Optical Lens for Mobile Phone Sales and Revenue in Global (2020-2025)
7.4.5 Largan Precision Key News & Latest Developments
7.5 Sunny Optical Technology
7.5.1 Sunny Optical Technology Company Summary
7.5.2 Sunny Optical Technology Business Overview
7.5.3 Sunny Optical Technology Optical Lens for Mobile Phone Major Product Offerings
7.5.4 Sunny Optical Technology Optical Lens for Mobile Phone Sales and Revenue in Global (2020-2025)
7.5.5 Sunny Optical Technology Key News & Latest Developments
7.6 Genius Electronic Optical (GSEO)
7.6.1 Genius Electronic Optical (GSEO) Company Summary
7.6.2 Genius Electronic Optical (GSEO) Business Overview
7.6.3 Genius Electronic Optical (GSEO) Optical Lens for Mobile Phone Major Product Offerings
7.6.4 Genius Electronic Optical (GSEO) Optical Lens for Mobile Phone Sales and Revenue in Global (2020-2025)
7.6.5 Genius Electronic Optical (GSEO) Key News & Latest Developments
7.7 Asia Optical
7.7.1 Asia Optical Company Summary
7.7.2 Asia Optical Business Overview
7.7.3 Asia Optical Optical Lens for Mobile Phone Major Product Offerings
7.7.4 Asia Optical Optical Lens for Mobile Phone Sales and Revenue in Global (2020-2025)
7.7.5 Asia Optical Key News & Latest Developments
7.8 AAC
7.8.1 AAC Company Summary
7.8.2 AAC Business Overview
7.8.3 AAC Optical Lens for Mobile Phone Major Product Offerings
7.8.4 AAC Optical Lens for Mobile Phone Sales and Revenue in Global (2020-2025)
7.8.5 AAC Key News & Latest Developments
7.9 Ofilm Group
7.9.1 Ofilm Group Company Summary
7.9.2 Ofilm Group Business Overview
7.9.3 Ofilm Group Optical Lens for Mobile Phone Major Product Offerings
7.9.4 Ofilm Group Optical Lens for Mobile Phone Sales and Revenue in Global (2020-2025)
7.9.5 Ofilm Group Key News & Latest Developments
7.10 NEWMAX
7.10.1 NEWMAX Company Summary
7.10.2 NEWMAX Business Overview
7.10.3 NEWMAX Optical Lens for Mobile Phone Major Product Offerings
7.10.4 NEWMAX Optical Lens for Mobile Phone Sales and Revenue in Global (2020-2025)
7.10.5 NEWMAX Key News & Latest Developments
7.11 AOET
7.11.1 AOET Company Summary
7.11.2 AOET Business Overview
7.11.3 AOET Optical Lens for Mobile Phone Major Product Offerings
7.11.4 AOET Optical Lens for Mobile Phone Sales and Revenue in Global (2020-2025)
7.11.5 AOET Key News & Latest Developments
7.12 Lianchuang Electronic Technology
7.12.1 Lianchuang Electronic Technology Company Summary
7.12.2 Lianchuang Electronic Technology Business Overview
7.12.3 Lianchuang Electronic Technology Optical Lens for Mobile Phone Major Product Offerings
7.12.4 Lianchuang Electronic Technology Optical Lens for Mobile Phone Sales and Revenue in Global (2020-2025)
7.12.5 Lianchuang Electronic Technology Key News & Latest Developments
8 Global Optical Lens for Mobile Phone Production Capacity, Analysis
8.1 Global Optical Lens for Mobile Phone Production Capacity, 2026-2034
8.2 Optical Lens for Mobile Phone Production Capacity of Key Manufacturers in Global Market
8.3 Global Optical Lens for Mobile Phone Production by Region
9 Key Market Trends, Opportunity, Drivers and Restraints
9.1 Market Opportunities & Trends
9.2 Market Drivers
9.3 Market Restraints
10 Optical Lens for Mobile Phone Supply Chain Analysis
10.1 Optical Lens for Mobile Phone Industry Value Chain
10.2 Optical Lens for Mobile Phone Upstream Market
10.3 Optical Lens for Mobile Phone Downstream and Clients
10.4 Marketing Channels Analysis
10.4.1 Marketing Channels
10.4.2 Optical Lens for Mobile Phone Distributors and Sales Agents in Global
11 Conclusion
12 Appendix
12.1 Note
12.2 Examples of Clients
12.3 DisclaimerList of Tables
Table 1. Key Players of Optical Lens for Mobile Phone in Global Market
Table 2. Top Optical Lens for Mobile Phone Players in Global Market, Ranking by Revenue (2024)
Table 3. Global Optical Lens for Mobile Phone Revenue by Companies, (US$, Mn), 2020-2025
Table 4. Global Optical Lens for Mobile Phone Revenue Share by Companies, 2020-2025
Table 5. Global Optical Lens for Mobile Phone Sales by Companies, (K Units), 2020-2025
Table 6. Global Optical Lens for Mobile Phone Sales Share by Companies, 2020-2025
Table 7. Key Manufacturers Optical Lens for Mobile Phone Price (2020-2025) & (US$/Unit)
Table 8. Global Manufacturers Optical Lens for Mobile Phone Product Type
Table 9. List of Global Tier 1 Optical Lens for Mobile Phone Companies, Revenue (US$, Mn) in 2024 and Market Share
Table 10. List of Global Tier 2 and Tier 3 Optical Lens for Mobile Phone Companies, Revenue (US$, Mn) in 2024 and Market Share
Table 11. Segment by Type – Global Optical Lens for Mobile Phone Revenue, (US$, Mn), 2024 & 2031
Table 12. Segment by Type – Global Optical Lens for Mobile Phone Revenue (US$, Mn), 2020-2025
Table 13. Segment by Type – Global Optical Lens for Mobile Phone Revenue (US$, Mn), 2026-2031
Table 14. Segment by Type – Global Optical Lens for Mobile Phone Sales (K Units), 2020-2025
Table 15. Segment by Type – Global Optical Lens for Mobile Phone Sales (K Units), 2026-2031
Table 16. Segment by Application – Global Optical Lens for Mobile Phone Revenue, (US$, Mn), 2024 & 2031
Table 17. Segment by Application – Global Optical Lens for Mobile Phone Revenue, (US$, Mn), 2020-2025
Table 18. Segment by Application – Global Optical Lens for Mobile Phone Revenue, (US$, Mn), 2026-2031
Table 19. Segment by Application – Global Optical Lens for Mobile Phone Sales, (K Units), 2020-2025
Table 20. Segment by Application – Global Optical Lens for Mobile Phone Sales, (K Units), 2026-2031
Table 21. By Region – Global Optical Lens for Mobile Phone Revenue, (US$, Mn), 2025-2031
Table 22. By Region – Global Optical Lens for Mobile Phone Revenue, (US$, Mn), 2020-2025
Table 23. By Region – Global Optical Lens for Mobile Phone Revenue, (US$, Mn), 2026-2031
Table 24. By Region – Global Optical Lens for Mobile Phone Sales, (K Units), 2020-2025
Table 25. By Region – Global Optical Lens for Mobile Phone Sales, (K Units), 2026-2031
Table 26. By Country – North America Optical Lens for Mobile Phone Revenue, (US$, Mn), 2020-2025
Table 27. By Country – North America Optical Lens for Mobile Phone Revenue, (US$, Mn), 2026-2031
Table 28. By Country – North America Optical Lens for Mobile Phone Sales, (K Units), 2020-2025
Table 29. By Country – North America Optical Lens for Mobile Phone Sales, (K Units), 2026-2031
Table 30. By Country – Europe Optical Lens for Mobile Phone Revenue, (US$, Mn), 2020-2025
Table 31. By Country – Europe Optical Lens for Mobile Phone Revenue, (US$, Mn), 2026-2031
Table 32. By Country – Europe Optical Lens for Mobile Phone Sales, (K Units), 2020-2025
Table 33. By Country – Europe Optical Lens for Mobile Phone Sales, (K Units), 2026-2031
Table 34. By Region – Asia Optical Lens for Mobile Phone Revenue, (US$, Mn), 2020-2025
Table 35. By Region – Asia Optical Lens for Mobile Phone Revenue, (US$, Mn), 2026-2031
Table 36. By Region – Asia Optical Lens for Mobile Phone Sales, (K Units), 2020-2025
Table 37. By Region – Asia Optical Lens for Mobile Phone Sales, (K Units), 2026-2031
Table 38. By Country – South America Optical Lens for Mobile Phone Revenue, (US$, Mn), 2020-2025
Table 39. By Country – South America Optical Lens for Mobile Phone Revenue, (US$, Mn), 2026-2031
Table 40. By Country – South America Optical Lens for Mobile Phone Sales, (K Units), 2020-2025
Table 41. By Country – South America Optical Lens for Mobile Phone Sales, (K Units), 2026-2031
Table 42. By Country – Middle East & Africa Optical Lens for Mobile Phone Revenue, (US$, Mn), 2020-2025
Table 43. By Country – Middle East & Africa Optical Lens for Mobile Phone Revenue, (US$, Mn), 2026-2031
Table 44. By Country – Middle East & Africa Optical Lens for Mobile Phone Sales, (K Units), 2020-2025
Table 45. By Country – Middle East & Africa Optical Lens for Mobile Phone Sales, (K Units), 2026-2031
Table 46. SEKONIX Company Summary
Table 47. SEKONIX Optical Lens for Mobile Phone Product Offerings
Table 48. SEKONIX Optical Lens for Mobile Phone Sales (K Units), Revenue (US$, Mn) and Average Price (US$/Unit) & (2020-2025)
Table 49. SEKONIX Key News & Latest Developments
Table 50. Kantatsu Company Summary
Table 51. Kantatsu Optical Lens for Mobile Phone Product Offerings
Table 52. Kantatsu Optical Lens for Mobile Phone Sales (K Units), Revenue (US$, Mn) and Average Price (US$/Unit) & (2020-2025)
Table 53. Kantatsu Key News & Latest Developments
Table 54. Digital Optics Company Summary
Table 55. Digital Optics Optical Lens for Mobile Phone Product Offerings
Table 56. Digital Optics Optical Lens for Mobile Phone Sales (K Units), Revenue (US$, Mn) and Average Price (US$/Unit) & (2020-2025)
Table 57. Digital Optics Key News & Latest Developments
Table 58. Largan Precision Company Summary
Table 59. Largan Precision Optical Lens for Mobile Phone Product Offerings
Table 60. Largan Precision Optical Lens for Mobile Phone Sales (K Units), Revenue (US$, Mn) and Average Price (US$/Unit) & (2020-2025)
Table 61. Largan Precision Key News & Latest Developments
Table 62. Sunny Optical Technology Company Summary
Table 63. Sunny Optical Technology Optical Lens for Mobile Phone Product Offerings
Table 64. Sunny Optical Technology Optical Lens for Mobile Phone Sales (K Units), Revenue (US$, Mn) and Average Price (US$/Unit) & (2020-2025)
Table 65. Sunny Optical Technology Key News & Latest Developments
Table 66. Genius Electronic Optical (GSEO) Company Summary
Table 67. Genius Electronic Optical (GSEO) Optical Lens for Mobile Phone Product Offerings
Table 68. Genius Electronic Optical (GSEO) Optical Lens for Mobile Phone Sales (K Units), Revenue (US$, Mn) and Average Price (US$/Unit) & (2020-2025)
Table 69. Genius Electronic Optical (GSEO) Key News & Latest Developments
Table 70. Asia Optical Company Summary
Table 71. Asia Optical Optical Lens for Mobile Phone Product Offerings
Table 72. Asia Optical Optical Lens for Mobile Phone Sales (K Units), Revenue (US$, Mn) and Average Price (US$/Unit) & (2020-2025)
Table 73. Asia Optical Key News & Latest Developments
Table 74. AAC Company Summary
Table 75. AAC Optical Lens for Mobile Phone Product Offerings
Table 76. AAC Optical Lens for Mobile Phone Sales (K Units), Revenue (US$, Mn) and Average Price (US$/Unit) & (2020-2025)
Table 77. AAC Key News & Latest Developments
Table 78. Ofilm Group Company Summary
Table 79. Ofilm Group Optical Lens for Mobile Phone Product Offerings
Table 80. Ofilm Group Optical Lens for Mobile Phone Sales (K Units), Revenue (US$, Mn) and Average Price (US$/Unit) & (2020-2025)
Table 81. Ofilm Group Key News & Latest Developments
Table 82. NEWMAX Company Summary
Table 83. NEWMAX Optical Lens for Mobile Phone Product Offerings
Table 84. NEWMAX Optical Lens for Mobile Phone Sales (K Units), Revenue (US$, Mn) and Average Price (US$/Unit) & (2020-2025)
Table 85. NEWMAX Key News & Latest Developments
Table 86. AOET Company Summary
Table 87. AOET Optical Lens for Mobile Phone Product Offerings
Table 88. AOET Optical Lens for Mobile Phone Sales (K Units), Revenue (US$, Mn) and Average Price (US$/Unit) & (2020-2025)
Table 89. AOET Key News & Latest Developments
Table 90. Lianchuang Electronic Technology Company Summary
Table 91. Lianchuang Electronic Technology Optical Lens for Mobile Phone Product Offerings
Table 92. Lianchuang Electronic Technology Optical Lens for Mobile Phone Sales (K Units), Revenue (US$, Mn) and Average Price (US$/Unit) & (2020-2025)
Table 93. Lianchuang Electronic Technology Key News & Latest Developments
Table 94. Optical Lens for Mobile Phone Capacity of Key Manufacturers in Global Market, 2023-2025 (K Units)
Table 95. Global Optical Lens for Mobile Phone Capacity Market Share of Key Manufacturers, 2023-2025
Table 96. Global Optical Lens for Mobile Phone Production by Region, 2020-2025 (K Units)
Table 97. Global Optical Lens for Mobile Phone Production by Region, 2026-2031 (K Units)
Table 98. Optical Lens for Mobile Phone Market Opportunities & Trends in Global Market
Table 99. Optical Lens for Mobile Phone Market Drivers in Global Market
Table 100. Optical Lens for Mobile Phone Market Restraints in Global Market
Table 101. Optical Lens for Mobile Phone Raw Materials
Table 102. Optical Lens for Mobile Phone Raw Materials Suppliers in Global Market
Table 103. Typical Optical Lens for Mobile Phone Downstream
Table 104. Optical Lens for Mobile Phone Downstream Clients in Global Market
Table 105. Optical Lens for Mobile Phone Distributors and Sales Agents in Global Market

List of Figures
Figure 1. Optical Lens for Mobile Phone Product Picture
Figure 2. Optical Lens for Mobile Phone Segment by Type in 2024
Figure 3. Optical Lens for Mobile Phone Segment by Application in 2024
Figure 4. Global Optical Lens for Mobile Phone Market Overview: 2024
Figure 5. Key Caveats
Figure 6. Global Optical Lens for Mobile Phone Market Size: 2024 VS 2031 (US$, Mn)
Figure 7. Global Optical Lens for Mobile Phone Revenue: 2026-2034 (US$, Mn)
Figure 8. Optical Lens for Mobile Phone Sales in Global Market: 2026-2034 (K Units)
Figure 9. The Top 3 and 5 Players Market Share by Optical Lens for Mobile Phone Revenue in 2024
Figure 10. Segment by Type – Global Optical Lens for Mobile Phone Revenue, (US$, Mn), 2024 & 2031
Figure 11. Segment by Type – Global Optical Lens for Mobile Phone Revenue Market Share, 2026-2034
Figure 12. Segment by Type – Global Optical Lens for Mobile Phone Sales Market Share, 2026-2034
Figure 13. Segment by Type – Global Optical Lens for Mobile Phone Price (US$/Unit), 2026-2034
Figure 14. Segment by Application – Global Optical Lens for Mobile Phone Revenue, (US$, Mn), 2024 & 2031
Figure 15. Segment by Application – Global Optical Lens for Mobile Phone Revenue Market Share, 2026-2034
Figure 16. Segment by Application – Global Optical Lens for Mobile Phone Sales Market Share, 2026-2034
Figure 17. Segment by Application -Global Optical Lens for Mobile Phone Price (US$/Unit), 2026-2034
Figure 18. By Region – Global Optical Lens for Mobile Phone Revenue, (US$, Mn), 2025 & 2031
Figure 19. By Region – Global Optical Lens for Mobile Phone Revenue Market Share, 2020 VS 2024 VS 2031
Figure 20. By Region – Global Optical Lens for Mobile Phone Revenue Market Share, 2026-2034
Figure 21. By Region – Global Optical Lens for Mobile Phone Sales Market Share, 2026-2034
Figure 22. By Country – North America Optical Lens for Mobile Phone Revenue Market Share, 2026-2034
Figure 23. By Country – North America Optical Lens for Mobile Phone Sales Market Share, 2026-2034
Figure 24. United States Optical Lens for Mobile Phone Revenue, (US$, Mn), 2026-2034
Figure 25. Canada Optical Lens for Mobile Phone Revenue, (US$, Mn), 2026-2034
Figure 26. Mexico Optical Lens for Mobile Phone Revenue, (US$, Mn), 2026-2034
Figure 27. By Country – Europe Optical Lens for Mobile Phone Revenue Market Share, 2026-2034
Figure 28. By Country – Europe Optical Lens for Mobile Phone Sales Market Share, 2026-2034
Figure 29. Germany Optical Lens for Mobile Phone Revenue, (US$, Mn), 2026-2034
Figure 30. France Optical Lens for Mobile Phone Revenue, (US$, Mn), 2026-2034
Figure 31. U.K. Optical Lens for Mobile Phone Revenue, (US$, Mn), 2026-2034
Figure 32. Italy Optical Lens for Mobile Phone Revenue, (US$, Mn), 2026-2034
Figure 33. Russia Optical Lens for Mobile Phone Revenue, (US$, Mn), 2026-2034
Figure 34. Nordic Countries Optical Lens for Mobile Phone Revenue, (US$, Mn), 2026-2034
Figure 35. Benelux Optical Lens for Mobile Phone Revenue, (US$, Mn), 2026-2034
Figure 36. By Region – Asia Optical Lens for Mobile Phone Revenue Market Share, 2026-2034
Figure 37. By Region – Asia Optical Lens for Mobile Phone Sales Market Share, 2026-2034
Figure 38. China Optical Lens for Mobile Phone Revenue, (US$, Mn), 2026-2034
Figure 39. Japan Optical Lens for Mobile Phone Revenue, (US$, Mn), 2026-2034
Figure 40. South Korea Optical Lens for Mobile Phone Revenue, (US$, Mn), 2026-2034
Figure 41. Southeast Asia Optical Lens for Mobile Phone Revenue, (US$, Mn), 2026-2034
Figure 42. India Optical Lens for Mobile Phone Revenue, (US$, Mn), 2026-2034
Figure 43. By Country – South America Optical Lens for Mobile Phone Revenue Market Share, 2026-2034
Figure 44. By Country – South America Optical Lens for Mobile Phone Sales, Market Share, 2026-2034
Figure 45. Brazil Optical Lens for Mobile Phone Revenue, (US$, Mn), 2026-2034
Figure 46. Argentina Optical Lens for Mobile Phone Revenue, (US$, Mn), 2026-2034
Figure 47. By Country – Middle East & Africa Optical Lens for Mobile Phone Revenue, Market Share, 2026-2034
Figure 48. By Country – Middle East & Africa Optical Lens for Mobile Phone Sales, Market Share, 2026-2034
Figure 49. Turkey Optical Lens for Mobile Phone Revenue, (US$, Mn), 2026-2034
Figure 50. Israel Optical Lens for Mobile Phone Revenue, (US$, Mn), 2026-2034
Figure 51. Saudi Arabia Optical Lens for Mobile Phone Revenue, (US$, Mn), 2026-2034
Figure 52. UAE Optical Lens for Mobile Phone Revenue, (US$, Mn), 2026-2034
Figure 53. Global Optical Lens for Mobile Phone Production Capacity (K Units), 2026-2034
Figure 54. The Percentage of Production Optical Lens for Mobile Phone by Region, 2024 VS 2031
Figure 55. Optical Lens for Mobile Phone Industry Value Chain
Figure 56. Marketing Channels