SEMICONDUCTOR INSIGHT
MARKET RESEARCH REPORT

Optical Communication Network Equipment Market

2026 to 2034
MARKET INTELLIGENCE
ACROSS KEY REGIONS
2026 EDITION
COMMUNICATION SYSTEMS Semiconductor Market Research

Optical Communication Network Equipment Market

Size, Trends, Business Strategies 2026-2034

◷
UPDATED 03 November 2026
▤
REPORT LENGTH Detailed Report
▣
REPORT CODE 2361f893aa9a
▯
FORMATS PDF

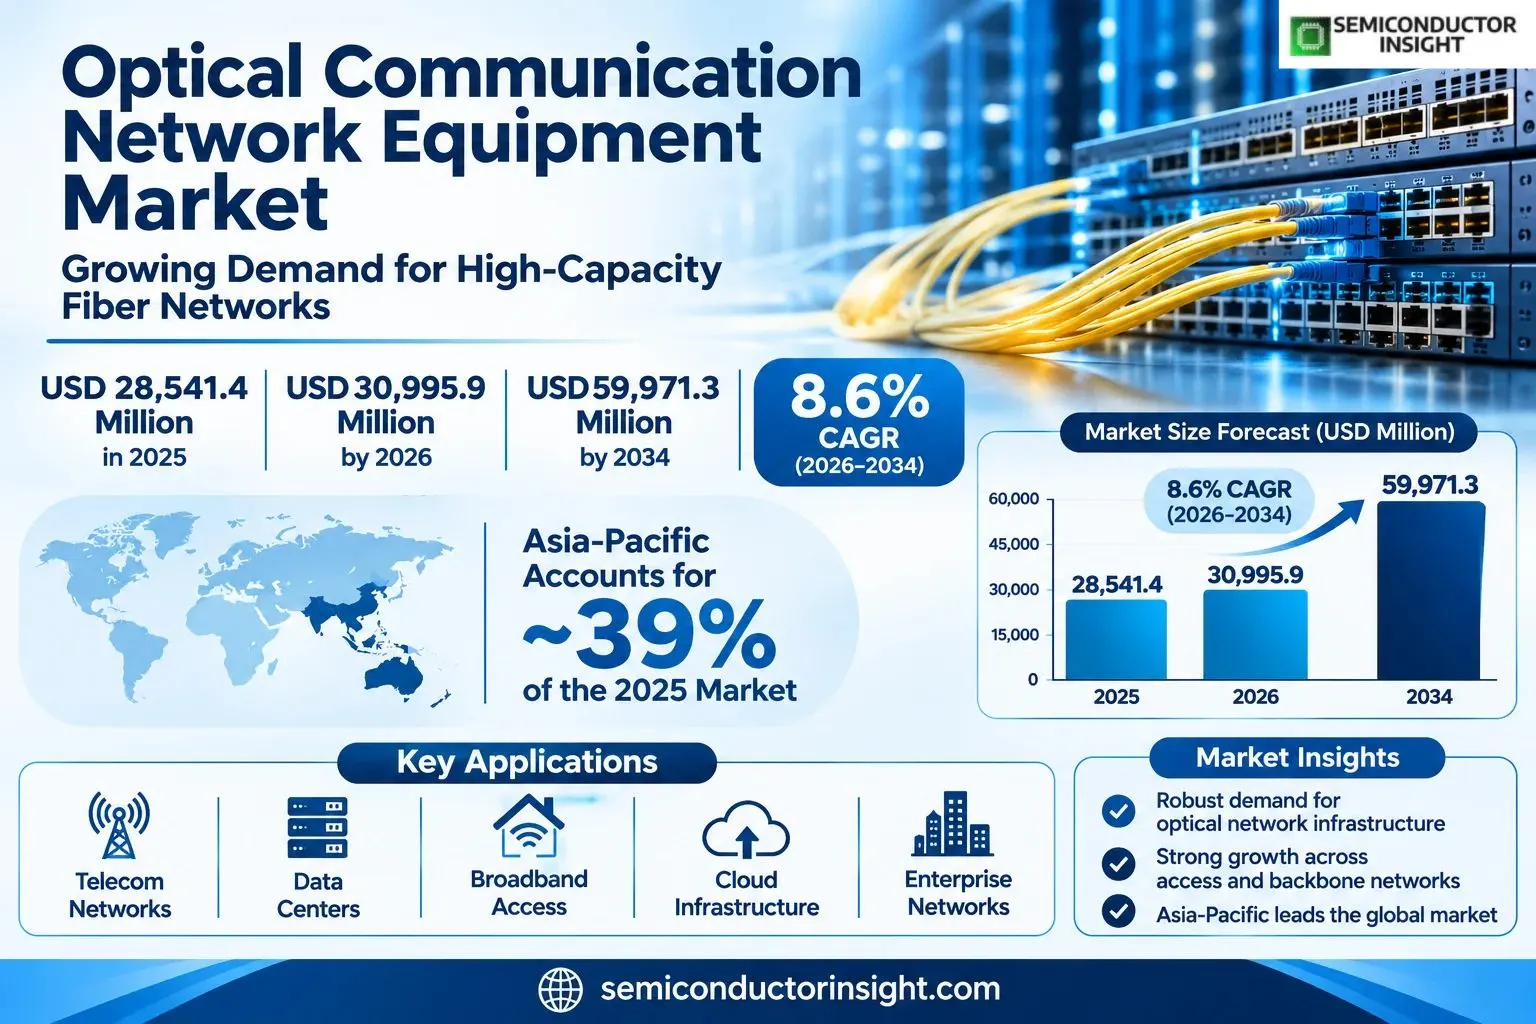
Optical communication network equipment market was valued at USD 28,541.4 million in 2025, with an estimated USD 30,995.9 million in 2026, and is projected to reach USD 59,971.3 million by 2034 at 8.6% CAGR during 2026–2034. The sector supplies the active systems that turn optical fiber routes into managed access, metropolitan and long-distance transport networks. Asia-Pacific leads at about ~39% of 2025 sales because its carriers, equipment factories and public broadband programmes support the largest concentration of access and backbone projects.

Get the sample PDF with study scope, segmentation and methodology details.

Key Statistics

2025 Market Size
USD 28,541.4 million
2034 Projected Size
USD 59,971.3 million
CAGR (2026–2034)
8.6%
Largest Market in 2025
Asia-Pacific (~39%)

Key Takeaways

  • Market trajectory: Global equipment revenue reached USD 28,541.4 million in 2025 and is expected to reach USD 59,971.3 million in 2034, with an estimated 2026 value of USD 30,995.9 million and 8.6% CAGR as fiber access, coherent transport and metro interconnection capacity are upgraded.
  • Access networks: Optical access systems represent ~38% of 2025 revenue, with metropolitan systems near ~35% and trunk-network platforms at ~27%; access is supported by PON migration while metropolitan switching benefits from growing data-center interconnection.
  • Application concentration: Big Data Center equipment accounts for ~28% of 2025 demand, followed by 5G Infrastructure at ~24% and Artificial Intelligence at ~14%; the eight application groups also include utility, railway, charging, industrial and miscellaneous networks.
  • Regional structure: Asia-Pacific leads with ~39% of 2025 revenue and ~9.7% CAGR, ahead of North America at ~25% and Europe at ~22%; network operator capital plans, procurement rules and available dark fiber shape equipment demand.
  • Technology economics: Coherent optical line cards, wavelength-selective switches and dense access shelves raise capacity per fiber, but power consumption, specialist installation, equipment financing and multi-vendor interoperability can delay replacement of functioning platforms.

Optical Communication Network Equipment Market Overview

Optical communication network equipment market was valued at USD 28,541.4 million in 2025, with an estimated USD 30,995.9 million in 2026, and is projected to reach USD 59,971.3 million by 2034 at 8.6% CAGR during 2026–2034. The sector supplies the active systems that turn optical fiber routes into managed access, metropolitan and long-distance transport networks. Asia-Pacific leads at about ~39% of 2025 sales because its carriers, equipment factories and public broadband programmes support the largest concentration of access and backbone projects.

Base year: 2025 · Estimated year: 2026 · Forecast period: 2026–2034 · Historical data: 2020–2024 · Values in USD million

Optical communication network equipment comprises access terminals, subscriber optical network units, wavelength division multiplexing platforms, optical transport network switches, reconfigurable add-drop multiplexers and associated coherent line equipment. These systems carry internet traffic between homes, enterprise sites, mobile towers, data centers and national backbones. Fiber strands and passive cable assemblies alone are not equipment revenue, while stand-alone general-purpose compute servers and application software belong to different purchasing budgets.

The International Telecommunication Union defines optical transport network framing and interoperability through Recommendation G.709, enabling operators to groom client traffic over protected wavelength channels. A coherent optical interface encodes digital signals onto amplitude, phase and polarization, permitting higher spectral efficiency than simple intensity modulation. Network buyers evaluate route reach, channel density, service restoration, electrical consumption, rack space and management integration together rather than selecting a transponder solely by its advertised bit rate.

Optical investment now serves two overlapping traffic patterns. Residential broadband and mobile backhaul need many distributed endpoints with reliable provisioning, whereas AI clusters and cloud campuses need large east-west data flows across a smaller number of high-capacity routes. Equipment makers therefore sell dense access shelves and automated metro or backbone transport systems to different procurement teams, even though the installations may share amplifiers, photonic components and the same buried fiber corridor.

The industry is moving from 100G and 200G wavelength deployments toward 400G, 800G and selected 1.6T coherent links where fiber quality and route length permit. A successful laboratory transmission does not mean every installed span can operate at the same speed: dispersion, optical signal-to-noise ratio, amplification and regeneration still govern achievable capacity. Operators often retain their fiber plant while replacing line cards, photonic shelves and software controllers in carefully scheduled maintenance windows.

Commercial demand is concentrated among national carriers, wholesale fiber owners, hyperscale data-center operators and public infrastructure networks. Qualification can last many quarters because a platform must interoperate with legacy routers, operational support systems and protection paths. Suppliers with regional service teams and predictable spare-part availability often outperform technically attractive entrants in tenders where outages affect thousands of subscribers or large enterprise service-level agreements.

Segment Analysis: By Type

By type, the market divides into Access Network (~38% share, ~9.6% CAGR), Metropolitan Area Network (~35%, ~8.9% CAGR) and Trunk Network (~27%, ~6.6% CAGR). Access hardware spans passive optical network termination and subscriber provisioning, while metropolitan and trunk equipment aggregate increasingly fast coherent wavelengths. The value of a transport node depends on the combination of photonic line system, switching fabric, client interfaces, protection and network management.

Type Function Market position
Access Network Optical line terminals and optical network terminals connect residential, enterprise and campus endpoints over PON architectures, including GPON, XGS-PON and emerging higher-speed upgrades. Carrier purchasing emphasizes port density, split ratio, provisioning automation, optical budget, power supply redundancy and compatibility with existing optical distribution networks. Fixed wireless backhaul and enterprise leased-line access can also use managed optical aggregation rather than consumer PON endpoints. Largest type (~38% share, ~9.6% CAGR). Broadband coverage expansion drives unit volume, while upgrades from 1G-class services to 10G-class service tiers raise equipment value. Chinese and Indian deployments sustain scale, and European fiber programmes create replacement demand. The mix includes central-office shelves and customer terminals; the cost of passive fiber construction is outside this equipment category.
Metropolitan Area Network Metro optical equipment concentrates enterprise and mobile traffic between central offices, cloud on-ramps and urban data centers. Reconfigurable optical add-drop multiplexers, optical cross-connects, packet-optical switches and compact coherent platforms allow traffic to bypass unnecessary electrical regeneration. Operators increasingly combine 400G and 800G transport with automated wavelength assignment, optical monitoring and route diversity to protect latency-sensitive services. Second-largest type (~35% share, ~8.9% CAGR). Dense data-center corridors and citywide mobile aggregation make metro networks a recurring upgrade market. The economics favor photonic bypass when electrical port consumption is costly, but the best design differs between ring networks, mesh architectures and point-to-point routes. Service activation speed and compatibility with multiple coherent vendors determine many awards.
Trunk Network Long-haul optical systems provide national and international terrestrial transmission through amplified DWDM links, optical transport switching, regeneration sites and high-capacity coherent transponders. Engineering requirements include fiber characterization, amplifier spacing, chromatic dispersion tolerance, nonlinear impairment control and restoration across geographically diverse routes. Some subsea terminal systems share components but face additional marine reliability and maintenance constraints. Trunk platforms (~27% share, ~6.6% CAGR). These projects carry high average selling prices but are fewer and longer to approve than access expansions. Network owners extend the life of existing routes with new 800G-capable line cards and C+L-band upgrades, and a portion of capital spending shifts from new fiber to better use of installed spectrum.

Segment Analysis: By Application

Application demand is led by Big Data Center (~28% share, ~10.0% CAGR) and 5G Infrastructure (~24%, ~8.1% CAGR), while Artificial Intelligence (~14%, ~10.3% CAGR) adds a distinct high-bandwidth interconnection requirement. Utility, rail, electric-vehicle charging and industrial networks buy more specialized equipment with longer procurement cycles. All eight published application groups are retained without folding AI into the broader data-center segment.

Application Demand characteristics
5G Infrastructure ~24% share; ~8.1% CAGR. Mobile operators use optical aggregation, fronthaul and backhaul to connect radio sites with distributed units, core networks and edge data centers. Timing is driven by 5G rollout density, fiber leasing costs and the decision to move from 100G to 400G metro aggregation. Redundancy, synchronization and rapid restoration matter because one optical failure can interrupt multiple radio sectors and business customers.
UHV ~6% share; ~5.9% CAGR. Ultra-high-voltage transmission grids need secure, deterministic fiber networks for protection relays, substation control, fault monitoring and utility dispatch. Optical transport nodes must withstand electrical interference, carry mission-critical traffic and remain serviceable over long asset lives. Power utilities often specify ruggedized hardware, isolated management and strict procurement documentation rather than selecting the highest available wavelength speed.
Intercity High-speed Rail and Intercity Rail Transit ~6% share; ~6.2% CAGR. Railway operators deploy resilient optical rings for signaling, station communications, train control and surveillance across extensive rights of way. Equipment must support geographically distributed nodes, deterministic restoration and environmental hardening. Tenders emphasize system certification, maintenance windows and long-term spare parts because communications failures can affect passenger safety and line capacity.
Charging Piles for New Energy Vehicles ~5% share; ~5.8% CAGR. Large charging depots, highway service areas and grid-integrated charging corridors need reliable backhaul for payments, load balancing, remote diagnostics and energy management. Optical access equipment competes with wireless links and ordinary Ethernet at smaller sites, so spending is concentrated where high charger density or critical uptime justifies dedicated fiber.
Big Data Center Largest application (~28% share; ~10.0% CAGR). Hyperscale campuses and colocation operators buy optical line systems to interconnect facilities, reach carrier hotels and move replication traffic between availability zones. High fiber utilization, 400G/800G client connectivity and rapid wavelength turn-up matter more than residential endpoint count. The equipment boundary covers transport systems rather than servers or GPU accelerators.
Artificial Intelligence ~14% share; ~10.3% CAGR. Distributed AI training and inference create bursty, high-throughput traffic between compute clusters and storage regions, increasing demand for coherent data-center interconnect links. Operators consider latency, power per transmitted bit and optical spectrum efficiency when expanding AI corridors. AI is tracked separately from ordinary cloud data-center services to retain a distinct application category.
Industrial Internet ~11% share; ~7.9% CAGR. Manufacturing campuses, ports, mines and industrial parks use optical access and metro equipment to connect operational technology with enterprise networks. Buyers need segmentation, rugged interfaces, availability and predictable maintenance support. Projects often combine private 5G, edge computing and industrial control, with fiber providing a stable transport layer across noisy or electrically hazardous environments.
Others ~6% share; ~7.7% CAGR. Remaining demand includes public safety networks, educational campuses, government connectivity, healthcare institutions and wholesale service-provider upgrades that do not fit the seven specified applications. These projects often rely on local systems integrators and require multiyear support for existing equipment. Procurement varies by jurisdiction, with public tenders emphasizing cybersecurity, national standards, support commitments and integration into existing routers and network controllers.

The distinction between applications matters to equipment vendors because contracts are awarded by different buyers. A hyperscaler can commit to several coherent transport routes in a single campus programme, while a national rail agency may release a multiyear tender tied to civil works. The same photonic hardware may serve both, but service assurance, encryption, warranty and integration requirements create different cost structures and delivery schedules.
Optical Communication Network Equipment Market, Size, Trends, Business Strategies 2026-2034

Regional Analysis

Asia-Pacific holds the largest share of optical communication network equipment sales at about ~39% in 2025 and grows at ~9.7% CAGR, supported by large carrier footprints, manufacturing clusters and cloud corridors. North America follows at ~25% with ~8.2% CAGR, Europe at ~22% with ~7.8%, South America at ~8% with ~9.4%, and the Middle East and Africa at ~6% with ~3.8%. Different regulatory systems, fiber availability and equipment qualification processes determine each region’s route to growth.

How do optical equipment purchasing patterns differ between regions?

Asian carriers procure at scale across access and long-haul transport, whereas North American cloud operators exert unusually strong influence on high-capacity data-center interconnection. European buyers balance gigabit coverage with energy efficiency and multivendor openness. South American networks prioritize extending national backbone coverage between difficult geographies, while Middle Eastern operators invest in cloud hubs and international gateways. African deployment remains more uneven because power, financing and right-of-way constraints affect network construction as much as transponder specifications.

Region Position Growth outlook Demand profile What decides supplier selection
Asia-Pacific Largest (~39%) Fast (~9.7% CAGR) PON rollout, mobile transport and cloud interconnect Local production, fiber reach and carrier qualification
North America Second (~25%) Steady (~8.2% CAGR) Hyperscale campuses, wholesale fiber and metro rings Open interfaces, service support and energy per bit
Europe Third (~22%) Steady (~7.8% CAGR) Gigabit coverage, urban metro and cross-border links Interoperability, procurement and resilience
South America Fourth (~8%) Fast (~9.4% CAGR) Backbone extension, mobile backhaul and cloud gateways Import economics, long routes and installation capacity
Middle East & Africa Fifth (~6%) Developing (~3.8% CAGR) Subsea landings, national fiber and digital hubs Project finance, cooling and maintenance availability

Asia-Pacific LARGEST · ~39% SHARE

Why does Asia-Pacific dominate optical communication network equipment demand?

Asia-Pacific accounts for ~39% of 2025 equipment value and is expected to grow at ~9.7% CAGR through 2034. China combines extensive fixed broadband, domestic system suppliers and national transmission routes; Japan and South Korea buy dense coherent equipment for cloud and mobile corridors; India is adding wholesale fiber capacity between emerging data-center hubs. Supplier competition is intense because operators can compare locally manufactured access shelves with global transport platforms.

Market positionLargest region (~39%)
Growth outlookFast (~9.7% CAGR)
Demand profileBroadband, cloud and mobile
Market access gateCarrier qualification and local supply
Country Position in region What drives demand
China Largest national buyer China has extensive PON access networks and multiple long-haul routes serving coastal manufacturing centers and inland cities. Domestic vendors Huawei, ZTE and FiberHome supply optical line terminals, metro switching shelves and coherent backbone systems, while operators require integration with existing network management platforms. Upgrade decisions increasingly consider power per bit and 400G/800G readiness rather than the number of fiber kilometers alone.
Japan & South Korea Advanced capacity mix Japan and South Korea buy resilient optical rings for dense urban networks, international gateways and data-center interconnection. Japanese systems integrators and Fujitsu support coherent transport deployment, while Korean mobile and cloud operators emphasize low latency and fast restoration. The countries have relatively mature access footprints, so replacement of older metro equipment can account for more spending than new residential fiber construction.
India & Southeast Asia Expansion corridors India is adding national and metro data-center routes while Southeast Asian markets develop cloud regions and submarine landing connections. Operators weigh 400G/800G upgrades against long routes with variable fiber quality and the need to extend broadband to smaller cities. Procurement combines domestic contractors with international optical equipment vendors, and civil works delays can push hardware delivery into later budget periods.

Market instances

  • A 1.6 Tbps coherent trial connected two Indian data centers. Vodafone Idea and Ciena reported a 1.6 Tb/s single-channel trial in March 2026 across a meshed data-center interconnect network. The carrier is using WaveLogic 6 Extreme on the 6500 platform and expects to offer services up to 800G. This shows why transport hardware demand can rise without a proportional increase in fiber routes: an operator upgrades photonic interfaces and switching capacity on infrastructure already in service.
  • A 1 Tbps wavelength crossed a 1,450 km Indian route. Constl and Ciena demonstrated a 1 Tbps optical channel between Mumbai and Chennai in December 2025 without intermediate regeneration. Constl described more than 12,000 km of fiber connecting around 100 data centers in 13 cities. The commercial significance is a path toward higher capacity on established corridors, although operators still need to validate each span before using the same line rate in production.
  • Optical access and transport portfolios are being upgraded together. Huawei described next-generation optical transport and access solutions in March 2026, covering 400G/800G backbone paths, metropolitan optical cross-connects and OLT/ONT systems. A combined portfolio matters in Asian markets where national carriers tender both last-mile subscriber upgrades and backbone aggregation. Equipment contracts can therefore bundle access shelves, photonic switching and operational support, although each element has a distinct service and replacement cycle.
In the full report: country-level revenue, equipment capacity and supplier positioning for China, Japan, South Korea, India and Southeast Asia, with access, metro and trunk segmentation and data-center route case studies.

North America SECOND · ~25% SHARE

What drives North American optical transport procurement?

North America represents ~25% of 2025 sales with ~8.2% CAGR. Hyperscale operators, regional fiber providers and large carriers are modernizing metro and intercity routes to serve cloud availability zones and enterprise demand. The United States drives most high-capacity equipment orders, Canada adds long-distance transport requirements and Mexico develops cross-border capacity. Buyers favor open interfaces, route protection and reliable spares over isolated peak-speed claims.

Market positionSecond (~25%)
Growth outlookSteady (~8.2% CAGR)
Demand profileCloud, carrier and wholesale fiber
Market access gateOpen optics and service availability
Country Position in region What drives demand
United States Cloud-led demand The United States has a large installed base of long-haul fiber, carrier hotels and hyperscale data centers. Operators are adding coherent capacity between campuses and metro exchanges while upgrading older ROADM nodes that consume too much rack power. Procurement emphasizes operational automation, coherent pluggable interoperability and 24-hour maintenance support. Dense cloud corridors can justify new photonic shelves even where residential access growth is comparatively mature.
Canada Long-distance resilience Canadian carriers must connect distant population centers, energy projects and remote industrial communities across challenging climates. Optical transport equipment is selected for route reach, protection switching and manageable power demand at regeneration sites. Major city data centers create metro demand, but national coverage programmes often require financing and construction coordination before active optical platforms are ordered. Long equipment support periods are particularly important outside Toronto, Montreal and Vancouver.
Mexico Cross-border expansion Mexico benefits from manufacturing relocation, mobile network modernization and demand for connectivity to US cloud facilities. Operators invest in optical rings around Mexico City, Monterrey and industrial border corridors, where network resilience matters to automotive and electronics factories. Import costs, currency movements and contractor availability influence project timing, and international carriers often specify equipment compatible with existing North American transport management systems.

Market instances

  • Coherent pluggables broaden equipment architecture choices. Cisco documents 800ZR and 800ZR+ optical modules for high-capacity coherent transmission, with reach dependent on configuration and fiber conditions. These interfaces let network operators consider routed optical designs alongside traditional transponder shelves. The equipment implication is not that dedicated optical platforms disappear, but that metro buyers increasingly compare pluggable-based router ports with photonic line systems on space, energy and lifecycle operations.
  • AI networks are shifting metro capacity requirements. Ciena introduced high-speed connectivity innovations in March 2026 that included 1600ZR/ZR+ concepts, full-spectrum coherent transponders and a 6.4T optical engine. The announcement reflects engineering investment in denser interconnect rather than proof of uniform commercial deployment. North American cloud corridors are important early markets because equipment power and rack density become material constraints as optical channels multiply.
  • Carrier route engineering still determines achievable throughput. The G.709 optical transport framework defines the digital wrapping and overhead used to carry client signals over managed optical paths. In practical North American networks, 400G and 800G services must be qualified against span loss, amplifiers and protection topology before launch. Operators with older fiber routes may gain more from improved regeneration and management than from replacing every line system at once.
In the full report: operator procurement patterns in the United States, Canada and Mexico, with metro and long-haul equipment spending, coherent pluggable adoption and cloud interconnection analysis.

Europe THIRD · ~22% SHARE

How do European broadband and resilience targets shape equipment spending?

Europe contributes ~22% of 2025 revenue with ~7.8% CAGR. Fiber access programmes, cross-border data flows and resilient national transport networks support optical systems orders. The European Union’s Digital Decade connectivity goals create policy context, but individual tenders depend on national funding, construction readiness and operator balance sheets. European buyers pay close attention to multivendor operation, electrical efficiency and cybersecurity documentation for core network platforms.

Market positionThird (~22%)
Growth outlookSteady (~7.8% CAGR)
Demand profileFiber coverage and metro upgrades
Market access gateInteroperability and compliance
Country Position in region What drives demand
Germany Industrial backbone Germany combines major enterprise networks with dense industrial regions and multiple international data-center routes. Optical equipment demand comes from fiber-to-premises expansion, carrier aggregation and resilient links serving automotive, chemical and engineering sites. Operators frequently require detailed interoperability testing and long maintenance commitments, while civil permitting and fragmented access construction can delay the commissioning of equipment purchased for new fiber builds.
United Kingdom Competitive fiber market The United Kingdom has several competing alternative fiber operators as well as established national networks, creating demand for optical access terminals and aggregation shelves. London data-center corridors also need high-capacity metro interconnection and international landing connectivity. Financing discipline is important: operators may delay a 10G access upgrade or consolidate vendors when subscriber take-up trails the pace of fiber installation.
France Coverage and cross-border links France has a mature fiber rollout environment and substantial international network interconnection around Paris and coastal landing points. Equipment orders increasingly emphasize service upgrades, network resilience and capacity for enterprise and cloud traffic rather than first-time household connections alone. Buyers compare optical transport vendors on restoration automation, energy consumption, regulatory documentation and compatibility with the installed passive fiber and aggregation architecture.

Market instances

  • European connectivity targets support equipment renewal. The European Commission’s Digital Decade agenda sets broad gigabit and 5G coverage objectives, which frame investment in access networks and transport backbones. These targets do not guarantee a particular vendor order or annual market value. Their significance is to encourage national programmes that eventually require active optical terminals, metropolitan aggregation and resilient links between regional exchanges.
  • Higher-density optical shelves change central-office economics. Nokia announced high-capacity 1830 PSS shelves in October 2025, emphasizing increased optical density and lower power per bit for bandwidth-intensive routes. European operators with expensive energy and central-office space have a strong incentive to compare compact shelves against larger installed platforms. Actual savings depend on wavelength loading, network architecture and how much legacy equipment can be retired.
  • Open line systems enable staged upgrades. European carriers are testing open optical line systems against diverse coherent interfaces and network controllers. Such interoperability matters because several operators have multi-vendor optical estates inherited through mergers or geographic expansion. A successful demonstration reduces perceived integration risk but does not replace a carrier’s acceptance testing on its own fiber routes.
In the full report: country market profiles for Germany, the United Kingdom, France, Italy and Spain, including fixed access, metro capacity, transport resilience and vendor qualification.

South America FOURTH · ~8% SHARE

Where is South American optical-network spending concentrated?

South America holds about ~8% of 2025 equipment revenue and grows at ~9.4% CAGR, with demand centered on metropolitan broadband, cloud gateways and national backbone extension. Brazil accounts for the largest equipment opportunities, Argentina needs resilient connections between concentrated population centers and Chile benefits from Pacific-facing submarine routes. Operators face long routes, financing volatility and import costs, so projects may advance in discrete phases rather than uniform annual replacements.

Market positionFourth (~8%)
Growth outlookFast (~9.4% CAGR)
Demand profileBackbone and cloud corridors
Market access gateFinance, imports and local service
Country Position in region What drives demand
Brazil Regional anchor Brazil has large urban fiber networks, substantial wholesale transport demand and expanding data-center connectivity around São Paulo, Rio de Janeiro and Fortaleza. Network owners invest in DWDM systems that connect domestic cloud sites to international cable landings. The purchasing decision often weighs local technical support and tax treatment against wavelength capacity, and remote inland routes can require more amplification and regeneration than short metropolitan spans.
Argentina Selective modernization Argentina’s optical equipment market is concentrated in Buenos Aires and a limited set of national and regional backbone corridors. Carriers prioritize replacement of aging transport nodes, redundancy for enterprise networks and improved interconnection with neighboring countries. Exchange-rate uncertainty and imported hardware costs can defer capital programmes, making spare-part continuity and compatibility with existing optical line systems especially important for operator procurement.
Chile Subsea connectivity Chile connects mining and urban demand with Pacific submarine landings and long north-south fiber corridors. Data-center operators need reliable international capacity while mining companies demand robust private optical links across remote facilities. High distances, difficult terrain and seismic risk make protection routing and equipment availability important. Operators may upgrade coherent wavelengths on existing fiber before undertaking costly new route construction.

Market instances

  • Optical transport demonstrations target Brazilian network buyers. Ciena used Futurecom 2026 in São Paulo to present WaveLogic 6 Extreme at 1.6 Tb/s, high-capacity transponders and coherent routing for cloud and carrier networks. The event illustrates supplier focus on Latin American modernization opportunities, not a confirmed regional equipment sales figure. Operators must still evaluate deployment economics, customs duties and the capabilities of their installed fiber routes.
  • Metro and international links require different capacity plans. Brazilian data-center operators concentrate traffic around a small number of urban interconnection hubs, while national carriers must carry traffic across much longer inland spans. A metro ROADM upgrade can reduce electrical handoffs and improve provisioning speed, whereas a long-haul deployment may need more amplifiers and protection paths. These different engineering requirements affect the value and timing of optical equipment orders.
  • Industrial connectivity adds a distinct procurement channel. Copper, lithium, agricultural and energy businesses in the region increasingly use private fiber to connect operational facilities with enterprise networks. Their transport projects are smaller than national carrier builds but can demand rugged hardware, secure management and long spare-part support. Equipment vendors often sell through regional integrators, so local inventory and installation expertise determine whether a technically capable platform reaches the final shortlist.
In the full report: Brazil, Argentina and Chile equipment demand with optical transport route economics, submarine gateways, wholesale fiber and industrial connectivity tenders.

Middle East & Africa FIFTH · ~6% SHARE

What distinguishes optical-network investment in the Middle East and Africa?

The Middle East and Africa represent ~6% of 2025 value with ~3.8% CAGR, reflecting fast projects in Gulf digital hubs alongside slower access expansion in less-connected African markets. Gulf operators need resilient national backbones and high-capacity links to cloud campuses, while African carriers invest in submarine landings, regional transit and city networks. Financing, stable power, right-of-way permissions and access to qualified engineers remain material adoption constraints.

Market positionFifth (~6%)
Growth outlookDeveloping (~3.8% CAGR)
Demand profileDigital hubs and submarine links
Market access gateFinance, power and project timing
Country Position in region What drives demand
Saudi Arabia Digital hub investment Saudi operators are extending national fiber capacity to serve data centers, public services, enterprise districts and international gateways. Long desert routes create demanding requirements for optical amplification, equipment cooling and remote monitoring. Transport purchases are often aligned with large digital infrastructure programmes, so suppliers need local engineering partners, documented security controls and reliable maintenance support for installations far from major cities.
United Arab Emirates International gateway The United Arab Emirates has dense urban connectivity and multiple submarine and regional interconnection paths. Cloud campuses, financial services and mobile networks need resilient metro transport and rapid capacity expansion between exchanges. Procurement emphasizes availability, cybersecurity, managed optical spectrum and operational automation. High-capacity equipment can be justified on short routes, but route diversity and protected power remain essential to service continuity.
South Africa African backbone center South Africa is a major aggregation market for regional traffic and international subsea capacity, with important data-center corridors around Johannesburg and Cape Town. Operators must connect urban rings with long domestic routes and neighboring countries. Power interruptions and theft risks make resilient power design, physical route diversity and fast replacement parts as important as coherent transmission speed when selecting network equipment.

Market instances

  • An Atlantic cable upgrade expands African gateway capacity. The Africa Coast to Europe cable consortium selected Ciena technology in September 2026 for a route spanning about 17,000 km and 18 landing stations. The system serves countries across Western Europe and Africa, with the upgrade intended to deliver more than 30 Tb/s. This shows how existing international optical infrastructure can gain capacity through terminal and line-system modernization without constructing a completely new cable.
  • Gulf cloud corridors need high-availability metro systems. Cloud and financial-service workloads in Gulf cities require optical paths between separate availability zones, often with physically diverse routes and protected power supplies. High-density DWDM shelves reduce rack usage in carrier facilities, but reliable commissioning and security documentation can determine vendor selection. Contracts may include monitoring and lifecycle support because an optical outage can affect multiple hosted services simultaneously.
  • Rural access economics remain uneven across Africa. Many African markets face expensive backhaul, long distances between population centers and intermittent electricity. Operators may prioritize core routes and high-demand city corridors before extending PON networks into smaller communities. Optical access equipment competes for funding with fiber construction and power systems, so purchase orders frequently depend on development financing, spectrum policy and the ability to share infrastructure across carriers.
In the full report: Saudi Arabia, the United Arab Emirates and South Africa, plus wider African gateway projects, with optical backbone, metro, access and financing analysis.

Key Optical Communication Network Equipment Manufacturers and Competitive Landscape

Optical network equipment is supplied by a combination of vertically integrated communications vendors and specialists in coherent transport. Huawei, ZTE, Nokia, Ciena, Adtran, Cisco, Fujitsu and FiberHome compete across overlapping but not identical products. A carrier typically qualifies several generations of optical line cards and management software before choosing a platform, making installed-base compatibility, energy consumption, network restoration and spare-part availability decisive commercial factors.

Huawei and ZTE offer extensive access, metropolitan and backbone portfolios, with advantages in integrated equipment design, manufacturing scale and broad operator relationships. Huawei combines optical line terminals, cross-connects and AI-oriented optical transport systems, while ZTE supplies HI-OTN platforms and ZXONE optical transport hardware. Procurement restrictions in some jurisdictions limit their accessible markets, so their competitive positions differ considerably by geography rather than following a single worldwide ranking.

Nokia has strengthened its optical portfolio through the completed acquisition of Infinera, bringing coherent technology and photonic integration into its broader networking business. Ciena focuses on high-capacity coherent transport, packet-optical systems and network automation, including WaveLogic 6. Both sell into carriers and wholesale fiber providers that value route reach and lifecycle economics. Adtran competes through FSP 3000 optical line systems and interoperable coherent transport, often emphasizing openness and flexibility.

Cisco approaches optical infrastructure through routed optical networking, coherent pluggables and integration with IP routing estates. Fujitsu supplies 1FINITY transport equipment and coherent interfaces, while FiberHome has a strong position in optical access and transport systems in Asia. Customers compare these offerings with different technical architectures: a dedicated ROADM shelf may be appropriate for a dense mesh, while a pluggable coherent interface can suit a simpler point-to-point route.

Historical company names should not be treated as separate contemporary competitors. Infinera became part of Nokia after the acquisition closed in February 2025, and Alcatel-Lucent is a legacy brand within Nokia. Corning is an important upstream fiber and cable supplier rather than a direct substitute for a full optical transport platform, while Ceragon is more closely associated with wireless transport. These distinctions matter when assessing who actually competes for an optical equipment contract.

Tier structure

Tier Companies Basis of competition
Global integrated network suppliers Huawei, ZTE, Nokia, Cisco These vendors combine optical equipment with broader carrier networking, software and service portfolios. They compete for nationwide access, metro and backbone tenders where operators want consistent support, large spare-part networks and integration with IP, mobile and fixed access systems. Geographic restrictions, installed base and procurement policy strongly influence which supplier can bid for a particular project.
Coherent optical transport specialists Ciena, Adtran These companies emphasize photonic line systems, coherent interfaces, optical transport platforms and operational automation. They are particularly relevant to 400G, 800G and 1.6T upgrade programmes where route engineering, spectrum efficiency and power per bit determine project economics. Their equipment can be deployed by incumbent carriers, cloud networks and wholesale fiber operators with diverse existing infrastructure.
Regional and system integration suppliers Fujitsu, FiberHome These suppliers serve regional carrier and infrastructure projects with optical transport, access and network integration capabilities. Fujitsu participates in coherent optical technology and high-capacity transport, while FiberHome offers a broad optical communications equipment portfolio. Customer access depends on qualification, local engineering resources and ability to provide reliable spares across long network service lives.

Key companies profiled

  • Huawei Technologies
  • ZTE Corporation
  • Nokia Corporation (including Infinera)
  • Ciena Corporation
  • Adtran
  • Cisco Systems
  • Fujitsu
  • FiberHome Telecommunication Technologies

Optical Communication Network Equipment Production Capacity Analysis

Production capacity in optical network equipment depends on more than printed circuit-board assembly. Coherent digital signal processors, wavelength-selective switches, laser packages, optical amplifiers, high-speed backplanes and network management firmware must be integrated into systems that pass environmental, interoperability and service-restoration tests. Capacity is distributed across specialist component plants, contract electronics manufacturers and final system assembly facilities, with qualification time often a more binding constraint than the number of available assembly lines.

Coherent line cards require high-performance DSP silicon, analog converters, modulators and optical engines that are sourced from specialized semiconductor and photonics suppliers. Higher baud rates raise thermal and signal-integrity challenges, while line cards must still meet electromagnetic compatibility and field-reliability specifications. A supplier can have available rack assembly space yet face a delivery bottleneck if one qualified laser, switch or DSP component has a long lead time.

Optical transport chassis are engineered around airflow, electrical distribution, cooling, cross-connect capacity and the ability to replace modules without interrupting service. Nokia describes its high-capacity 1830 PSS shelves as offering substantially greater density and lower power per bit than prior equipment. Such claims illustrate the design direction, but customers must test savings against their own wavelength loading, cooling conditions and the proportion of legacy equipment that can be retired.

Access equipment follows a different factory pattern from large backbone platforms. PON line terminals and subscriber units can be produced in higher volumes with standardized chipsets, while dense ROADM nodes and coherent long-haul systems require more optical calibration and configuration. Regional sourcing rules can encourage local assembly, but engineering support and firmware compatibility remain important after delivery because a network shelf may stay installed through several generations of pluggable optics.

Optical Communication Network Equipment Market Dynamics: Drivers, Restraints and Opportunities

Growth reflects stronger cloud interconnection, 5G transport expansion, optical access upgrades, coherent wavelength efficiency and utility or industrial digitization. These drivers face constraints from network construction budgets, specialist installation, thermal design and procurement security reviews. Together these forces favor high-capacity optical platforms where customers can justify lower power per bit and faster service activation, while leaving procurement sensitive to project timing.

MARKET DRIVERS

Drivers Impact Analysis*

Market Drivers Impact Rank CAGR Contribution (%) 2026–2028 2029–2031 2032–2034
AI and data-center connectivity demand High +3.30% High High High
5G and metro transport modernization Medium-High +2.80% High High Medium
Fiber access and PON equipment upgrades Medium +2.40% High Medium Medium
Coherent 400G/800G and 1.6T efficiency gains Low-Medium +2.10% Medium High High
Others (utility, rail and industrial digital networks) Low +1.80% Medium Medium Medium

AI traffic creates demand for dense optical routes

Large AI deployments exchange model checkpoints, storage objects and inference results between data-center campuses. The growth of these flows increases the value of optical systems that can activate 400G or 800G services quickly without leasing additional fiber. Coherent technology helps carriers serve cloud customers over existing rights of way, while the practical benefit depends on route length, signal quality and available optical spectrum.

5G backhaul concentrates traffic at metro aggregation nodes

Mobile networks add radio sites and distributed computing functions that must connect reliably to core and edge facilities. An optical aggregation platform can collect many 10G, 25G and 100G client services before handing traffic to higher-capacity coherent wavelengths. Carrier planning is driven by coverage, service demand and spectrum deployment, but once the access radio footprint is established, transport upgrades can become necessary to avoid congestion.

Fiber access upgrades refresh active network hardware

Fixed broadband operators can retain much of their installed passive optical distribution network while replacing central-office terminals and selected customer devices for higher service tiers. XGS-PON equipment offers a practical route beyond older GPON deployments, and dense access shelves can reduce space and energy costs in exchanges. Competition and customer take-up determine how quickly a carrier converts network coverage into actual equipment orders.

Coherent advances improve the capacity of existing fiber

New DSP generations, wavelength-selective switches and better optical monitoring allow higher throughput on suitable fiber routes without digging additional trenches. Adtran has described optical line-system support for services ranging from 400G toward 1.6T, while carrier tests demonstrate what is technically feasible. Actual capacity remains sensitive to span loss, nonlinearities and amplifier design, so the commercial advantage is greatest when equipment is carefully matched to route conditions.

MARKET RESTRAINTS

Restraints Impact Analysis*

Market Restraints Impact Rank CAGR Contribution (%) 2026–2028 2029–2031 2032–2034
Optical network deployment and capital costs High -1.40% High Medium Medium
Specialist commissioning and ROADM tuning Medium-High -1.00% High Medium Low
Coherent module power, heat and standards complexity Medium -0.80% Medium High High
Others (security review and sovereign procurement) Low -0.60% High Medium Medium
*CAGR contribution shows the percentage points each factor adds to or removes from the forecast CAGR for 2026–2034; driver contributions less restraint contributions equal the market CAGR. Period columns rate the strength of each factor in that window.

Construction costs can outweigh the equipment budget

New optical routes require civil works, permits, power, shelters, amplifiers and ongoing maintenance in addition to transport hardware. In difficult terrain or dense urban streets, the installed fiber cost may dominate the economics of adding capacity. Operators can delay equipment orders until a route is commissioned, or choose to upgrade wavelengths on an existing span rather than fund a completely new backbone.

Optical commissioning needs scarce specialist skills

Advanced ROADM networks require accurate fiber characterization, spectral planning, gain equalization and protection testing. Multivendor estates increase integration complexity because network controllers, alarm formats and coherent interfaces do not always behave identically in the field. A lack of trained installation teams can extend project schedules even when hardware has shipped, particularly for rural networks and international links where technicians must travel between remote sites.

Thermal and security requirements limit rapid replacement

Higher-speed coherent interfaces generate more heat and can exceed the power or airflow envelope of older shelves. Operators must also validate firmware, encryption, management access and national procurement requirements before introducing a new supplier. These checks protect critical networks but add testing cost and delay, especially when equipment controls government, utility or emergency communications and must remain supported for many years.

Currency and financing volatility affect project sequencing

Optical network operators in developing markets often purchase equipment in foreign currency while collecting service revenue locally. Higher borrowing costs, exchange-rate movements and uncertain subscriber uptake can force phased procurement even where technical demand is clear. Suppliers with flexible financing, regional inventory and maintenance partners may win contracts over faster platforms whose upfront cash requirements are too difficult for a carrier to absorb.

MARKET OPPORTUNITIES

Open optical line systems enable selective modernization

Operators with several equipment generations can use open line systems and interoperable coherent interfaces to replace individual wavelengths without dismantling a whole network. The opportunity is strongest where legacy fiber routes remain physically sound but electrical regeneration costs are rising. Multivendor acceptance tests remain essential, and equipment makers that provide transparent optical telemetry can help buyers reduce integration risk and avoid dependence on one chassis generation.

Subsea and international gateway upgrades expand addressable demand

Cable systems that remain mechanically sound can gain substantial capacity when terminal equipment and photonic line systems are modernized. International gateway operators also need protection routing and remote performance monitoring because repairs on subsea segments are costly. Higher capacity on existing routes supports cloud and enterprise services without requiring every consortium to commission a new wet plant, creating a specialized optical transport opportunity.

Industrial and utility networks need deterministic transport

Rail signaling, power grid protection, mining operations and port automation require communications paths with strong availability and security controls. Optical systems can separate mission-critical traffic from public internet services and maintain protected routes between control centers. Vendors able to meet environmental, safety and cybersecurity requirements can sell equipment into projects that are less dependent on residential broadband competition and may have long maintenance contracts.

Energy-efficient equipment can accelerate retirement of older shelves

Central offices and data-center interconnection facilities face rising cooling and power demands. Compact coherent platforms with greater capacity per rack unit can improve operating economics when heavily utilized, particularly where electricity is expensive or rack space is limited. The opportunity is not universal: an underused legacy node may be cheaper to retain, so suppliers need credible lifecycle calculations and migration plans rather than headline performance figures alone.

Optical Communication Network Equipment Supply Chain Analysis

The optical equipment supply chain connects photonic materials, DSP semiconductors, optical components and mechanical systems with platform assembly, carrier qualification and field deployment. A line-system vendor must coordinate coherent chips, modulators, wavelength-selective switches, optical amplifiers, network controllers and qualified manufacturing partners. The downstream customer buys operational capacity and service reliability rather than a collection of discrete components, so integration and support are major sources of commercial value.

UpstreamCoherent DSP ASICs, PON chipsets, laser and modulator packages, wavelength-selective switches, optical amplifiers, connectors and high-reliability fiber interfaces
Equipment assemblyLine-card and chassis production, photonic calibration, thermal validation, firmware integration, burn-in and interoperability qualification
Sales and installationCarrier tenders, hyperscaler procurement, systems integrators, wholesale fiber partners, engineering contractors and local maintenance teams
End usersTelecommunications operators, data-center networks, utilities, railway agencies, industrial campuses and international cable consortia

Upstream. Coherent optical engines depend on high-speed semiconductor processing, precision optics and specialized manufacturing capacity. A wavelength-selective switch must maintain low loss and stable channel control, while amplifiers and lasers need tight performance tolerances over temperature and operating life. Corning supplies fiber and cable that support the wider network but does not compete directly as a full optical transport system vendor; its role is complementary to the active platforms.

Manufacturing. System makers integrate photonic assemblies into line cards and chassis with power supplies, backplanes, cooling and control electronics. Factory testing covers optical signal quality, firmware, environmental performance and redundancy, followed by customer-specific configuration. Hardware shortages can delay an otherwise complete shipment when a qualified DSP or optical component is unavailable, and changing suppliers may trigger additional reliability tests rather than an immediate substitution.

Distribution. Large carriers and cloud operators generally purchase directly from qualified equipment manufacturers, often through multiyear framework agreements. Regional systems integrators provide fiber characterization, installation, commissioning and ongoing service where a supplier lacks a permanent local field organization. Delivery timing depends on civil works and access to live network maintenance windows, so finished shelves can remain in inventory until a route is ready for activation.

Downstream. Network owners evaluate total ownership costs over a long operating life, including electricity, rack space, spares, management integration and future wavelength upgrades. A platform that supports rapid service activation may be worth more than a cheaper chassis if it reduces outage risk and technician visits. Public utilities and railway operators place additional weight on deterministic recovery and security certification, while hyperscalers emphasize density and capacity per fiber.

Recent Developments in the Optical Communication Network Equipment Market

  • 29 September 2026 Deployment
    Constl and Ciena completed a 1.6 Tbps coherent transmission milestone on a live Indian long-haul network using WaveLogic 6 Extreme. The trial followed an earlier 1 Tbps achievement and demonstrates an upgrade path for national backbone equipment. It is a network-specific result rather than a guarantee that all installed fiber routes can operate at the same line rate, and commercial adoption still depends on route engineering and operator qualification. Source
  • 21 September 2026 Product
    ZTE described its HI-OTN optical transport platform at the Leading Lights 2026 awards, emphasizing full-band 800G and 1.6T capabilities alongside automated operations. The product direction reflects carrier demand for higher wavelength capacity and simpler optical management. Individual equipment claims should be evaluated against supported interfaces, amplifier configuration and real deployment conditions before being used as a planning specification. Source
  • 26 June 2026 Launch
    Huawei announced AI-OTN and AI-FAN solutions for backbone, metropolitan and access network scenarios. The offering links intelligent optical operations with network hardware upgrades and illustrates a vendor strategy of selling across several transport layers. Carrier adoption depends on installed network compatibility, software management requirements and local procurement rules, particularly where operators maintain multi-supplier optical estates. Source
  • 13 October 2025 Product
    Nokia introduced new 1830 PSS high-capacity shelves intended to increase optical transport density and reduce power per bit. The announcement is relevant to carriers whose older equipment occupies costly rack space or limits wavelength expansion. Achievable savings depend on the configuration and utilization of each network, and a chassis refresh typically requires service migration and acceptance testing before operational benefits are realized. Source
  • 26 March 2025 Interoperability
    Adtran demonstrated optical transport interoperability for 100G to 800G coherent interfaces at an Optical Internetworking Forum activity, using FSP 3000 line-system technology. Such testing helps operators evaluate open optical architectures and staged upgrades. A multivendor demonstration is an engineering milestone rather than a completed network contract, and carrier-specific trials are still required for protection behavior and long-term operational integration. Source
  • 28 February 2025 Acquisition
    Nokia completed its acquisition of Infinera, expanding its coherent optical and photonic networking capabilities. The transaction changes competitive reporting because Infinera is no longer an independent contemporary supplier alongside Nokia. For equipment buyers, the combined portfolio creates opportunities for wider transport offerings while also requiring attention to product-roadmap integration, software continuity and support for previously installed Infinera systems. Source

REPORT SCOPE & SEGMENTATION

Attribute Details
Study Period 2020–2034
Base Year 2025
Estimated Year 2026
Forecast Period 2026–2034
Historical Period 2020–2024
Market Size 2025 USD 28,541.4 million
Market Size 2026 USD 30,995.9 million
Market Size 2034 USD 59,971.3 million
Growth Rate CAGR of 8.6% from 2026–2034
Unit Value (USD Million)
Segmentation By Type, By Application, and By Region
By Type Access Network · Metropolitan Area Network · Trunk Network
By Application 5G Infrastructure · UHV · Intercity High-speed Rail and Intercity Rail Transit · Charging Piles for New Energy Vehicles · Big Data Center · Artificial Intelligence · Industrial Internet · Others
By Region Each region analyzed by Type, Application and Country
Asia-PacificChina, Japan, South Korea, India, Southeast Asia, Rest of APAC
North AmericaUnited States, Canada, Mexico
EuropeGermany, United Kingdom, France, Italy, Spain, Rest of Europe
South AmericaBrazil, Argentina, Chile, Rest of South America
Middle East & AfricaSaudi Arabia, United Arab Emirates, South Africa, Rest of Middle East and Africa
Key Companies Profiled Huawei Technologies, ZTE Corporation, Nokia Corporation (including Infinera), Ciena Corporation, Adtran, Cisco Systems, Fujitsu, FiberHome Telecommunication Technologies
Customization Scope Free report customization (equivalent to up to 4 analyst working days) with purchase. Addition or alteration to country, regional and segment scope.

Frequently Asked Questions

What is the global optical communication network equipment market size?

Revenue for active optical access, metro and trunk-network equipment reached USD 28,541.4 million in 2025 and is estimated at USD 30,995.9 million for 2026. The 2034 projection is USD 59,971.3 million, representing 8.6% CAGR through the 2026–2034 period. The value relates to network systems and associated equipment, excluding standalone fiber cable and general-purpose compute hardware.

Which type of optical network equipment has the largest share?

Access Network is the largest type at about ~38% of 2025 revenue, supported by optical line terminals, subscriber optical network terminals and upgrades to faster PON service tiers. Metropolitan Area Network systems follow at ~35%, while Trunk Network equipment contributes ~27%. Metro growth is linked to cloud interconnection and switching upgrades, whereas long-haul spending is influenced by major backbone project cycles.

How do optical transport networks differ from passive fiber?

An optical transport network uses active transponders, amplifiers, wavelength multiplexers, optical switches and management functions to carry and protect services over fiber. Passive cable and connectors provide the physical medium but do not themselves establish a managed wavelength service. The G.709 standard specifies optical transport framing and overhead, helping equipment from different suppliers carry client signals across interoperable network paths.

Why are data centers important buyers of optical equipment?

Big Data Center is the largest application group at roughly ~28% of equipment demand, because cloud campuses require reliable high-capacity links to other facilities and carrier exchanges. Artificial Intelligence adds another ~14% as distributed compute and storage traffic increases. Data-center operators prioritize 400G and 800G service availability, rack efficiency and fast activation rather than the number of residential access ports.

Which geographic market leads in optical network equipment?

Asia-Pacific leads at about ~39% of 2025 value, reflecting extensive access deployment, domestic equipment manufacturing and expanding cloud corridors. North America follows at ~25%, driven by carrier and hyperscale transport networks, and Europe accounts for ~22% on broadband upgrades and cross-border resilience. South America and the Middle East and Africa represent smaller but important equipment opportunities with different financing and deployment conditions.

Who are the leading manufacturers of optical transport systems?

Major suppliers include Huawei, ZTE, Nokia, Ciena, Adtran, Cisco, Fujitsu and FiberHome. Their strengths differ across access terminals, coherent transponders, ROADMs, routed optics and operational software. Nokia acquired Infinera in 2025, so the two should not be counted as independent current competitors. Corning primarily supplies fiber and cable inputs rather than complete active transport platforms.

What role does coherent optics play in network upgrades?

Coherent optics uses advanced modulation and digital signal processing to carry more information over an optical wavelength. It enables higher-capacity services on suitable fiber routes and can reduce the need to construct new paths. Performance depends on fiber quality, span length, optical noise, amplification and thermal design, so a successful 1.6 Tbps demonstration does not establish that every commercial network can support the same channel rate.

What restrains growth in optical communication equipment?

Network construction costs, financing constraints, skilled installation requirements and multivendor integration can delay orders. Higher-speed modules may also exceed the cooling or electrical capacity of older chassis, forcing additional upgrades. Public-sector procurement adds security and sovereign sourcing reviews, while operators in emerging markets must manage imported equipment prices and the timing of fiber construction before commissioning active optical platforms.

What opportunities exist beyond traditional telecom carriers?

Utilities, rail networks, industrial parks, data-center operators and international cable consortia need resilient optical connectivity. These customers buy different combinations of access shelves, wavelength systems and protected transport links. Equipment makers that offer open interfaces, secure management, long maintenance support and measurable energy savings can address projects that are less dependent on consumer broadband competition.

What does the optical communication network equipment study include?

The study covers 2020–2034, with 2025 as the base year and 2026 as the estimated year. It provides value analysis in USD million across Access Network, Metropolitan Area Network and Trunk Network types and eight application categories, including 5G, UHV, rail, charging, data centers, AI and industrial internet. Geographic coverage spans Asia-Pacific, North America, Europe, South America and the Middle East and Africa.

Research Sources & Evidence Base

View research sources used for this overview
  1. Ciena. Vodafone Idea deploys WaveLogic 6 Extreme, 31 March 2026 announcement of 1.6 Tbps trial and 800G service readiness.
  2. Ciena. Constl and Ciena reach 1.6 Tbps, 29 September 2026 live-network long-haul transmission milestone.
  3. Nokia. New high-capacity 1830 PSS shelves, 13 October 2025 platform density and energy efficiency announcement.
  4. Nokia. Nokia completes Infinera acquisition, 28 February 2025 corporate ownership and optical portfolio update.
  5. Adtran. FSP 3000 IP optical line system, 25 March 2025 400G–1.6T line-system technology.
  6. Adtran. OIF coherent interoperability demonstration, 26 March 2025 optical interface interoperability.
  7. Cisco. 800G ZR and ZR+ coherent optics, Technical documentation for coherent pluggable equipment.
  8. ZTE. HI-OTN platform announcement, 21 September 2026 optical transport equipment capabilities.
  9. ZTE. Türk Telekom C+L band optical trial, 2 March 2026 optical network demonstration.
  10. ZTE. ZXONE 9700 optical transport platform, Product specification for metro and backbone equipment.
  11. International Telecommunication Union. Facts and Figures 2025, Global internet usage context, 17 November 2025.
  12. International Telecommunication Union. ITU-T G.709 optical transport networks, Technical recommendation on OTN framing and interoperability.
  13. European Commission. Digital connectivity support, Policy framework for European broadband investment.
  14. Corning. Corning and Broadcom collaboration, 2025 upstream optical interconnection development.
  15. Ciena. 1 Tbps over 1,450 km, 4 December 2025 long-haul route performance announcement.
  16. ZTE. 1.6T DWDM trial, 2 April 2025 C+L band transmission announcement.
  17. Huawei. AI-OTN and AI-FAN announcement, 26 June 2026 optical network product update.
  18. Huawei. Next-generation optical systems, 2 March 2026 optical access and backbone solutions.
  19. Huawei. Optical target networks, 2 March 2026 400G/800G transport architectures.
  20. Corning. Optical communications business update, 18 March 2025 fiber and cable demand context.
  21. Fujitsu. 1FINITY coherent optical product, 3 March 2025 optical transport and coherent interfaces.
Optical Communication Network Equipment Market, Size, Trends, Business Strategies 2026-2034

Get Sample Report PDF for Exclusive Insights

Report Sample Includes

  • Table of Contents
  • List of Tables & Figures
  • Charts, Research Methodology, and more...

PDF Icon Download Sample Report PDF

Download Sample Report

Table of Content

Table of Contents
1 Research Methodology and Statistical Scope
1.1 Market Definition and Statistical Scope of Optical Communication Network Equipment
1.2 Key Market Segments
1.2.1 Optical Communication Network Equipment Segment by Type
1.2.2 Optical Communication Network Equipment Segment by Application
1.3 Methodology & Sources of Information
1.3.1 Research Methodology
1.3.2 Research Process
1.3.3 Market Breakdown and Data Triangulation
1.3.4 Base Year
1.3.5 Report Assumptions & Caveats
2 Optical Communication Network Equipment Market Overview
2.1 Global Market Overview
2.1.1 Global Optical Communication Network Equipment Market Size (M USD) Estimates and Forecasts (2026-2034)
2.1.2 Global Optical Communication Network Equipment Sales Estimates and Forecasts (2026-2034)
2.2 Market Segment Executive Summary
2.3 Global Market Size by Region
3 Optical Communication Network Equipment Market Competitive Landscape
3.1 Global Optical Communication Network Equipment Sales by Manufacturers (2019-2025)
3.2 Global Optical Communication Network Equipment Revenue Market Share by Manufacturers (2019-2025)
3.3 Optical Communication Network Equipment Market Share by Company Type (Tier 1, Tier 2, and Tier 3)
3.4 Global Optical Communication Network Equipment Average Price by Manufacturers (2019-2025)
3.5 Manufacturers Optical Communication Network Equipment Sales Sites, Area Served, Product Type
3.6 Optical Communication Network Equipment Market Competitive Situation and Trends
3.6.1 Optical Communication Network Equipment Market Concentration Rate
3.6.2 Global 5 and 10 Largest Optical Communication Network Equipment Players Market Share by Revenue
3.6.3 Mergers & Acquisitions, Expansion
4 Optical Communication Network Equipment Industry Chain Analysis
4.1 Optical Communication Network Equipment Industry Chain Analysis
4.2 Market Overview of Key Raw Materials
4.3 Midstream Market Analysis
4.4 Downstream Customer Analysis
5 The Development and Dynamics of Optical Communication Network Equipment Market
5.1 Key Development Trends
5.2 Driving Factors
5.3 Market Challenges
5.4 Market Restraints
5.5 Industry News
5.5.1 New Product Developments
5.5.2 Mergers & Acquisitions
5.5.3 Expansions
5.5.4 Collaboration/Supply Contracts
5.6 Industry Policies
6 Optical Communication Network Equipment Market Segmentation by Type
6.1 Evaluation Matrix of Segment Market Development Potential (Type)
6.2 Global Optical Communication Network Equipment Sales Market Share by Type (2019-2025)
6.3 Global Optical Communication Network Equipment Market Size Market Share by Type (2019-2025)
6.4 Global Optical Communication Network Equipment Price by Type (2019-2025)
7 Optical Communication Network Equipment Market Segmentation by Application
7.1 Evaluation Matrix of Segment Market Development Potential (Application)
7.2 Global Optical Communication Network Equipment Market Sales by Application (2019-2025)
7.3 Global Optical Communication Network Equipment Market Size (M USD) by Application (2019-2025)
7.4 Global Optical Communication Network Equipment Sales Growth Rate by Application (2019-2025)
8 Optical Communication Network Equipment Market Segmentation by Region
8.1 Global Optical Communication Network Equipment Sales by Region
8.1.1 Global Optical Communication Network Equipment Sales by Region
8.1.2 Global Optical Communication Network Equipment Sales Market Share by Region
8.2 North America
8.2.1 North America Optical Communication Network Equipment Sales by Country
8.2.2 U.S.
8.2.3 Canada
8.2.4 Mexico
8.3 Europe
8.3.1 Europe Optical Communication Network Equipment Sales by Country
8.3.2 Germany
8.3.3 France
8.3.4 U.K.
8.3.5 Italy
8.3.6 Russia
8.4 Asia Pacific
8.4.1 Asia Pacific Optical Communication Network Equipment Sales by Region
8.4.2 China
8.4.3 Japan
8.4.4 South Korea
8.4.5 India
8.4.6 Southeast Asia
8.5 South America
8.5.1 South America Optical Communication Network Equipment Sales by Country
8.5.2 Brazil
8.5.3 Argentina
8.5.4 Columbia
8.6 Middle East and Africa
8.6.1 Middle East and Africa Optical Communication Network Equipment Sales by Region
8.6.2 Saudi Arabia
8.6.3 UAE
8.6.4 Egypt
8.6.5 Nigeria
8.6.6 South Africa
9 Key Companies Profile
9.1 Huawei
9.1.1 Huawei Optical Communication Network Equipment Basic Information
9.1.2 Huawei Optical Communication Network Equipment Product Overview
9.1.3 Huawei Optical Communication Network Equipment Product Market Performance
9.1.4 Huawei Business Overview
9.1.5 Huawei Optical Communication Network Equipment SWOT Analysis
9.1.6 Huawei Recent Developments
9.2 ZTE
9.2.1 ZTE Optical Communication Network Equipment Basic Information
9.2.2 ZTE Optical Communication Network Equipment Product Overview
9.2.3 ZTE Optical Communication Network Equipment Product Market Performance
9.2.4 ZTE Business Overview
9.2.5 ZTE Optical Communication Network Equipment SWOT Analysis
9.2.6 ZTE Recent Developments
9.3 ALU
9.3.1 ALU Optical Communication Network Equipment Basic Information
9.3.2 ALU Optical Communication Network Equipment Product Overview
9.3.3 ALU Optical Communication Network Equipment Product Market Performance
9.3.4 ALU Optical Communication Network Equipment SWOT Analysis
9.3.5 ALU Business Overview
9.3.6 ALU Recent Developments
9.4 Fiber Home
9.4.1 Fiber Home Optical Communication Network Equipment Basic Information
9.4.2 Fiber Home Optical Communication Network Equipment Product Overview
9.4.3 Fiber Home Optical Communication Network Equipment Product Market Performance
9.4.4 Fiber Home Business Overview
9.4.5 Fiber Home Recent Developments
9.5 Cisco Systems
9.5.1 Cisco Systems Optical Communication Network Equipment Basic Information
9.5.2 Cisco Systems Optical Communication Network Equipment Product Overview
9.5.3 Cisco Systems Optical Communication Network Equipment Product Market Performance
9.5.4 Cisco Systems Business Overview
9.5.5 Cisco Systems Recent Developments
9.6 Inc.
9.6.1 Inc. Optical Communication Network Equipment Basic Information
9.6.2 Inc. Optical Communication Network Equipment Product Overview
9.6.3 Inc. Optical Communication Network Equipment Product Market Performance
9.6.4 Inc. Business Overview
9.6.5 Inc. Recent Developments
9.7 Nokia
9.7.1 Nokia Optical Communication Network Equipment Basic Information
9.7.2 Nokia Optical Communication Network Equipment Product Overview
9.7.3 Nokia Optical Communication Network Equipment Product Market Performance
9.7.4 Nokia Business Overview
9.7.5 Nokia Recent Developments
9.8 Fujits
9.8.1 Fujits Optical Communication Network Equipment Basic Information
9.8.2 Fujits Optical Communication Network Equipment Product Overview
9.8.3 Fujits Optical Communication Network Equipment Product Market Performance
9.8.4 Fujits Business Overview
9.8.5 Fujits Recent Developments
9.9 Infinera
9.9.1 Infinera Optical Communication Network Equipment Basic Information
9.9.2 Infinera Optical Communication Network Equipment Product Overview
9.9.3 Infinera Optical Communication Network Equipment Product Market Performance
9.9.4 Infinera Business Overview
9.9.5 Infinera Recent Developments
9.10 Ciena
9.10.1 Ciena Optical Communication Network Equipment Basic Information
9.10.2 Ciena Optical Communication Network Equipment Product Overview
9.10.3 Ciena Optical Communication Network Equipment Product Market Performance
9.10.4 Ciena Business Overview
9.10.5 Ciena Recent Developments
9.11 Corning
9.11.1 Corning Optical Communication Network Equipment Basic Information
9.11.2 Corning Optical Communication Network Equipment Product Overview
9.11.3 Corning Optical Communication Network Equipment Product Market Performance
9.11.4 Corning Business Overview
9.11.5 Corning Recent Developments
9.12 Adtran
9.12.1 Adtran Optical Communication Network Equipment Basic Information
9.12.2 Adtran Optical Communication Network Equipment Product Overview
9.12.3 Adtran Optical Communication Network Equipment Product Market Performance
9.12.4 Adtran Business Overview
9.12.5 Adtran Recent Developments
9.13 Fujitsu
9.13.1 Fujitsu Optical Communication Network Equipment Basic Information
9.13.2 Fujitsu Optical Communication Network Equipment Product Overview
9.13.3 Fujitsu Optical Communication Network Equipment Product Market Performance
9.13.4 Fujitsu Business Overview
9.13.5 Fujitsu Recent Developments
9.14 Ceragon Networks
9.14.1 Ceragon Networks Optical Communication Network Equipment Basic Information
9.14.2 Ceragon Networks Optical Communication Network Equipment Product Overview
9.14.3 Ceragon Networks Optical Communication Network Equipment Product Market Performance
9.14.4 Ceragon Networks Business Overview
9.14.5 Ceragon Networks Recent Developments
10 Optical Communication Network Equipment Market Forecast by Region
10.1 Global Optical Communication Network Equipment Market Size Forecast
10.2 Global Optical Communication Network Equipment Market Forecast by Region
10.2.1 North America Market Size Forecast by Country
10.2.2 Europe Optical Communication Network Equipment Market Size Forecast by Country
10.2.3 Asia Pacific Optical Communication Network Equipment Market Size Forecast by Region
10.2.4 South America Optical Communication Network Equipment Market Size Forecast by Country
10.2.5 Middle East and Africa Forecasted Consumption of Optical Communication Network Equipment by Country
11 Forecast Market by Type and by Application (2025-2030)
11.1 Global Optical Communication Network Equipment Market Forecast by Type (2025-2030)
11.1.1 Global Forecasted Sales of Optical Communication Network Equipment by Type (2025-2030)
11.1.2 Global Optical Communication Network Equipment Market Size Forecast by Type (2025-2030)
11.1.3 Global Forecasted Price of Optical Communication Network Equipment by Type (2025-2030)
11.2 Global Optical Communication Network Equipment Market Forecast by Application (2025-2030)
11.2.1 Global Optical Communication Network Equipment Sales (K Units) Forecast by Application
11.2.2 Global Optical Communication Network Equipment Market Size (M USD) Forecast by Application (2025-2030)
12 Conclusion and Key FindingsList of Tables
Table 1. Introduction of the Type
Table 2. Introduction of the Application
Table 3. Market Size (M USD) Segment Executive Summary
Table 4. Optical Communication Network Equipment Market Size Comparison by Region (M USD)
Table 5. Global Optical Communication Network Equipment Sales (K Units) by Manufacturers (2019-2025)
Table 6. Global Optical Communication Network Equipment Sales Market Share by Manufacturers (2019-2025)
Table 7. Global Optical Communication Network Equipment Revenue (M USD) by Manufacturers (2019-2025)
Table 8. Global Optical Communication Network Equipment Revenue Share by Manufacturers (2019-2025)
Table 9. Company Type (Tier 1, Tier 2, and Tier 3) & (based on the Revenue in Optical Communication Network Equipment as of 2022)
Table 10. Global Market Optical Communication Network Equipment Average Price (USD/Unit) of Key Manufacturers (2019-2025)
Table 11. Manufacturers Optical Communication Network Equipment Sales Sites and Area Served
Table 12. Manufacturers Optical Communication Network Equipment Product Type
Table 13. Global Optical Communication Network Equipment Manufacturers Market Concentration Ratio (CR5 and HHI)
Table 14. Mergers & Acquisitions, Expansion Plans
Table 15. Industry Chain Map of Optical Communication Network Equipment
Table 16. Market Overview of Key Raw Materials
Table 17. Midstream Market Analysis
Table 18. Downstream Customer Analysis
Table 19. Key Development Trends
Table 20. Driving Factors
Table 21. Optical Communication Network Equipment Market Challenges
Table 22. Global Optical Communication Network Equipment Sales by Type (K Units)
Table 23. Global Optical Communication Network Equipment Market Size by Type (M USD)
Table 24. Global Optical Communication Network Equipment Sales (K Units) by Type (2019-2025)
Table 25. Global Optical Communication Network Equipment Sales Market Share by Type (2019-2025)
Table 26. Global Optical Communication Network Equipment Market Size (M USD) by Type (2019-2025)
Table 27. Global Optical Communication Network Equipment Market Size Share by Type (2019-2025)
Table 28. Global Optical Communication Network Equipment Price (USD/Unit) by Type (2019-2025)
Table 29. Global Optical Communication Network Equipment Sales (K Units) by Application
Table 30. Global Optical Communication Network Equipment Market Size by Application
Table 31. Global Optical Communication Network Equipment Sales by Application (2019-2025) & (K Units)
Table 32. Global Optical Communication Network Equipment Sales Market Share by Application (2019-2025)
Table 33. Global Optical Communication Network Equipment Sales by Application (2019-2025) & (M USD)
Table 34. Global Optical Communication Network Equipment Market Share by Application (2019-2025)
Table 35. Global Optical Communication Network Equipment Sales Growth Rate by Application (2019-2025)
Table 36. Global Optical Communication Network Equipment Sales by Region (2019-2025) & (K Units)
Table 37. Global Optical Communication Network Equipment Sales Market Share by Region (2019-2025)
Table 38. North America Optical Communication Network Equipment Sales by Country (2019-2025) & (K Units)
Table 39. Europe Optical Communication Network Equipment Sales by Country (2019-2025) & (K Units)
Table 40. Asia Pacific Optical Communication Network Equipment Sales by Region (2019-2025) & (K Units)
Table 41. South America Optical Communication Network Equipment Sales by Country (2019-2025) & (K Units)
Table 42. Middle East and Africa Optical Communication Network Equipment Sales by Region (2019-2025) & (K Units)
Table 43. Huawei Optical Communication Network Equipment Basic Information
Table 44. Huawei Optical Communication Network Equipment Product Overview
Table 45. Huawei Optical Communication Network Equipment Sales (K Units), Revenue (M USD), Price (USD/Unit) and Gross Margin (2019-2025)
Table 46. Huawei Business Overview
Table 47. Huawei Optical Communication Network Equipment SWOT Analysis
Table 48. Huawei Recent Developments
Table 49. ZTE Optical Communication Network Equipment Basic Information
Table 50. ZTE Optical Communication Network Equipment Product Overview
Table 51. ZTE Optical Communication Network Equipment Sales (K Units), Revenue (M USD), Price (USD/Unit) and Gross Margin (2019-2025)
Table 52. ZTE Business Overview
Table 53. ZTE Optical Communication Network Equipment SWOT Analysis
Table 54. ZTE Recent Developments
Table 55. ALU Optical Communication Network Equipment Basic Information
Table 56. ALU Optical Communication Network Equipment Product Overview
Table 57. ALU Optical Communication Network Equipment Sales (K Units), Revenue (M USD), Price (USD/Unit) and Gross Margin (2019-2025)
Table 58. ALU Optical Communication Network Equipment SWOT Analysis
Table 59. ALU Business Overview
Table 60. ALU Recent Developments
Table 61. Fiber Home Optical Communication Network Equipment Basic Information
Table 62. Fiber Home Optical Communication Network Equipment Product Overview
Table 63. Fiber Home Optical Communication Network Equipment Sales (K Units), Revenue (M USD), Price (USD/Unit) and Gross Margin (2019-2025)
Table 64. Fiber Home Business Overview
Table 65. Fiber Home Recent Developments
Table 66. Cisco Systems Optical Communication Network Equipment Basic Information
Table 67. Cisco Systems Optical Communication Network Equipment Product Overview
Table 68. Cisco Systems Optical Communication Network Equipment Sales (K Units), Revenue (M USD), Price (USD/Unit) and Gross Margin (2019-2025)
Table 69. Cisco Systems Business Overview
Table 70. Cisco Systems Recent Developments
Table 71. Inc. Optical Communication Network Equipment Basic Information
Table 72. Inc. Optical Communication Network Equipment Product Overview
Table 73. Inc. Optical Communication Network Equipment Sales (K Units), Revenue (M USD), Price (USD/Unit) and Gross Margin (2019-2025)
Table 74. Inc. Business Overview
Table 75. Inc. Recent Developments
Table 76. Nokia Optical Communication Network Equipment Basic Information
Table 77. Nokia Optical Communication Network Equipment Product Overview
Table 78. Nokia Optical Communication Network Equipment Sales (K Units), Revenue (M USD), Price (USD/Unit) and Gross Margin (2019-2025)
Table 79. Nokia Business Overview
Table 80. Nokia Recent Developments
Table 81. Fujits Optical Communication Network Equipment Basic Information
Table 82. Fujits Optical Communication Network Equipment Product Overview
Table 83. Fujits Optical Communication Network Equipment Sales (K Units), Revenue (M USD), Price (USD/Unit) and Gross Margin (2019-2025)
Table 84. Fujits Business Overview
Table 85. Fujits Recent Developments
Table 86. Infinera Optical Communication Network Equipment Basic Information
Table 87. Infinera Optical Communication Network Equipment Product Overview
Table 88. Infinera Optical Communication Network Equipment Sales (K Units), Revenue (M USD), Price (USD/Unit) and Gross Margin (2019-2025)
Table 89. Infinera Business Overview
Table 90. Infinera Recent Developments
Table 91. Ciena Optical Communication Network Equipment Basic Information
Table 92. Ciena Optical Communication Network Equipment Product Overview
Table 93. Ciena Optical Communication Network Equipment Sales (K Units), Revenue (M USD), Price (USD/Unit) and Gross Margin (2019-2025)
Table 94. Ciena Business Overview
Table 95. Ciena Recent Developments
Table 96. Corning Optical Communication Network Equipment Basic Information
Table 97. Corning Optical Communication Network Equipment Product Overview
Table 98. Corning Optical Communication Network Equipment Sales (K Units), Revenue (M USD), Price (USD/Unit) and Gross Margin (2019-2025)
Table 99. Corning Business Overview
Table 100. Corning Recent Developments
Table 101. Adtran Optical Communication Network Equipment Basic Information
Table 102. Adtran Optical Communication Network Equipment Product Overview
Table 103. Adtran Optical Communication Network Equipment Sales (K Units), Revenue (M USD), Price (USD/Unit) and Gross Margin (2019-2025)
Table 104. Adtran Business Overview
Table 105. Adtran Recent Developments
Table 106. Fujitsu Optical Communication Network Equipment Basic Information
Table 107. Fujitsu Optical Communication Network Equipment Product Overview
Table 108. Fujitsu Optical Communication Network Equipment Sales (K Units), Revenue (M USD), Price (USD/Unit) and Gross Margin (2019-2025)
Table 109. Fujitsu Business Overview
Table 110. Fujitsu Recent Developments
Table 111. Ceragon Networks Optical Communication Network Equipment Basic Information
Table 112. Ceragon Networks Optical Communication Network Equipment Product Overview
Table 113. Ceragon Networks Optical Communication Network Equipment Sales (K Units), Revenue (M USD), Price (USD/Unit) and Gross Margin (2019-2025)
Table 114. Ceragon Networks Business Overview
Table 115. Ceragon Networks Recent Developments
Table 116. Global Optical Communication Network Equipment Sales Forecast by Region (2025-2030) & (K Units)
Table 117. Global Optical Communication Network Equipment Market Size Forecast by Region (2025-2030) & (M USD)
Table 118. North America Optical Communication Network Equipment Sales Forecast by Country (2025-2030) & (K Units)
Table 119. North America Optical Communication Network Equipment Market Size Forecast by Country (2025-2030) & (M USD)
Table 120. Europe Optical Communication Network Equipment Sales Forecast by Country (2025-2030) & (K Units)
Table 121. Europe Optical Communication Network Equipment Market Size Forecast by Country (2025-2030) & (M USD)
Table 122. Asia Pacific Optical Communication Network Equipment Sales Forecast by Region (2025-2030) & (K Units)
Table 123. Asia Pacific Optical Communication Network Equipment Market Size Forecast by Region (2025-2030) & (M USD)
Table 124. South America Optical Communication Network Equipment Sales Forecast by Country (2025-2030) & (K Units)
Table 125. South America Optical Communication Network Equipment Market Size Forecast by Country (2025-2030) & (M USD)
Table 126. Middle East and Africa Optical Communication Network Equipment Consumption Forecast by Country (2025-2030) & (Units)
Table 127. Middle East and Africa Optical Communication Network Equipment Market Size Forecast by Country (2025-2030) & (M USD)
Table 128. Global Optical Communication Network Equipment Sales Forecast by Type (2025-2030) & (K Units)
Table 129. Global Optical Communication Network Equipment Market Size Forecast by Type (2025-2030) & (M USD)
Table 130. Global Optical Communication Network Equipment Price Forecast by Type (2025-2030) & (USD/Unit)
Table 131. Global Optical Communication Network Equipment Sales (K Units) Forecast by Application (2025-2030)
Table 132. Global Optical Communication Network Equipment Market Size Forecast by Application (2025-2030) & (M USD)
List of Figures
Figure 1. Product Picture of Optical Communication Network Equipment
Figure 2. Data Triangulation
Figure 3. Key Caveats
Figure 4. Global Optical Communication Network Equipment Market Size (M USD), 2026-2034
Figure 5. Global Optical Communication Network Equipment Market Size (M USD) (2026-2034)
Figure 6. Global Optical Communication Network Equipment Sales (K Units) & (2026-2034)
Figure 7. Evaluation Matrix of Segment Market Development Potential (Type)
Figure 8. Evaluation Matrix of Segment Market Development Potential (Application)
Figure 9. Evaluation Matrix of Regional Market Development Potential
Figure 10. Optical Communication Network Equipment Market Size by Country (M USD)
Figure 11. Optical Communication Network Equipment Sales Share by Manufacturers in 2023
Figure 12. Global Optical Communication Network Equipment Revenue Share by Manufacturers in 2023
Figure 13. Optical Communication Network Equipment Market Share by Company Type (Tier 1, Tier 2 and Tier 3): 2023
Figure 14. Global Market Optical Communication Network Equipment Average Price (USD/Unit) of Key Manufacturers in 2023
Figure 15. The Global 5 and 10 Largest Players: Market Share by Optical Communication Network Equipment Revenue in 2023
Figure 16. Evaluation Matrix of Segment Market Development Potential (Type)
Figure 17. Global Optical Communication Network Equipment Market Share by Type
Figure 18. Sales Market Share of Optical Communication Network Equipment by Type (2019-2025)
Figure 19. Sales Market Share of Optical Communication Network Equipment by Type in 2023
Figure 20. Market Size Share of Optical Communication Network Equipment by Type (2019-2025)
Figure 21. Market Size Market Share of Optical Communication Network Equipment by Type in 2023
Figure 22. Evaluation Matrix of Segment Market Development Potential (Application)
Figure 23. Global Optical Communication Network Equipment Market Share by Application
Figure 24. Global Optical Communication Network Equipment Sales Market Share by Application (2019-2025)
Figure 25. Global Optical Communication Network Equipment Sales Market Share by Application in 2023
Figure 26. Global Optical Communication Network Equipment Market Share by Application (2019-2025)
Figure 27. Global Optical Communication Network Equipment Market Share by Application in 2023
Figure 28. Global Optical Communication Network Equipment Sales Growth Rate by Application (2019-2025)
Figure 29. Global Optical Communication Network Equipment Sales Market Share by Region (2019-2025)
Figure 30. North America Optical Communication Network Equipment Sales and Growth Rate (2019-2025) & (K Units)
Figure 31. North America Optical Communication Network Equipment Sales Market Share by Country in 2023
Figure 32. U.S. Optical Communication Network Equipment Sales and Growth Rate (2019-2025) & (K Units)
Figure 33. Canada Optical Communication Network Equipment Sales (K Units) and Growth Rate (2019-2025)
Figure 34. Mexico Optical Communication Network Equipment Sales (Units) and Growth Rate (2019-2025)
Figure 35. Europe Optical Communication Network Equipment Sales and Growth Rate (2019-2025) & (K Units)
Figure 36. Europe Optical Communication Network Equipment Sales Market Share by Country in 2023
Figure 37. Germany Optical Communication Network Equipment Sales and Growth Rate (2019-2025) & (K Units)
Figure 38. France Optical Communication Network Equipment Sales and Growth Rate (2019-2025) & (K Units)
Figure 39. U.K. Optical Communication Network Equipment Sales and Growth Rate (2019-2025) & (K Units)
Figure 40. Italy Optical Communication Network Equipment Sales and Growth Rate (2019-2025) & (K Units)
Figure 41. Russia Optical Communication Network Equipment Sales and Growth Rate (2019-2025) & (K Units)
Figure 42. Asia Pacific Optical Communication Network Equipment Sales and Growth Rate (K Units)
Figure 43. Asia Pacific Optical Communication Network Equipment Sales Market Share by Region in 2023
Figure 44. China Optical Communication Network Equipment Sales and Growth Rate (2019-2025) & (K Units)
Figure 45. Japan Optical Communication Network Equipment Sales and Growth Rate (2019-2025) & (K Units)
Figure 46. South Korea Optical Communication Network Equipment Sales and Growth Rate (2019-2025) & (K Units)
Figure 47. India Optical Communication Network Equipment Sales and Growth Rate (2019-2025) & (K Units)
Figure 48. Southeast Asia Optical Communication Network Equipment Sales and Growth Rate (2019-2025) & (K Units)
Figure 49. South America Optical Communication Network Equipment Sales and Growth Rate (K Units)
Figure 50. South America Optical Communication Network Equipment Sales Market Share by Country in 2023
Figure 51. Brazil Optical Communication Network Equipment Sales and Growth Rate (2019-2025) & (K Units)
Figure 52. Argentina Optical Communication Network Equipment Sales and Growth Rate (2019-2025) & (K Units)
Figure 53. Columbia Optical Communication Network Equipment Sales and Growth Rate (2019-2025) & (K Units)
Figure 54. Middle East and Africa Optical Communication Network Equipment Sales and Growth Rate (K Units)
Figure 55. Middle East and Africa Optical Communication Network Equipment Sales Market Share by Region in 2023
Figure 56. Saudi Arabia Optical Communication Network Equipment Sales and Growth Rate (2019-2025) & (K Units)
Figure 57. UAE Optical Communication Network Equipment Sales and Growth Rate (2019-2025) & (K Units)
Figure 58. Egypt Optical Communication Network Equipment Sales and Growth Rate (2019-2025) & (K Units)
Figure 59. Nigeria Optical Communication Network Equipment Sales and Growth Rate (2019-2025) & (K Units)
Figure 60. South Africa Optical Communication Network Equipment Sales and Growth Rate (2019-2025) & (K Units)
Figure 61. Global Optical Communication Network Equipment Sales Forecast by Volume (2026-2034) & (K Units)
Figure 62. Global Optical Communication Network Equipment Market Size Forecast by Value (2026-2034) & (M USD)
Figure 63. Global Optical Communication Network Equipment Sales Market Share Forecast by Type (2025-2030)
Figure 64. Global Optical Communication Network Equipment Market Share Forecast by Type (2025-2030)
Figure 65. Global Optical Communication Network Equipment Sales Forecast by Application (2025-2030)
Figure 66. Global Optical Communication Network Equipment Market Share Forecast by Application (2025-2030)