Networking Equipment Market, Global Business Strategies 2025-2032

Networking Equipment Market size was valued at USD 101.18 billion in 2024 to USD 139.07 billion by 2032, exhibiting a CAGR of 4.8% during the forecast period

PDF Icon Download Sample Report PDF
  • Quick Dispatch

    All Orders

  • Secure Payment

    100% Secure Payment

Price range: $1,500.00 through $4,250.00

Clear

MARKET INSIGHTS

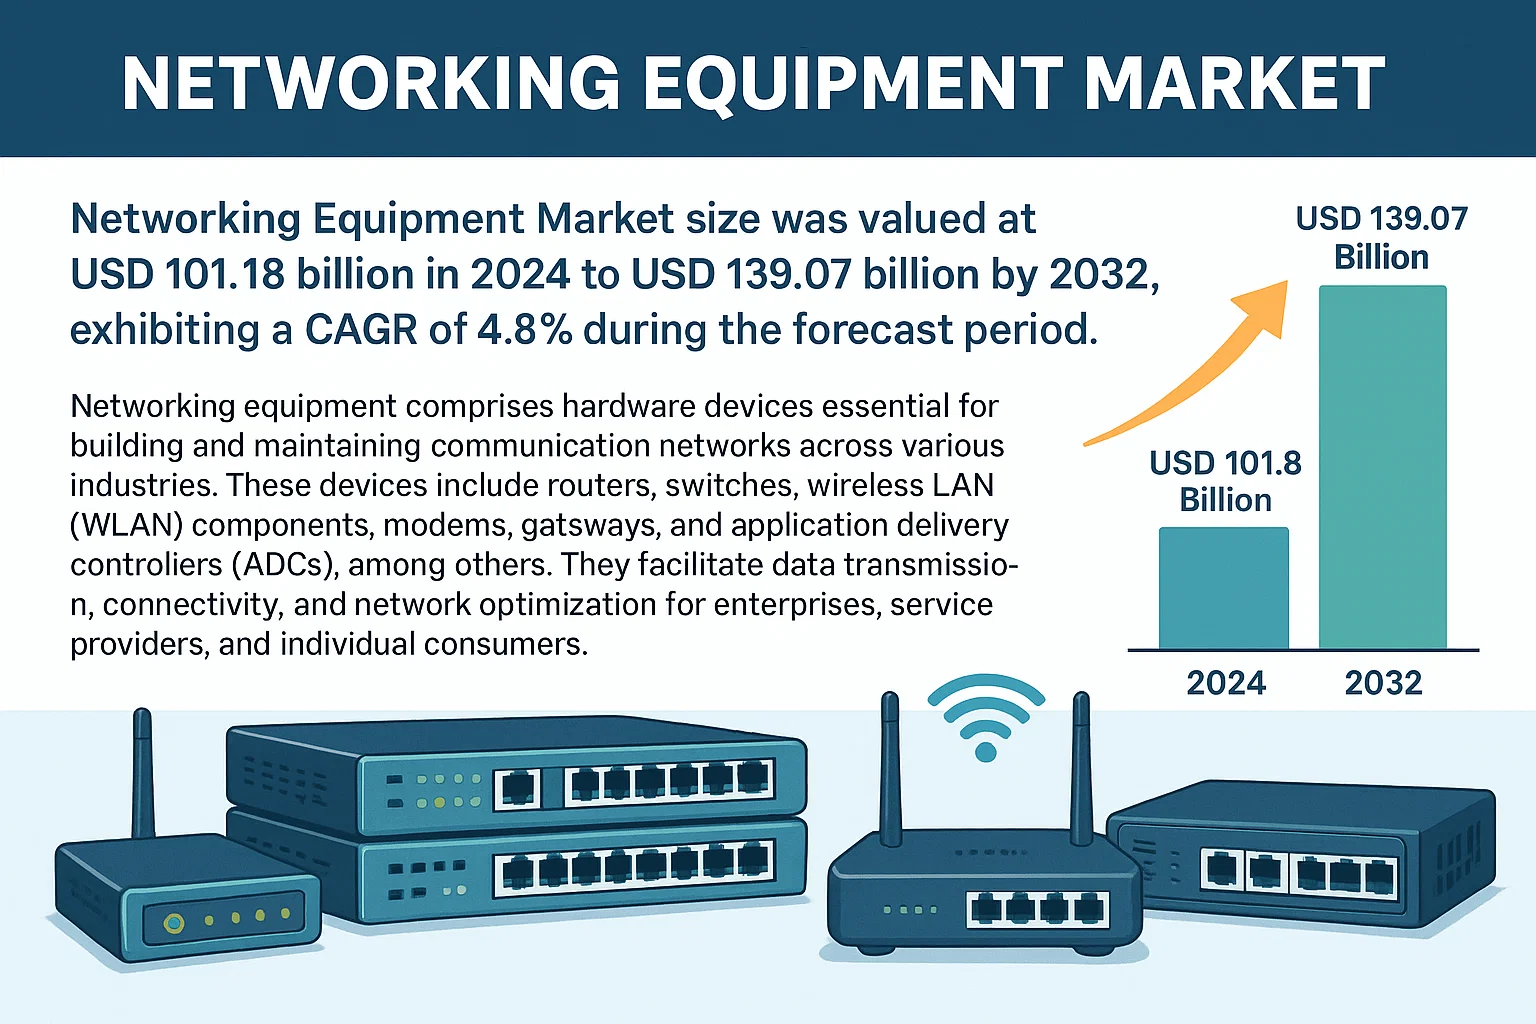
Global Networking Equipment Market size was valued at USD 101.18 billion in 2024 to USD 139.07 billion by 2032, exhibiting a CAGR of 4.8% during the forecast period.

Networking equipment comprises hardware devices essential for building and maintaining communication networks across various industries. These devices include routers, switches, wireless LAN (WLAN) components, modems, gateways, and application delivery controllers (ADCs), among others. They facilitate data transmission, connectivity, and network optimization for enterprises, service providers, and individual consumers.

The market is driven by increasing demand for high-speed internet, cloud computing adoption, and the rapid expansion of 5G networks. However, supply chain disruptions and geopolitical tensions have posed challenges for manufacturers. Key players like Cisco, Juniper Networks, and Huawei dominate the market, collectively holding over 40% of global revenue share. Recent technological advancements in software-defined networking (SDN) and network function virtualization (NFV) are further reshaping industry dynamics.

Networking Equipment Market

MARKET DRIVERS


5G Network Expansion Accelerates Infrastructure Demand

The global rollout of 5G networks continues to drive significant investment in networking equipment, with telecom operators investing over $200 billion annually in next-generation infrastructure. Mobile operators are deploying 5G base stations at a record pace, requiring upgraded routers, switches, and network controllers to handle increased bandwidth demands and lower latency requirements.

Hybrid Work Models Reshape Enterprise Networking

The permanent shift toward hybrid work arrangements has created sustained demand for advanced enterprise networking solutions. Companies are investing heavily in SD-WAN solutions, with the market growing at 18% annually, as organizations require robust connectivity for both office and remote locations. This includes upgraded campus networks, cloud-managed switches, and enhanced security appliances to protect distributed workforce environments.

Cloud Migration and Edge Computing Drive Infrastructure Refresh

Enterprises accelerating their digital transformation initiatives are driving 40% year-over-year growth in edge computing infrastructure spending. This includes specialized networking equipment for edge data centers, micro data centers, and IoT gateways that require advanced networking capabilities. Major cloud providers are investing over $120 billion annually in data center infrastructure, creating strong demand for high-speed switches, routers, and network controllers.

MARKET CHALLENGES


Supply Chain Constraints Continue to Impact Production

Global semiconductor shortages and logistics disruptions have created significant challenges for networking equipment manufacturers. Lead times for key components like specialized chipsets have extended from 8-12 weeks to 26-52 weeks in some cases, causing production delays and increased costs across the entire ecosystem. These constraints affect everything from enterprise switches to consumer-grade routers.

Other Challenges

Rapid Technology Evolution Creates Obsolescence Concerns
The accelerated pace of technological advancement in networking equipment, particularly in wireless technologies, creates challenges for both manufacturers and consumers. Enterprises face difficult decisions about technology refresh cycles as new standards like Wi-Fi 7 (802.11be) and 5G-Advanced approach commercialization, while existing infrastructure hasn’t yet reached end-of-life. This creates pressure on R&D budgets and increases time-to-market pressures.

MARKET RESTRAINTS


High Capital Requirements Limit Market Entry

The networking equipment market requires significant capital investment not only for manufacturing but also for continuous research and development. Developing a single new generation of networking chips can cost upwards of $500 million, while maintaining competitive edge in switching and routing requires continuous investment exceeding $2 billion annually for major players. This creates significant barriers for new entrants and limits innovation from smaller players.

MARKET OPPORTUNITIES


Edge Computing and 5G Advanced Create New Revenue Streams

The convergence of 5G-Advanced and edge computing represents a $240 billion opportunity by 2028, creating massive demand for specialized networking equipment. This includes 5G standalone core infrastructure, multi-access edge computing (MEC) platforms, and private 5G networking solutions that require advanced routing, slicing, and traffic management capabilities not present in previous generations.

Network Automation and AI Integration Drive Next Wave

The integration of artificial intelligence and machine learning into network operations is creating new categories of networking equipment with built-in AI capabilities. The market for AI-enabled switches and routers is expected to reach $18 billion by 2026, growing at 42% CAGR. These systems offer self-optimizing networks, predictive maintenance, and automated traffic engineering that significantly reduce operational costs while improving performance.

Networking Equipment Market Trends
Accelerated Digital Transformation Drives Market Growth

Global networking equipment demand surged as enterprises rapidly adopted cloud infrastructure, remote work solutions, and IoT connectivity. The market reached $101.18 billion in 2024, with projections to reach $139.07 billion by 2032, representing a 4.8% CAGR. This growth is primarily driven by increased investments in 5G infrastructure, data center expansion, and edge computing deployments across major economies.

Other Trends

Market Consolidation and Strategic Partnerships

Leading manufacturers are forming strategic alliances to capture larger market shares. Cisco’s partnership with Microsoft on Azure networking solutions and Juniper’s collaboration with IBM for AI-driven network management demonstrate industry consolidation. The top 10 manufacturers collectively control approximately 65% of the global market, with Cisco maintaining the largest individual share at 18%.

Regional Market Dynamics

North America remains the largest market with 38% revenue share, followed by Asia-Pacific at 35% and Europe at 22%. Emerging markets in Southeast Asia and Latin America show the fastest growth rates, exceeding 7% annually, driven by digital infrastructure development initiatives and increasing mobile penetration rates.

Technology Segmentation and Growth Areas

Wireless networking equipment, particularly Wi-Fi 6 and 5G infrastructure, shows the strongest growth at 12.3% annually. Data center switching continues its steady growth at 8.5%, while enterprise routing maintains stable demand. The market shows increasing preference for integrated solutions combining security, analytics, and network management capabilities.

Sustainability and Energy Efficiency

Market leaders are prioritizing energy-efficient designs, with latest generation switches consuming 40-60% less power than previous generations. The industry is adopting Energy Efficient Ethernet (EEE) standards across all product categories. Cloud-managed solutions further reduce on-premise energy consumption through centralized management and AI-driven optimization.

COMPETITIVE LANDSCAPE

Key Industry Players

Leading Market Players in Networking Equipment

The global networking equipment market is dominated by Cisco Systems, which holds the largest market share across multiple product categories including routers, switches, and enterprise networking solutions. Cisco’s comprehensive portfolio and strong brand recognition make it the undisputed leader in this space.

Following Cisco, several other players have established strong positions in specific market segments. Juniper Networks is particularly strong in high-performance networking and service provider markets, while Hewlett Packard Enterprise (HP) maintains a significant presence in enterprise networking solutions. ARRIS International (now part of CommScope) and Pace (acquired by ARRIS) have strong positions in home networking and set-top box markets. Brocade (now part of Broadcom) was historically strong in storage networking and data center switches, while TP-Link and Netgear have carved out significant market share in consumer and small business networking equipment.

List of Key Networking Equipment Companies

Segment Analysis:

Segment Category Sub-Segments Key Insights
By Type
  • Routers
  • Switches
  • Access Points
  • Network Security Appliances
The routers segment leads due to critical role in enterprise networking and data center interconnectivity, while network security appliances show strongest growth trajectory due to increasing cyber threats.
By Application
  • Data Centers
  • Enterprise Networking
  • Telecommunications
  • Cloud Infrastructure
The data centers segment dominates due to massive growth in cloud services and hyperscale computing, while telecommunications shows strongest innovation adoption for 5G infrastructure rollouts.
By End User
  • Enterprises & Corporations
  • Service Providers
  • Government & Defense
The enterprises and corporations segment leads due to digital transformation initiatives and massive investments in network infrastructure, while service providers show strongest growth due to 5G deployments and edge computing expansion.
By Component
  • Hardware
  • Software
  • Integrated Solutions
The integrated solutions segment shows strongest performance as enterprises seek unified management platforms, while software-defined networking drives innovation in software segment.
By Technology
  • SDN & NFV
  • Traditional Networking
  • Hybrid Solutions
The SDN and NFV segment shows strongest growth trajectory due to automation benefits and cost efficiencies, while traditional networking maintains dominance in legacy systems integration.

Regional Analysis: Networking Equipment Market

North America

North America dominates the networking equipment market, driven by massive investments in 5G infrastructure and data center expansions. The region benefits from early adoption of IoT technologies across enterprise and industrial sectors, with major cloud providers continuously upgrading their networking infrastructure. High digitalization rates and strong R&D investments from key players like Cisco and Juniper Networks further solidify its leadership position. The region’s well-established digital economy and increasing demand for high-speed connectivity across all sectors create a mature yet continuously expanding market.

Data Center Expansion
North America’s data center expansion directly drives demand for high-performance switches, routers, and security appliances. Major hyperscalers are investing heavily in next-generation infrastructure to support AI workloads and cloud services, creating consistent demand for cutting-edge networking equipment.
5G Infrastructure Rollout
The ongoing deployment of 5G networks across major metropolitan areas requires massive investments in routing and switching equipment. Telecommunications providers are upgrading their entire infrastructure to support higher bandwidths and lower latency, driving continuous demand for advanced networking components.
Enterprise Digital Transformation
Enterprises across North America are accelerating their digital transformation initiatives, requiring upgraded networking infrastructure to support hybrid work models and cloud-based applications. This creates sustained demand for both core networking equipment and edge computing solutions.
Government Initiatives
Government initiatives in digital infrastructure development, particularly in the United States and Canada, provide funding and policy support for network modernization. These initiatives accelerate the replacement cycle of older equipment and drive adoption of software-defined networking solutions.

Europe
Europe maintains a strong position in the networking equipment market, characterized by strict data protection regulations driving demand for secure networking solutions. The region shows particular strength in industrial IoT applications and smart city implementations, requiring robust and reliable networking infrastructure. European enterprises prioritize equipment with strong security features and energy efficiency, creating demand for next-generation switches and routers with advanced threat detection capabilities.

Asia-Pacific
Asia-Pacific represents the fastest growing market for networking equipment, driven by massive digital transformation initiatives across China, India, and Southeast Asian countries. The region benefits from rapid 5G deployment, expanding data center capacity, and increasing adoption of cloud services. Governments across the region are heavily investing in digital infrastructure as part of broader economic development plans, creating sustained demand for both consumer and enterprise-grade networking equipment.

Latin America
Latin America shows steady growth in networking equipment adoption, particularly in Brazil and Mexico where digital infrastructure development is accelerating. The region benefits from increasing mobile penetration and gradual data center expansion. While adoption rates vary across countries, the overall trend shows growing demand for networking equipment to support digital economy initiatives and improving internet connectivity across the region.

Middle East & Africa
The Middle East shows strong demand for networking equipment driven by smart city initiatives and economic diversification plans in Gulf countries. Africa experiences growing demand from increasing mobile adoption and gradual infrastructure development, though market penetration remains uneven across the continent. Both regions show potential for significant growth as digital transformation initiatives continue to accelerate.

Report Scope

This market research report provides a comprehensive analysis of the global Networking Equipment market, covering the forecast period 2025-2032. It offers detailed insights into market dynamics, technological advancements, competitive landscape, and key trends shaping the industry.

Key focus areas of the report include:

  • Market Overview: The report begins with an overview outlining the current market scenario, key growth indicators, and industry transformation drivers. It discusses macroeconomic factors, demand-supply balance, regulatory landscape, and the strategic role of networking equipment in powering advancements across industries such as telecommunications, data centers, cloud computing, and industrial automation.
  • Market Size & Forecast: Historical data and future projections for revenue, unit shipments, and market value across major regions and segments.
  • Segmentation Analysis: Detailed breakdown by product type, technology, application, and end-user industry to identify high-growth segments and investment opportunities.
  • Regional Insights: Insights into market performance across North America, Europe, Asia-Pacific, Latin America, and the Middle East & Africa, including country-level analysis where relevant.
  • Competitive Landscape: Profiles of leading market participants, including their product offerings, R&D focus, manufacturing capacity, pricing strategies, and recent developments such as mergers, acquisitions, and partnerships.
  • Technology Trends & Innovation: Assessment of emerging technologies, integration of AI/IoT, semiconductor design trends, fabrication techniques, and evolving industry standards.
  • Market Drivers & Restraints: Evaluation of factors driving market growth along with challenges, supply chain constraints, regulatory issues, and market-entry barriers.
  • Stakeholder Insights: Insights for component suppliers, OEMs, system integrators, investors, and policymakers regarding the evolving ecosystem and strategic opportunities.

Primary and secondary research methods are employed, including interviews with industry experts, data from verified sources, and real-time market intelligence to ensure the accuracy and reliability of the insights presented.

FREQUENTLY ASKED QUESTIONS:

What is the current market size of the Networking Equipment Market?

-> Networking Equipment market was valued at USD 101,180 million in 2024 and is projected to reach USD 139,070 million by 2032.

Which key companies operate in the Networking Equipment Market?

-> Key players include Cisco, Arris, Juniper, HP, Pace (Arris), Brocade, TP-Link, Avaya, Netgear, and NEC, among others.

What is the growth rate of the Networking Equipment Market?

-> The market is expected to grow at a CAGR of 4.8% during the forecast period 2024-2032.

What are the main product segments in Networking Equipment Market?

-> The market includes routers, switches, WLAN equipment, ADSL equipment, modems, hubs, and other networking components.

Which region dominates the Networking Equipment Market?

-> North America and Asia-Pacific are the largest markets, with Asia-Pacific showing the highest growth rate due to increasing digitalization and infrastructure development.

Networking Equipment Market, Global Business Strategies 2025-2032

Get Sample Report PDF for Exclusive Insights

Report Sample Includes

  • Table of Contents
  • List of Tables & Figures
  • Charts, Research Methodology, and more...
PDF Icon Download Sample Report PDF

Download Sample Report

Table of Content

1 Introduction to Research & Analysis Reports
1.1 Networking Equipment Market Definition
1.2 Market Segments
1.2.1 Segment by Type
1.2.2 Segment by Application
1.3 Global Networking Equipment Market Overview
1.4 Features & Benefits of This Report
1.5 Methodology & Sources of Information
1.5.1 Research Methodology
1.5.2 Research Process
1.5.3 Base Year
1.5.4 Report Assumptions & Caveats
2 Global Networking Equipment Overall Market Size
2.1 Global Networking Equipment Market Size: 2024 VS 2032
2.2 Global Networking Equipment Market Size, Prospects & Forecasts: 2020-2032
2.3 Key Market Trends, Opportunity, Drivers and Restraints
2.3.1 Market Opportunities & Trends
2.3.2 Market Drivers
2.3.3 Market Restraints
3 Company Landscape
3.1 Top Networking Equipment Players in Global Market
3.2 Top Global Networking Equipment Companies Ranked by Revenue
3.3 Global Networking Equipment Revenue by Companies
3.4 Top 3 and Top 5 Networking Equipment Companies in Global Market, by Revenue in 2024
3.5 Global Companies Networking Equipment Product Type
3.6 Tier 1, Tier 2, and Tier 3 Networking Equipment Players in Global Market
3.6.1 List of Global Tier 1 Networking Equipment Companies
3.6.2 List of Global Tier 2 and Tier 3 Networking Equipment Companies
4 Sights by Product
4.1 Overview
4.1.1 Segmentation by Type – Global Networking Equipment Market Size Markets, 2024 & 2032
4.1.2 Networking Equipment Power Supply (Adapter) of 1~10W
4.1.3 Networking Equipment Power Supply (Adapter) of 11~20W
4.1.4 Networking Equipment Power Supply (Adapter) of 21~50W
4.1.5 Networking Equipment Power Supply (Adapter) of 50~100W
4.2 Segmentation by Type – Global Networking Equipment Revenue & Forecasts
4.2.1 Segmentation by Type – Global Networking Equipment Revenue, 2020-2025
4.2.2 Segmentation by Type – Global Networking Equipment Revenue, 2026-2032
4.2.3 Segmentation by Type – Global Networking Equipment Revenue Market Share, 2020-2032
5 Sights by Application
5.1 Overview
5.1.1 Segmentation by Application – Global Networking Equipment Market Size, 2024 & 2032
5.1.2 Switches
5.1.3 Routers
5.1.4 WLAN
5.1.5 ADSL
5.1.6 Modem
5.1.7 Hubs
5.1.8 Set-Top Boxes
5.1.9 Others
5.2 Segmentation by Application – Global Networking Equipment Revenue & Forecasts
5.2.1 Segmentation by Application – Global Networking Equipment Revenue, 2020-2025
5.2.2 Segmentation by Application – Global Networking Equipment Revenue, 2026-2032
5.2.3 Segmentation by Application – Global Networking Equipment Revenue Market Share, 2020-2032
6 Sights by Region
6.1 By Region – Global Networking Equipment Market Size, 2024 & 2032
6.2 By Region – Global Networking Equipment Revenue & Forecasts
6.2.1 By Region – Global Networking Equipment Revenue, 2020-2025
6.2.2 By Region – Global Networking Equipment Revenue, 2026-2032
6.2.3 By Region – Global Networking Equipment Revenue Market Share, 2020-2032
6.3 North America
6.3.1 By Country – North America Networking Equipment Revenue, 2020-2032
6.3.2 United States Networking Equipment Market Size, 2020-2032
6.3.3 Canada Networking Equipment Market Size, 2020-2032
6.3.4 Mexico Networking Equipment Market Size, 2020-2032
6.4 Europe
6.4.1 By Country – Europe Networking Equipment Revenue, 2020-2032
6.4.2 Germany Networking Equipment Market Size, 2020-2032
6.4.3 France Networking Equipment Market Size, 2020-2032
6.4.4 U.K. Networking Equipment Market Size, 2020-2032
6.4.5 Italy Networking Equipment Market Size, 2020-2032
6.4.6 Russia Networking Equipment Market Size, 2020-2032
6.4.7 Nordic Countries Networking Equipment Market Size, 2020-2032
6.4.8 Benelux Networking Equipment Market Size, 2020-2032
6.5 Asia
6.5.1 By Region – Asia Networking Equipment Revenue, 2020-2032
6.5.2 China Networking Equipment Market Size, 2020-2032
6.5.3 Japan Networking Equipment Market Size, 2020-2032
6.5.4 South Korea Networking Equipment Market Size, 2020-2032
6.5.5 Southeast Asia Networking Equipment Market Size, 2020-2032
6.5.6 India Networking Equipment Market Size, 2020-2032
6.6 South America
6.6.1 By Country – South America Networking Equipment Revenue, 2020-2032
6.6.2 Brazil Networking Equipment Market Size, 2020-2032
6.6.3 Argentina Networking Equipment Market Size, 2020-2032
6.7 Middle East & Africa
6.7.1 By Country – Middle East & Africa Networking Equipment Revenue, 2020-2032
6.7.2 Turkey Networking Equipment Market Size, 2020-2032
6.7.3 Israel Networking Equipment Market Size, 2020-2032
6.7.4 Saudi Arabia Networking Equipment Market Size, 2020-2032
6.7.5 UAE Networking Equipment Market Size, 2020-2032
7 Companies Profiles
7.1 Cisco
7.1.1 Cisco Corporate Summary
7.1.2 Cisco Business Overview
7.1.3 Cisco Networking Equipment Major Product Offerings
7.1.4 Cisco Networking Equipment Revenue in Global Market (2020-2025)
7.1.5 Cisco Key News & Latest Developments
7.2 Arris
7.2.1 Arris Corporate Summary
7.2.2 Arris Business Overview
7.2.3 Arris Networking Equipment Major Product Offerings
7.2.4 Arris Networking Equipment Revenue in Global Market (2020-2025)
7.2.5 Arris Key News & Latest Developments
7.3 Juniper
7.3.1 Juniper Corporate Summary
7.3.2 Juniper Business Overview
7.3.3 Juniper Networking Equipment Major Product Offerings
7.3.4 Juniper Networking Equipment Revenue in Global Market (2020-2025)
7.3.5 Juniper Key News & Latest Developments
7.4 HP
7.4.1 HP Corporate Summary
7.4.2 HP Business Overview
7.4.3 HP Networking Equipment Major Product Offerings
7.4.4 HP Networking Equipment Revenue in Global Market (2020-2025)
7.4.5 HP Key News & Latest Developments
7.5 Pace (Arris)
7.5.1 Pace (Arris) Corporate Summary
7.5.2 Pace (Arris) Business Overview
7.5.3 Pace (Arris) Networking Equipment Major Product Offerings
7.5.4 Pace (Arris) Networking Equipment Revenue in Global Market (2020-2025)
7.5.5 Pace (Arris) Key News & Latest Developments
7.6 Brocade
7.6.1 Brocade Corporate Summary
7.6.2 Brocade Business Overview
7.6.3 Brocade Networking Equipment Major Product Offerings
7.6.4 Brocade Networking Equipment Revenue in Global Market (2020-2025)
7.6.5 Brocade Key News & Latest Developments
7.7 TP-Link
7.7.1 TP-Link Corporate Summary
7.7.2 TP-Link Business Overview
7.7.3 TP-Link Networking Equipment Major Product Offerings
7.7.4 TP-Link Networking Equipment Revenue in Global Market (2020-2025)
7.7.5 TP-Link Key News & Latest Developments
7.8 Avaya
7.8.1 Avaya Corporate Summary
7.8.2 Avaya Business Overview
7.8.3 Avaya Networking Equipment Major Product Offerings
7.8.4 Avaya Networking Equipment Revenue in Global Market (2020-2025)
7.8.5 Avaya Key News & Latest Developments
7.9 Netgear
7.9.1 Netgear Corporate Summary
7.9.2 Netgear Business Overview
7.9.3 Netgear Networking Equipment Major Product Offerings
7.9.4 Netgear Networking Equipment Revenue in Global Market (2020-2025)
7.9.5 Netgear Key News & Latest Developments
7.10 NEC
7.10.1 NEC Corporate Summary
7.10.2 NEC Business Overview
7.10.3 NEC Networking Equipment Major Product Offerings
7.10.4 NEC Networking Equipment Revenue in Global Market (2020-2025)
7.10.5 NEC Key News & Latest Developments
8 Conclusion
9 Appendix
9.1 Note
9.2 Examples of Clients
9.3 DisclaimerList of Tables
Table 1. Networking Equipment Market Opportunities & Trends in Global Market
Table 2. Networking Equipment Market Drivers in Global Market
Table 3. Networking Equipment Market Restraints in Global Market
Table 4. Key Players of Networking Equipment in Global Market
Table 5. Top Networking Equipment Players in Global Market, Ranking by Revenue (2024)
Table 6. Global Networking Equipment Revenue by Companies, (US$, Mn), 2020-2025
Table 7. Global Networking Equipment Revenue Share by Companies, 2020-2025
Table 8. Global Companies Networking Equipment Product Type
Table 9. List of Global Tier 1 Networking Equipment Companies, Revenue (US$, Mn) in 2024 and Market Share
Table 10. List of Global Tier 2 and Tier 3 Networking Equipment Companies, Revenue (US$, Mn) in 2024 and Market Share
Table 11. Segmentation by Type – Global Networking Equipment Revenue, (US$, Mn), 2024 & 2032
Table 12. Segmentation by Type – Global Networking Equipment Revenue (US$, Mn), 2020-2025
Table 13. Segmentation by Type – Global Networking Equipment Revenue (US$, Mn), 2026-2032
Table 14. Segmentation by Application– Global Networking Equipment Revenue, (US$, Mn), 2024 & 2032
Table 15. Segmentation by Application – Global Networking Equipment Revenue, (US$, Mn), 2020-2025
Table 16. Segmentation by Application – Global Networking Equipment Revenue, (US$, Mn), 2026-2032
Table 17. By Region– Global Networking Equipment Revenue, (US$, Mn), 2024 & 2032
Table 18. By Region – Global Networking Equipment Revenue, (US$, Mn), 2020-2025
Table 19. By Region – Global Networking Equipment Revenue, (US$, Mn), 2026-2032
Table 20. By Country – North America Networking Equipment Revenue, (US$, Mn), 2020-2025
Table 21. By Country – North America Networking Equipment Revenue, (US$, Mn), 2026-2032
Table 22. By Country – Europe Networking Equipment Revenue, (US$, Mn), 2020-2025
Table 23. By Country – Europe Networking Equipment Revenue, (US$, Mn), 2026-2032
Table 24. By Region – Asia Networking Equipment Revenue, (US$, Mn), 2020-2025
Table 25. By Region – Asia Networking Equipment Revenue, (US$, Mn), 2026-2032
Table 26. By Country – South America Networking Equipment Revenue, (US$, Mn), 2020-2025
Table 27. By Country – South America Networking Equipment Revenue, (US$, Mn), 2026-2032
Table 28. By Country – Middle East & Africa Networking Equipment Revenue, (US$, Mn), 2020-2025
Table 29. By Country – Middle East & Africa Networking Equipment Revenue, (US$, Mn), 2026-2032
Table 30. Cisco Corporate Summary
Table 31. Cisco Networking Equipment Product Offerings
Table 32. Cisco Networking Equipment Revenue (US$, Mn) & (2020-2025)
Table 33. Cisco Key News & Latest Developments
Table 34. Arris Corporate Summary
Table 35. Arris Networking Equipment Product Offerings
Table 36. Arris Networking Equipment Revenue (US$, Mn) & (2020-2025)
Table 37. Arris Key News & Latest Developments
Table 38. Juniper Corporate Summary
Table 39. Juniper Networking Equipment Product Offerings
Table 40. Juniper Networking Equipment Revenue (US$, Mn) & (2020-2025)
Table 41. Juniper Key News & Latest Developments
Table 42. HP Corporate Summary
Table 43. HP Networking Equipment Product Offerings
Table 44. HP Networking Equipment Revenue (US$, Mn) & (2020-2025)
Table 45. HP Key News & Latest Developments
Table 46. Pace (Arris) Corporate Summary
Table 47. Pace (Arris) Networking Equipment Product Offerings
Table 48. Pace (Arris) Networking Equipment Revenue (US$, Mn) & (2020-2025)
Table 49. Pace (Arris) Key News & Latest Developments
Table 50. Brocade Corporate Summary
Table 51. Brocade Networking Equipment Product Offerings
Table 52. Brocade Networking Equipment Revenue (US$, Mn) & (2020-2025)
Table 53. Brocade Key News & Latest Developments
Table 54. TP-Link Corporate Summary
Table 55. TP-Link Networking Equipment Product Offerings
Table 56. TP-Link Networking Equipment Revenue (US$, Mn) & (2020-2025)
Table 57. TP-Link Key News & Latest Developments
Table 58. Avaya Corporate Summary
Table 59. Avaya Networking Equipment Product Offerings
Table 60. Avaya Networking Equipment Revenue (US$, Mn) & (2020-2025)
Table 61. Avaya Key News & Latest Developments
Table 62. Netgear Corporate Summary
Table 63. Netgear Networking Equipment Product Offerings
Table 64. Netgear Networking Equipment Revenue (US$, Mn) & (2020-2025)
Table 65. Netgear Key News & Latest Developments
Table 66. NEC Corporate Summary
Table 67. NEC Networking Equipment Product Offerings
Table 68. NEC Networking Equipment Revenue (US$, Mn) & (2020-2025)
Table 69. NEC Key News & Latest Developments

List of Figures
Figure 1. Networking Equipment Product Picture
Figure 2. Networking Equipment Segment by Type in 2024
Figure 3. Networking Equipment Segment by Application in 2024
Figure 4. Global Networking Equipment Market Overview: 2024
Figure 5. Key Caveats
Figure 6. Global Networking Equipment Market Size: 2024 VS 2032 (US$, Mn)
Figure 7. Global Networking Equipment Revenue: 2020-2032 (US$, Mn)
Figure 8. The Top 3 and 5 Players Market Share by Networking Equipment Revenue in 2024
Figure 9. Segmentation by Type – Global Networking Equipment Revenue, (US$, Mn), 2024 & 2032
Figure 10. Segmentation by Type – Global Networking Equipment Revenue Market Share, 2020-2032
Figure 11. Segmentation by Application – Global Networking Equipment Revenue, (US$, Mn), 2024 & 2032
Figure 12. Segmentation by Application – Global Networking Equipment Revenue Market Share, 2020-2032
Figure 13. By Region – Global Networking Equipment Revenue Market Share, 2020-2032
Figure 14. By Country – North America Networking Equipment Revenue Market Share, 2020-2032
Figure 15. United States Networking Equipment Revenue, (US$, Mn), 2020-2032
Figure 16. Canada Networking Equipment Revenue, (US$, Mn), 2020-2032
Figure 17. Mexico Networking Equipment Revenue, (US$, Mn), 2020-2032
Figure 18. By Country – Europe Networking Equipment Revenue Market Share, 2020-2032
Figure 19. Germany Networking Equipment Revenue, (US$, Mn), 2020-2032
Figure 20. France Networking Equipment Revenue, (US$, Mn), 2020-2032
Figure 21. U.K. Networking Equipment Revenue, (US$, Mn), 2020-2032
Figure 22. Italy Networking Equipment Revenue, (US$, Mn), 2020-2032
Figure 23. Russia Networking Equipment Revenue, (US$, Mn), 2020-2032
Figure 24. Nordic Countries Networking Equipment Revenue, (US$, Mn), 2020-2032
Figure 25. Benelux Networking Equipment Revenue, (US$, Mn), 2020-2032
Figure 26. By Region – Asia Networking Equipment Revenue Market Share, 2020-2032
Figure 27. China Networking Equipment Revenue, (US$, Mn), 2020-2032
Figure 28. Japan Networking Equipment Revenue, (US$, Mn), 2020-2032
Figure 29. South Korea Networking Equipment Revenue, (US$, Mn), 2020-2032
Figure 30. Southeast Asia Networking Equipment Revenue, (US$, Mn), 2020-2032
Figure 31. India Networking Equipment Revenue, (US$, Mn), 2020-2032
Figure 32. By Country – South America Networking Equipment Revenue Market Share, 2020-2032
Figure 33. Brazil Networking Equipment Revenue, (US$, Mn), 2020-2032
Figure 34. Argentina Networking Equipment Revenue, (US$, Mn), 2020-2032
Figure 35. By Country – Middle East & Africa Networking Equipment Revenue Market Share, 2020-2032
Figure 36. Turkey Networking Equipment Revenue, (US$, Mn), 2020-2032
Figure 37. Israel Networking Equipment Revenue, (US$, Mn), 2020-2032
Figure 38. Saudi Arabia Networking Equipment Revenue, (US$, Mn), 2020-2032
Figure 39. UAE Networking Equipment Revenue, (US$, Mn), 2020-2032
Figure 40. Cisco Networking Equipment Revenue Year Over Year Growth (US$, Mn) & (2020-2025)
Figure 41. Arris Networking Equipment Revenue Year Over Year Growth (US$, Mn) & (2020-2025)
Figure 42. Juniper Networking Equipment Revenue Year Over Year Growth (US$, Mn) & (2020-2025)
Figure 43. HP Networking Equipment Revenue Year Over Year Growth (US$, Mn) & (2020-2025)
Figure 44. Pace (Arris) Networking Equipment Revenue Year Over Year Growth (US$, Mn) & (2020-2025)
Figure 45. Brocade Networking Equipment Revenue Year Over Year Growth (US$, Mn) & (2020-2025)
Figure 46. TP-Link Networking Equipment Revenue Year Over Year Growth (US$, Mn) & (2020-2025)
Figure 47. Avaya Networking Equipment Revenue Year Over Year Growth (US$, Mn) & (2020-2025)
Figure 48. Netgear Networking Equipment Revenue Year Over Year Growth (US$, Mn) & (2020-2025)
Figure 49. NEC Networking Equipment Revenue Year Over Year Growth (US$, Mn) & (2020-2025)