MARKET INSIGHTS
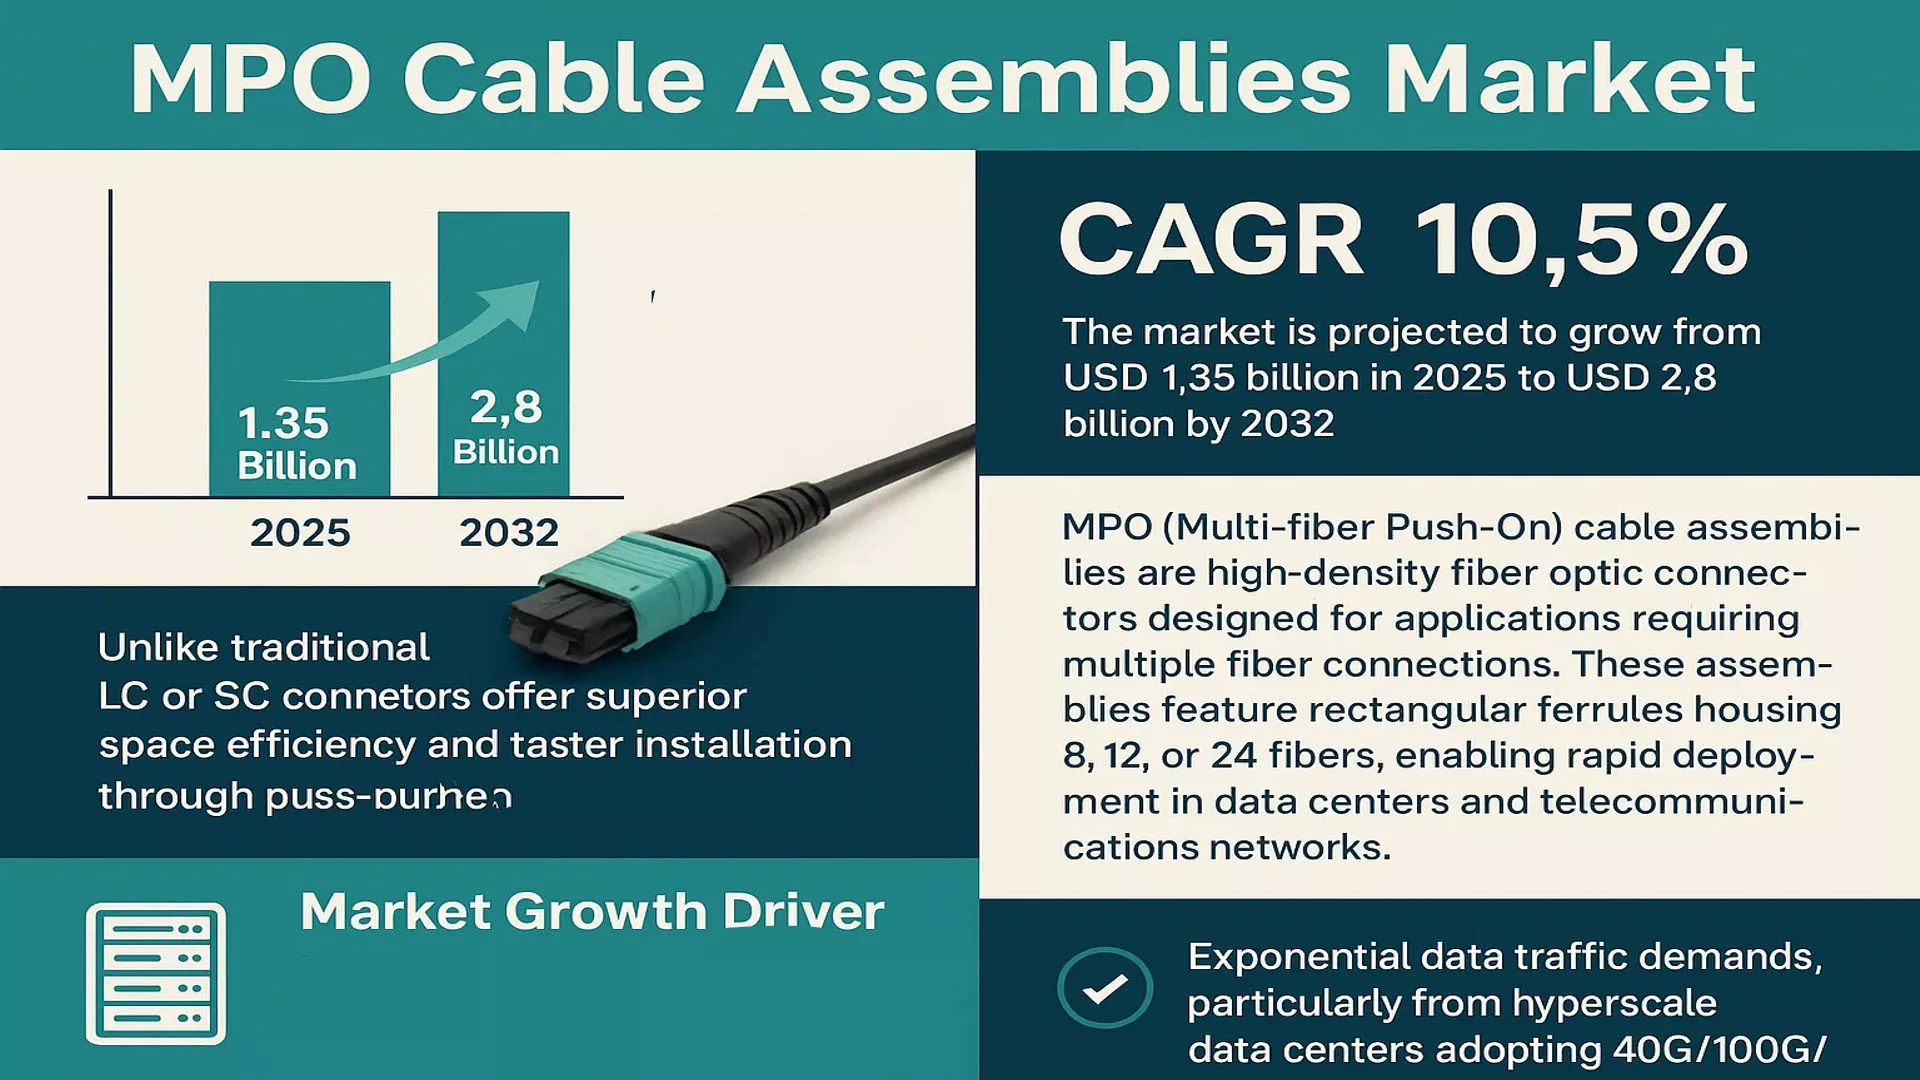
Global MPO Cable Assemblies Market was valued at USD 1.2 billion in 2024. The market is projected to grow from USD 1.35 billion in 2025 to USD 2.8 billion by 2032, exhibiting a CAGR of 10.5% during the forecast period.
MPO (Multi-fiber Push-On) cable assemblies are high-density fiber optic connectors designed for applications requiring multiple fiber connections. These assemblies feature rectangular ferrules housing 8, 12, or 24 fibers, enabling rapid deployment in data centers and telecommunications networks. Unlike traditional LC or SC connectors, MPO solutions offer superior space efficiency and faster installation through their push-pull mating mechanism.
The market growth is primarily driven by exponential data traffic demands, particularly from hyperscale data centers adopting 40G/100G/400G Ethernet standards. North America currently dominates with 38% market share due to strong 5G infrastructure investments, while Asia-Pacific shows the fastest growth at 12.7% CAGR. Leading manufacturers like CommScope and Molex are innovating with ultra-low-loss MPO variants to support emerging 800G applications, reflecting the industry’s response to evolving bandwidth requirements.
MARKET DYNAMICS
MARKET DRIVERS
Exponential Growth in Data Center Deployments to Drive MPO Cable Assembly Demand
The global data center market is experiencing unprecedented expansion, driven by the surge in cloud computing, big data analytics, and the Internet of Things (IoT). Hyperscale data centers, which require high-density fiber optic connectivity, are increasingly adopting MPO cable assemblies due to their ability to support multiple fibers in a single connector. These assemblies significantly reduce installation time and space requirements while enhancing scalability. With data traffic projected to grow at a compound annual growth rate of over 25% through 2030, the demand for efficient, high-bandwidth connectivity solutions like MPO assemblies has become critical. The transition to 400G and emerging 800G Ethernet standards further accelerates this adoption, as MPO configurations provide the necessary backbone for these high-speed networks. Major cloud service providers have been investing billions annually in data center infrastructure, creating sustained demand for advanced connectivity solutions.
5G Network Rollouts and Telecommunications Infrastructure Modernization
The global deployment of 5G networks represents a significant driver for MPO cable assemblies, particularly in fronthaul and backhaul applications. 5G technology requires substantially more cell sites and higher fiber density compared to previous generations, creating robust demand for high-performance connectivity solutions. Telecommunications providers are investing heavily in network infrastructure, with global 5G capital expenditures expected to reach hundreds of billions annually by 2026. MPO assemblies enable the dense fiber connections necessary for 5G base stations and central offices, supporting the increased bandwidth requirements and low-latency characteristics of next-generation networks. The modular nature of MPO systems allows for efficient upgrades and maintenance, reducing operational costs for telecom operators while ensuring network reliability and performance.
Adoption of High-Performance Computing and Artificial Intelligence Infrastructure
The rapid advancement of artificial intelligence, machine learning, and high-performance computing applications has created substantial demand for MPO cable assemblies in research institutions, government facilities, and enterprise computing environments. These applications require massive data transfer capabilities between servers, storage systems, and networking equipment, driving the need for high-density fiber optic solutions. Supercomputing facilities and AI research centers increasingly rely on MPO assemblies to support their extreme bandwidth requirements, often exceeding petabyte-scale data transfers. The military and aerospace sectors also contribute to this demand, utilizing MPO technology for radar systems, surveillance equipment, and satellite communications where reliability and high performance are paramount. The growing investment in quantum computing research further expands the potential applications for advanced fiber optic connectivity solutions.
MARKET CHALLENGES
Precision Manufacturing Requirements and Quality Control Complexities
The production of MPO cable assemblies involves extremely tight tolerances and precision manufacturing processes, presenting significant challenges for market participants. The multi-fiber ferrule design requires perfect alignment of multiple optical fibers within micrometer-level precision, making manufacturing considerably more complex than single-fiber connectors. Even minor imperfections in polishing, fiber protrusion, or alignment can result in substantial signal loss and performance degradation. Quality control processes must be exceptionally rigorous, often requiring advanced optical inspection equipment and highly trained technicians. The manufacturing complexity contributes to higher production costs and potential yield issues, particularly for manufacturers transitioning from traditional fiber optic products to MPO technology. These challenges are amplified when producing higher fiber count configurations such as 24-fiber or 36-fiber assemblies, where alignment tolerances become increasingly critical.
Other Challenges
Installation and Maintenance Expertise Shortage
The specialized nature of MPO cable installation and maintenance presents operational challenges for end-users. Proper MPO deployment requires technicians with specific training in polarity management, testing methodologies, and cleaning procedures unique to multi-fiber connectors. The industry faces a growing skills gap as the demand for qualified fiber optic technicians outpaces the availability of trained professionals. This shortage can lead to improper installations, increased network downtime, and higher operational costs for organizations deploying MPO infrastructure.
Interoperability and Standardization Issues
Despite industry standards, interoperability challenges persist between MPO products from different manufacturers. Variations in ferrule geometry, polishing techniques, and connector design can affect performance when mixing components from multiple vendors. These compatibility issues often necessitate single-vendor solutions or extensive testing protocols, limiting flexibility and increasing total cost of ownership for end-users.
MARKET RESTRAINTS
High Initial Investment and Total Cost of Ownership Considerations
While MPO cable assemblies offer long-term benefits in space savings and installation efficiency, the initial investment required for implementation can be substantial. The technology requires specialized test equipment, cleaning tools, and installation apparatus that differ significantly from traditional fiber optic systems. For many organizations, particularly small to medium-sized enterprises, the capital expenditure for MPO migration can be prohibitive. The total cost of ownership extends beyond hardware to include training expenses for technical staff and potential downtime during implementation. These financial considerations often delay adoption decisions, especially in cost-sensitive market segments or organizations with existing infrastructure investments in traditional connectivity solutions. The economic uncertainty in various global markets has further exacerbated this restraint, causing some enterprises to postpone data center upgrades and network expansions.
Technical Limitations in Certain Applications and Environments
MPO technology faces inherent limitations in applications requiring frequent reconfiguration or flexibility. The connector design, while excellent for permanent high-density installations, is less suited for environments requiring regular patching changes or mobility. The physical size and relative fragility of MPO connectors compared to some traditional options can restrict their use in harsh industrial environments or military field applications. Additionally, repair and rework procedures for MPO assemblies are more complex than single-fiber solutions, potentially increasing maintenance costs and downtime when issues occur. These technical constraints limit MPO adoption in certain vertical markets and applications where flexibility, durability, or ease of maintenance are primary considerations.
Market Maturity and Replacement Cycle Considerations
The fiber optics industry follows extended equipment lifecycles, often spanning seven to ten years for major infrastructure components. This longevity creates natural resistance to rapid technology transitions, as organizations seek to maximize returns on existing investments. Many enterprises have substantial deployed bases of traditional fiber connectivity that continue to meet current performance requirements, reducing the urgency for MPO adoption. The decision to replace functioning infrastructure involves careful consideration of ROI timelines and disruption to operations. In some cases, incremental upgrades using existing technology may be preferred over wholesale migration to MPO systems, particularly when current bandwidth requirements are being met adequately.
MARKET OPPORTUNITIES
Emerging Technologies and Next-Generation Network Standards
The continuous evolution of network technologies presents substantial growth opportunities for MPO cable assemblies. The development of 800G and 1.6T Ethernet standards requires even higher fiber densities and more advanced connectivity solutions, positioning MPO technology as essential infrastructure for future networks. The ongoing expansion of fiber-to-the-home (FTTH) and fiber-to-the-premises (FTTP) deployments also creates opportunities for MPO adoption in telecommunications access networks. Additionally, the growing implementation of edge computing infrastructure requires compact, high-performance connectivity solutions suitable for space-constrained environments. These technological advancements drive innovation in MPO product development, including higher fiber counts, improved performance characteristics, and enhanced reliability features. The integration of MPO technology with active optical cables and emerging photonic integration techniques further expands the potential application landscape.
Geographic Expansion and Emerging Market Development
Significant opportunities exist in developing regions where telecommunications and data center infrastructure are undergoing rapid modernization. Countries across Asia, Latin America, and Africa are investing heavily in digital infrastructure, creating new markets for advanced fiber optic solutions. Government initiatives promoting broadband expansion and digital transformation programs often include specifications for future-proof infrastructure capable of supporting growing bandwidth demands. The relatively lower penetration of legacy systems in these markets reduces barriers to MPO adoption, allowing for direct implementation of modern connectivity solutions. International standards harmonization efforts further facilitate global market expansion by reducing compatibility concerns and enabling multi-vendor solutions.
Innovation in Manufacturing Techniques and Material Science
Advancements in manufacturing technology and materials science present opportunities for improved MPO products with enhanced performance characteristics. Developments in precision molding techniques, advanced polishing methods, and improved ferrule materials enable higher quality connectors with reduced insertion loss and better durability. Automation in manufacturing processes addresses labor cost concerns while improving consistency and yield rates. These innovations allow manufacturers to offer more competitive pricing while maintaining high quality standards, potentially expanding market access to cost-sensitive segments. The development of specialized MPO variants for unique applications, such as harsh environment versions or customized configurations, creates niche market opportunities with reduced price sensitivity and higher value propositions.
MPO CABLE ASSEMBLIES MARKET TRENDS
Explosive Growth in Hyperscale Data Center Deployments Drives Market Momentum
The relentless expansion of cloud computing, big data analytics, and artificial intelligence is fueling an unprecedented demand for high-density, high-bandwidth connectivity solutions within hyperscale data centers. MPO cable assemblies, with their ability to consolidate multiple fiber connections into a single interface, are at the forefront of this infrastructure evolution. The market is witnessing a significant shift towards higher fiber counts, with 12-fiber and 24-fiber options becoming the de facto standard for new spine-leaf architecture deployments to support 40G, 100G, and emerging 400G applications. This trend is further accelerated by the global push for digital transformation, which necessitates scalable and future-proof data center infrastructure. While North America and Asia-Pacific are the primary growth engines, investments are rising globally to support the increasing data consumption, which is projected to exceed 180 zettabytes by 2025.
Other Trends
Accelerated Rollout of 5G and FTTx Networks
The global deployment of 5G networks and Fiber-to-the-x (FTTx) infrastructure represents a major catalyst for the MPO cable assemblies market. 5G fronthaul and midhaul networks require high-capacity, low-latency fiber links between cell sites and core networks, a role perfectly suited for dense MPO solutions. Similarly, the push for fiber deep in access networks to support gigabit broadband services is increasing the adoption of pre-terminated MPO assemblies for faster and more reliable field deployments. This is not just about speed; it’s about network densification and preparing for the massive influx of connected devices and data traffic, which is expected to grow at a compound annual growth rate of over 25% in the next five years. The need for robust and scalable physical layer solutions in telecommunications is therefore a long-term, sustained driver.
Technological Advancements and Standardization Efforts
Innovation in connector design, polishing techniques, and cable construction is a continuous trend aimed at improving performance and reducing insertion loss. Manufacturers are heavily investing in R&D to develop next-generation MPO connectors that meet the stringent requirements for 800G and 1.6T Ethernet applications, which are already on the horizon. Furthermore, the industry is moving towards greater standardization to ensure multi-vendor interoperability, which is critical for end-users. Initiatives by standards bodies like the Telecommunications Industry Association (TIA) and International Electrotechnical Commission (IEC) are helping to create a more reliable and predictable market. This focus on performance and compatibility is crucial because even minor inconsistencies can lead to significant signal degradation in high-speed networks, making quality and adherence to standards a primary purchasing criterion.
Rising Adoption in Emerging and Niche Applications
Beyond traditional data centers and telecom, MPO cable assemblies are finding new growth avenues in several high-value sectors. In the military and aerospace industry, their small form factor and high reliability are essential for avionics and communication systems where space and weight are at a premium. The test and measurement equipment market is another significant adopter, utilizing MPO-based solutions for high-speed signal integrity testing. Furthermore, the industrial automation sector is increasingly leveraging these assemblies for backbone connectivity in large-scale manufacturing plants and industrial IoT setups. This diversification of application areas mitigates market risk and creates additional, stable revenue streams for manufacturers, insulating the market from being solely dependent on the cyclicality of data center construction.
COMPETITIVE LANDSCAPE
Key Industry Players
Companies Focus on Innovation and Strategic Expansion to Capture Market Share
The global MPO Cable Assemblies market exhibits a semi-consolidated competitive structure, characterized by the presence of both established multinational corporations and specialized niche players. CommScope holds a dominant position in the market, largely attributable to its comprehensive product portfolio that spans various fiber counts and its extensive global distribution network, particularly strong in North America and Europe. The company’s continuous investment in R&D for high-density data center solutions further solidifies its leadership.
AFL and Amphenol-FOP also command significant market shares, with their growth driven by robust manufacturing capabilities and strong relationships with telecommunications and data center clients. Their ability to provide customized solutions for specific applications, such as high-speed networking and military communications, gives them a competitive edge. Furthermore, these companies benefit from vertical integration, controlling multiple stages of the production process to ensure quality and reduce costs.
Strategic initiatives, including mergers and acquisitions, geographic expansion into emerging markets, and the launch of next-generation products compatible with evolving standards like 400G and 800G Ethernet, are expected to be key growth drivers for these leading players. For instance, recent expansions into Asian markets, where data center construction is booming, have provided substantial new revenue streams.
Meanwhile, companies like Molex and Panduit are strengthening their market positions through significant investments in research and development focused on improving connector performance and reducing insertion loss. They are also engaging in strategic partnerships with network equipment manufacturers to develop co-engineered solutions, ensuring their products are optimized for the latest hardware. This collaborative approach, combined with a focus on sustainability through the development of more energy-efficient cabling systems, positions them for sustained growth in an increasingly competitive and technologically advanced landscape.
List of Key MPO Cable Assemblies Companies Profiled
- CommScope (U.S.)
- AFL (U.S.)
- Amphenol-FOP (U.S.)
- WCFO (China)
- Optec Technology Limited (Taiwan)
- Infinite Electronics (U.S.)
- T&S Communications (China)
- FSG Networks Limited (U.K.)
- Siemon (U.S.)
- Suzhou Agix (China)
- Molex (U.S.)
- Panduit (U.S.)
- Nexconec (U.S.)
Segment Analysis:
By Type
12 Fiber Options Segment Leads Due to Widespread Adoption in Data Centers
The market is segmented based on type into:
- 8 Fiber Options
- 12 Fiber Options
- 24 Fiber Options
- Others
By Application
Data Centers Segment Dominates Owing to High-Speed Connectivity Requirements
The market is segmented based on application into:
- Data Centers
- Telecommunications
- Military and Aerospace
- Others
Regional Analysis: MPO Cable Assemblies Market
Asia-Pacific
The Asia-Pacific region dominates the global MPO cable assemblies market, driven by rapid digital transformation and massive data center expansion. China accounts for the largest share, with its “Digital China” strategy fueling demand for high-density fiber optic solutions. Japan and India follow closely, where telecom infrastructure upgrades and 5G deployments necessitate MPO adoption. The region benefits from localized manufacturing hubs in countries like Taiwan and South Korea, reducing production costs. However, pricing pressures remain intense due to fierce competition among domestic suppliers. Environmental regulations around electronic waste are gradually tightening, pushing manufacturers toward sustainable material choices.
North America
North America represents the most technologically advanced MPO cable assemblies market, characterized by early adoption of next-generation data centers and stringent performance standards. The U.S. leads with hyperscale data center investments surpassing $30 billion annually, creating sustained demand for high-fiber-count MPO solutions. Major cloud providers are transitioning to 400G Ethernet networks, where MPO-24 configurations are becoming standard. Canada shows growing traction in provincial connectivity initiatives, though market maturity varies regionally. Regulatory focus on energy efficiency (e.g., Energy Star for Data Centers) encourages innovative, low-loss MPO designs among manufacturers.
Europe
Europe maintains a robust MPO cable assemblies ecosystem centered around data sovereignty regulations and tier-IV data center construction. Germany and the UK host significant manufacturing and R&D facilities for fiber optic components. The EU’s emphasis on green data centers drives demand for MPO solutions supporting higher density with reduced cabinet space and power consumption. Eastern European markets exhibit slower adoption rates due to reliance on legacy copper networks, though fiber deployment projects are accelerating. Brexit-related supply chain adjustments continue to impact UK-based MPO assembly lead times and pricing structures.
Middle East & Africa
This emerging market demonstrates uneven but promising growth for MPO cable assemblies. Gulf Cooperation Council (GCC) countries lead adoption, with smart city projects in Dubai and Saudi Arabia requiring high-bandwidth backbone infrastructure. South Africa serves as the manufacturing and distribution hub for Sub-Saharan Africa, though political instability occasionally disrupts supply chains. The region shows particular interest in ruggedized MPO solutions capable of withstanding extreme environmental conditions. Financing limitations and skill shortages remain key barriers to widespread MPO implementation across the continent.
South America
South America’s MPO cable assemblies market progresses gradually, with Brazil commanding over 60% of regional demand. Growing investment in edge data centers across major cities stimulates need for compact fiber solutions, though economic volatility affects procurement cycles. Argentina and Chile demonstrate increasing MPO adoption in mining and energy sectors where fiber reliability is critical. The region struggles with inconsistent broadband policies and import dependency for advanced fiber optic components, creating pricing disadvantages compared to Asian-manufactured alternatives.
Report Scope
This market research report provides a comprehensive analysis of the global and regional MPO Cable Assemblies markets, covering the forecast period 2024–2032. It offers detailed insights into market dynamics, technological advancements, competitive landscape, and key trends shaping the industry.
Key focus areas of the report include:
- Market Size & Forecast: Historical data and future projections for revenue, unit shipments, and market value across major regions and segments. The global MPO Cable Assemblies market was valued at USD million in 2024 and is projected to reach USD million by 2032.
- Segmentation Analysis: Detailed breakdown by product type (8 Fiber, 12 Fiber, 24 Fiber Options), application (Data Centers, Telecommunications, Military and Aerospace), and end-user industry to identify high-growth segments.
- Regional Outlook: Insights into market performance across North America (U.S. estimated at USD million in 2024), Europe, Asia-Pacific (China to reach USD million), Latin America, and Middle East & Africa.
- Competitive Landscape: Profiles of leading market participants including CommScope, AFL, Amphenol-FOP, WCFO, and Optec Technology Limited, covering their market share, product portfolios, and strategic developments.
- Technology Trends & Innovation: Assessment of evolving fiber optic technologies, high-density connectivity solutions, and industry standards for data transmission.
- Market Drivers & Restraints: Evaluation of factors such as growing data center demand, 5G deployment, cloud computing expansion, along with supply chain challenges and technical barriers.
- Stakeholder Analysis: Strategic insights for cable manufacturers, network equipment providers, data center operators, and telecom service providers.
The research employs primary interviews with industry experts and analysis of verified market data to ensure accuracy and reliability of all projections and insights.
FREQUENTLY ASKED QUESTIONS:
What is the current market size of Global MPO Cable Assemblies Market?
-> MPO Cable Assemblies Market was valued at USD 1.2 billion in 2024. The market is projected to grow from USD 1.35 billion in 2025 to USD 2.8 billion by 2032, exhibiting a CAGR of 10.5% during the forecast period.
Which key companies operate in Global MPO Cable Assemblies Market?
-> Key players include CommScope, AFL, Amphenol-FOP, WCFO, Optec Technology Limited, Infinite Electronics, and T&S Communications, among others.
What are the key growth drivers?
-> Key growth drivers include rising data center deployments, increasing bandwidth requirements, 5G network expansion, and demand for high-density connectivity solutions.
Which region dominates the market?
-> North America currently leads the market, while Asia-Pacific is expected to show the highest growth rate during the forecast period.
What are the emerging trends?
-> Emerging trends include development of higher fiber count MPOs, adoption in hyperscale data centers, and integration with next-gen network architectures.

Get Sample Report PDF for Exclusive Insights
Report Sample Includes
- Table of Contents
- List of Tables & Figures
- Charts, Research Methodology, and more...