Micro Battery Products Market Overview
The microbattery power densities were up to 7.4 mw cm-2 mm-1, which equals or exceeds that of the best supercapacitors, is 100X greater than conventional batteries.
This report provides a deep insight into the global Micro Battery Products market covering all its essential aspects. This ranges from a macro overview of the market to micro details of the market size, competitive landscape, development trend, niche market, key market drivers and challenges, SWOT analysis, value chain analysis, etc.
The analysis helps the reader to shape the competition within the industries and strategies for the competitive environment to enhance the potential profit. Furthermore, it provides a simple framework for evaluating and accessing the position of the business organization. The report structure also focuses on the competitive landscape of the Global Micro Battery Products Market, this report introduces in detail the market share, market performance, product situation, operation situation, etc. of the main players, which helps the readers in the industry to identify the main competitors and deeply understand the competition pattern of the market.
In a word, this report is a must-read for industry players, investors, researchers, consultants, business strategists, and all those who have any kind of stake or are planning to foray into the Micro Battery Products market in any manner.
Micro Battery Products Market Analysis:
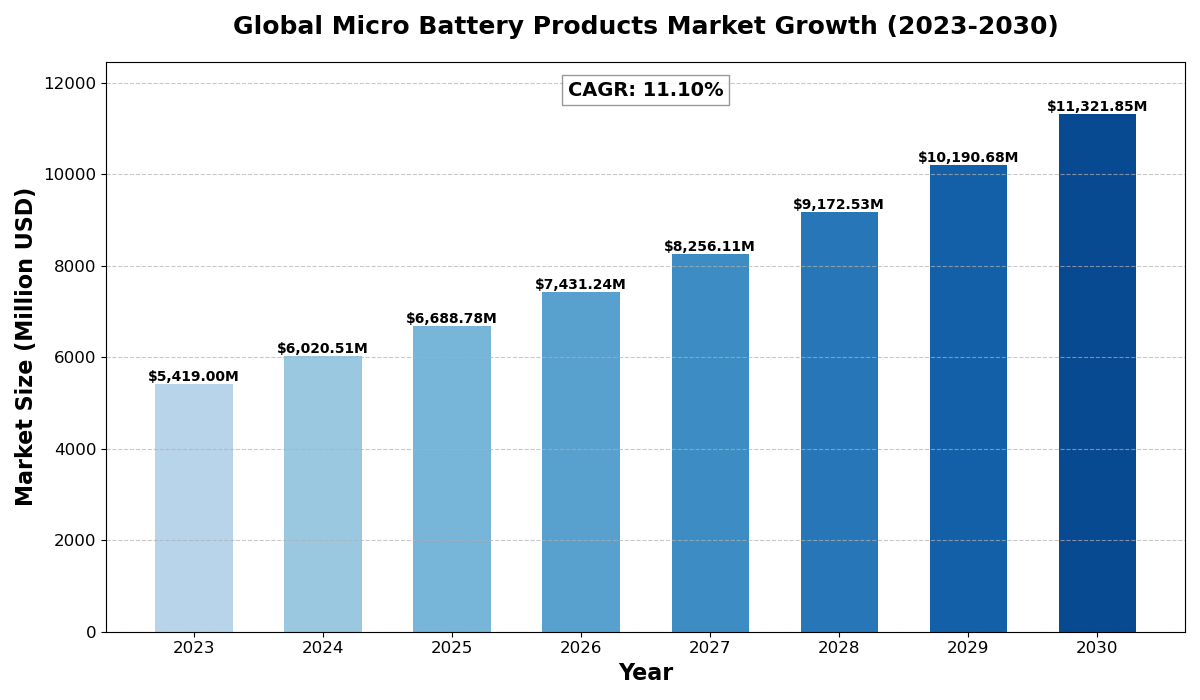
The global Micro Battery Products Market size was estimated at USD 5419 million in 2023 and is projected to reach USD 11321.85 million by 2030, exhibiting a CAGR of 11.10% during the forecast period.
North America Micro Battery Products market size was USD 1412.04 million in 2023, at a CAGR of 9.51% during the forecast period of 2025 through 2030.
Micro Battery Products Key Market Trends :
- Growing Demand for Wearable Technology – Increasing adoption of smartwatches, fitness trackers, and medical wearables is driving demand for compact, high-energy microbatteries.
- Advancements in Solid-State Battery Technology – Development of solid-state microbatteries is improving battery life, safety, and performance.
- Rising IoT Applications – Expansion of Internet of Things (IoT) devices in smart homes, healthcare, and industrial automation is fueling market growth.
- Miniaturization of Consumer Electronics – The demand for smaller, more powerful batteries is growing as electronic devices continue to shrink in size.
- Increasing Focus on Sustainable Energy Solutions – Manufacturers are exploring recyclable and eco-friendly battery solutions to reduce environmental impact.
Micro Battery Products Market Regional Analysis :

-
North America:
Strong demand driven by EVs, 5G infrastructure, and renewable energy, with the U.S. leading the market.
-
Europe:
Growth fueled by automotive electrification, renewable energy, and strong regulatory support, with Germany as a key player.
-
Asia-Pacific:
Dominates the market due to large-scale manufacturing in China and Japan, with growing demand from EVs, 5G, and semiconductors.
-
South America:
Emerging market, driven by renewable energy and EV adoption, with Brazil leading growth.
-
Middle East & Africa:
Gradual growth, mainly due to investments in renewable energy and EV infrastructure, with Saudi Arabia and UAE as key contributors.
Micro Battery Products Market Segmentation :
The research report includes specific segments by region (country), manufacturers, Type, and Application. Market segmentation creates subsets of a market based on product type, end-user or application, Geographic, and other factors. By understanding the market segments, the decision-maker can leverage this targeting in the product, sales, and marketing strategies. Market segments can power your product development cycles by informing how you create product offerings for different segments.
Key Company
- Seiko
- VARTA
- Toshiba
- Murata
- Duracell
- Energizer
- ICellTech
Market Segmentation (by Type)
- Manganese Silicon Lithium Rechargeable Batteries
- TS Lithium Rechargeable Batteries
- Silver Oxide Batteries
Market Segmentation (by Application)
- Commercial
- Industrial
- Residential
- Others
Market Drivers
- Expanding Consumer Electronics Industry – Rising demand for compact and efficient power sources in smart devices and wearables is propelling market growth.
- Rapid Growth of Medical Implantable Devices – Increased use of microbatteries in pacemakers, hearing aids, and neurostimulators is driving innovation.
- Development of Next-Generation Battery Technologies – Ongoing research in solid-state and flexible battery solutions is enhancing product capabilities.
Market Restraints
- High Manufacturing Costs – Advanced microbattery technologies require costly raw materials and complex production processes.
- Limited Energy Storage Capacity – Despite improvements, microbatteries still struggle with energy density compared to traditional power sources.
- Stringent Environmental Regulations – Battery disposal and recycling challenges could impact market expansion.
Market Opportunities
- Integration with 5G and IoT Technologies – Growth in 5G-enabled devices and IoT applications presents significant demand for microbatteries.
- Expansion into Automotive Applications – Electric vehicles (EVs) and self-powered sensors are emerging as new application areas.
- Rising Demand in Aerospace & Defense – Microbatteries are being adopted in drones, satellites, and defense communication systems.
Market Challenges
- Competition from Alternative Energy Sources – Fuel cells and advanced supercapacitors pose a challenge to battery adoption.
- Supply Chain Disruptions – Raw material shortages and geopolitical tensions may impact production and pricing.
- Battery Safety Concerns – Issues like overheating, leakage, and performance degradation remain a challenge for manufacturers.
Key Benefits of This Market Research:
- Industry drivers, restraints, and opportunities covered in the study
- Neutral perspective on the market performance
- Recent industry trends and developments
- Competitive landscape & strategies of key players
- Potential & niche segments and regions exhibiting promising growth covered
- Historical, current, and projected market size, in terms of value
- In-depth analysis of the Micro Battery Products Market
- Overview of the regional outlook of the Micro Battery Products Market:
Key Reasons to Buy this Report:
- Access to date statistics compiled by our researchers. These provide you with historical and forecast data, which is analyzed to tell you why your market is set to change
- This enables you to anticipate market changes to remain ahead of your competitors
- You will be able to copy data from the Excel spreadsheet straight into your marketing plans, business presentations, or other strategic documents
- The concise analysis, clear graph, and table format will enable you to pinpoint the information you require quickly
- Provision of market value (USD Billion) data for each segment and sub-segment
- Indicates the region and segment that is expected to witness the fastest growth as well as to dominate the market
- Includes in-depth analysis of the market from various perspectives through Porters five forces analysis
- Provides insight into the market through Value Chain
- Market dynamics scenario, along with growth opportunities of the market in the years to come
- 6-month post-sales analyst support
Customization of the Report
In case of any queries or customization requirements, please connect with our sales team, who will ensure that your requirements are met.
FAQs
Q: What are the key driving factors and opportunities in the Micro Battery Products market?
A: The key drivers include the growing demand for wearable devices, IoT expansion, and medical implantable devices. Opportunities lie in 5G integration, automotive applications, and aerospace advancements.
Q: Which region is projected to have the largest market share?
A: Asia-Pacific is expected to dominate the market due to strong demand from consumer electronics, healthcare, and industrial applications.
Q: Who are the top players in the global Micro Battery Products market?
A: Major companies include Seiko, VARTA, Toshiba, Murata, Duracell, Energizer, and ICellTech.
Q: What are the latest technological advancements in the industry?
A: Key advancements include solid-state battery development, flexible battery designs, and eco-friendly battery solutions.
Q: What is the current size of the global Micro Battery Products market?
A: The market was valued at USD 5419 million in 2023 and is projected to reach USD 11321.85 million by 2030, with a CAGR of 11.10%.

Get Sample Report PDF for Exclusive Insights
Report Sample Includes
- Table of Contents
- List of Tables & Figures
- Charts, Research Methodology, and more...


