Key Statistics
Key Takeaways
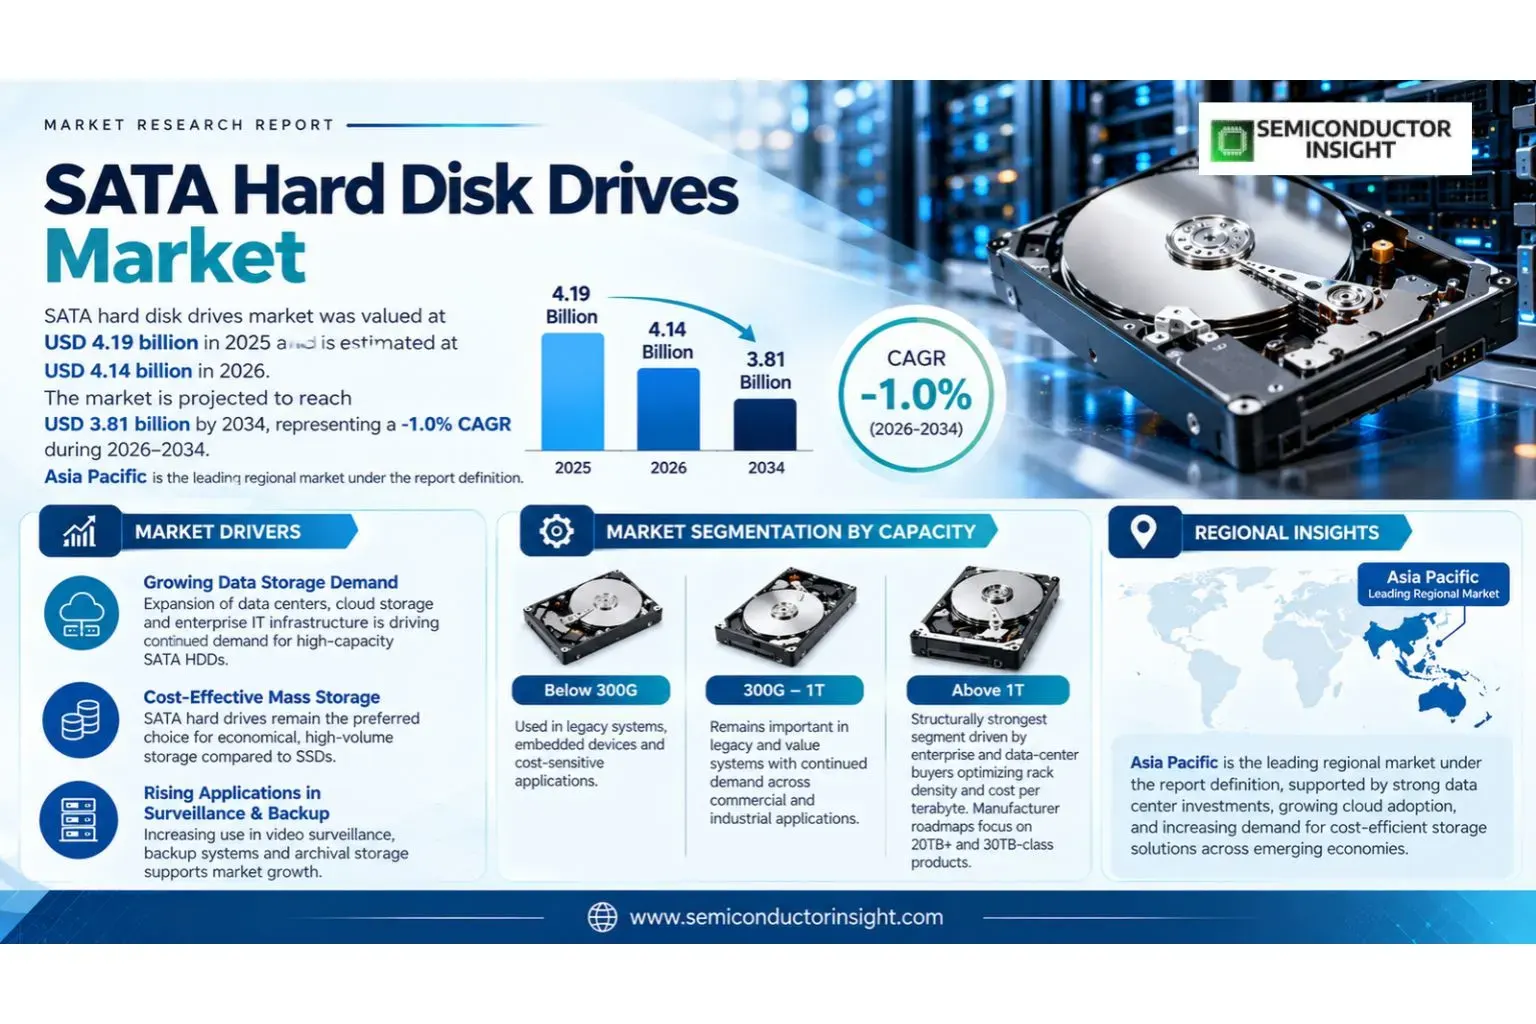
- The market moves from USD 4.19 billion in 2025 to USD 3.81 billion in 2034, corresponding to a -1.0% CAGR during 2026–2034. Revenue pressure reflects client-device substitution by SSDs, while high-capacity enterprise, data-center, surveillance and archival workloads preserve a durable need for low-cost spinning storage.
- Above-1TB drives are structurally the most defensible capacity segment because HDD economics improve when buyers optimize dollars per terabyte and rack capacity rather than latency. New 26TB, 30TB and 32TB products show that vendor investment is concentrated in mass-capacity tiers rather than low-capacity client drives.
- Enterprise storage and data centers form the most resilient application base. High-capacity nearline HDDs remain attractive for warm, cold and bulk data tiers where sequential throughput, endurance and cost per terabyte matter more than flash-class latency.
- Asia Pacific leads unit-oriented demand and remains central to manufacturing and electronics supply chains, while North America is strategically important because hyperscale cloud operators and large enterprise storage buyers absorb the newest high-capacity drives.
- HAMR, ePMR, SMR, OptiNAND and higher platter counts are reshaping competition. The market is not growing through broad unit expansion; it is migrating toward fewer but substantially larger drives, making areal density and qualification with hyperscale customers the primary sources of value.
SATA Hard Disk Drives Market Overview
SATA hard disk drives market was valued at USD 4.19 billion in 2025 and is estimated at USD 4.14 billion in 2026. The market is projected to reach USD 3.81 billion by 2034, representing a -1.0% CAGR during 2026–2034. Asia Pacific is the leading regional market under the report definition.
SATA hard disk drives use magnetic platters, read/write heads and the Serial ATA interface to provide persistent block storage. The report scope covers capacity tiers below 300G, 300G–1T and above 1T; applications across consumer electronics, enterprise storage, data centers, gaming consoles and other uses; 2.5-inch and 3.5-inch form factors; and end users including IT and telecom, BFSI, healthcare, retail and others. The defining economic advantage is low cost per terabyte at high capacity rather than latency or random I/O performance.
The technology is mature but not static. Manufacturers continue to raise areal density through energy-assisted magnetic recording, shingled magnetic recording, helium-sealed platforms, advanced actuators and firmware-assisted architectures. Western Digital is shipping UltraSMR HDDs up to 32TB and CMR drives up to 26TB, while Seagate’s Mozaic 3+ HAMR platform supports 30TB-class products and Toshiba has demonstrated more than 30TB using HAMR and MAMR. These advances shift market value toward mass-capacity enterprise drives even as client HDD volumes decline.
Demand is therefore bifurcated. SSDs have displaced HDDs from performance-sensitive notebooks, premium desktops and many application servers, but large data repositories still require economical capacity. Data centers use HDDs for object storage, backup, archives, media, surveillance and data lakes where the cost of retaining petabytes outweighs the benefit of flash latency. This creates a market that can decline modestly in revenue while still shipping rising exabytes as average capacity per drive increases.
Segment Analysis: By Type
By type, the report segments the market by capacity into Below 300G, 300G–1T and Above 1T. The 300G–1T range remains important in legacy and value systems, but the above-1T category is the structurally strongest segment because enterprise and data-center buyers increasingly optimize rack density and cost per terabyte. Manufacturer roadmaps are concentrated in 20TB-plus and 30TB-class products.
| Type | Technical role | Market position |
|---|---|---|
| Below 300G | Low-capacity drives are used mainly in legacy PCs, refurbished systems, embedded equipment and replacement channels where interface compatibility matters more than storage density. These drives require fewer platters but compete directly with inexpensive SATA SSDs whose performance advantage is large at low capacities. | This segment faces the steepest structural decline. Its remaining demand is concentrated in installed-base replacement, price-sensitive geographies and equipment that has not migrated to flash. Suppliers have limited incentive to invest in new technology for these capacities because the strongest HDD economics now occur at the mass-capacity end. |
| 300G-1T | The mid-capacity tier serves desktops, entry NAS, small business storage, surveillance and replacement markets. It balances familiar SATA compatibility with adequate capacity for older systems and is widely available through retail and distribution channels. | A mature segment with persistent but declining demand. It remains useful where buyers need inexpensive replacement drives, yet SSD price declines continue to erode the addressable client market. Product differentiation is limited, so distribution reach, reliability and price have greater influence than recording-technology leadership. |
| Above 1T | High-capacity HDDs use multiple platters, helium sealing, advanced recording and sophisticated firmware to maximize terabytes per 3.5-inch drive. Enterprise products can support sustained workloads and long service periods, while SMR variants trade write behavior for higher density. | The most defensible and innovation-intensive segment. Western Digital is shipping 32TB UltraSMR and 26TB CMR products, Seagate has commercial 30TB-class HAMR drives, and Toshiba has demonstrated more than 30TB. These capacities directly address hyperscale and enterprise demand for lower cost per stored terabyte. |
Capacity growth is replacing unit growth as the central value driver
The market’s economic center has shifted from selling more drives to storing more exabytes with fewer devices. Western Digital’s 32TB UltraSMR platform and Seagate’s 30TB-class HAMR products illustrate how vendors raise revenue potential through capacity points that reduce rack count, power per terabyte and supporting infrastructure. This dynamic makes areal density, platter count and qualification cycles more important than unit shipments alone, especially as low-capacity client HDDs continue losing sockets to SSDs.
Segment Analysis: By Application
By application, the market is segmented into Consumer Electronics, Enterprise Storage, Data Centers, Gaming Consoles and Others. Enterprise storage and data centers provide the most durable demand because bulk, warm and cold data tiers prioritize capacity economics. Consumer and gaming applications are more exposed to SSD substitution because users place greater value on boot time, latency, shock resistance and compact form factors.
| Application | Demand characteristics |
|---|---|
| Consumer Electronics | Demand comes from desktop PCs, DVRs, external storage, home NAS and legacy consumer devices that still value low-cost capacity. The purchasing trigger is usually replacement or incremental storage rather than performance. This segment is shrinking as notebooks and premium desktops move to SSDs, but removable and external storage use cases preserve demand where buyers need multiple terabytes at a low upfront cost. |
| Enterprise Storage | Enterprise buyers use SATA HDDs for backup, archive, shared storage, file repositories and capacity tiers that do not justify flash economics. Procurement emphasizes reliability, workload ratings, long qualification cycles, warranty and predictable firmware behavior. The segment remains resilient because large organizations retain data for compliance, analytics and recovery, creating continuous demand for economical capacity even when performance-sensitive workloads migrate to SSD arrays. |
| Data Centers | Data centers represent the core mass-capacity opportunity. Hyperscale operators and cloud providers deploy large fleets of nearline HDDs for object storage and data lakes, where terabytes per rack, watts per terabyte and drive replacement rates directly affect operating cost. High-capacity products gain value because fewer drives are needed for the same storage pool, reducing slots, enclosures, cables and supporting power requirements. |
| Gaming Consoles | Gaming-console HDD demand is increasingly legacy-oriented as newer platforms favor solid-state storage for load times and high-bandwidth assets. SATA HDDs still serve installed consoles, external game libraries and lower-cost capacity expansion. The commercial opportunity is therefore replacement and accessory storage rather than core platform growth, and capacity per dollar remains the primary reason a user chooses an HDD over flash. |
| Others | Other applications include surveillance, media archives, research data, cold storage and specialized appliances. Surveillance is particularly well suited to HDDs because workloads involve continuous sequential writes and long retention periods rather than low-latency random access. Vendors differentiate with workload ratings, vibration tolerance and firmware tuned for multi-bay environments, making application-specific reliability more important than headline interface speed. |
Regional Analysis
Asia Pacific is the largest region by unit-oriented demand and remains central to HDD manufacturing and electronics supply chains. North America is strategically important for mass-capacity drives because large cloud and enterprise operators adopt the newest high-capacity platforms. Europe emphasizes enterprise, surveillance and regulated data retention, while South America and the Middle East and Africa retain stronger low-cost replacement and surveillance demand in markets where SSD affordability varies widely.
How does regional demand differ across the SATA hard disk drives market?
The regions are at different points in the HDD-to-SSD transition. Asia Pacific combines large electronics markets, manufacturing and price-sensitive capacity demand. North America consumes large numbers of enterprise nearline drives through hyperscale data centers while client HDD demand is mature. Europe has strong enterprise, industrial and surveillance use but rapid flash adoption in personal computing. South America and parts of the Middle East and Africa retain more replacement and value-tier HDD demand because device lifecycles are longer and cost per gigabyte remains a stronger purchasing constraint.
| Region | Position | Growth outlook | Demand profile | What decides supplier selection |
|---|---|---|---|---|
| Asia Pacific | Largest | Mixed, capacity-led | Manufacturing, cloud and value storage | Cost per TB, availability and capacity |
| North America | Strategic mass-capacity market | Stable in enterprise, declining in client | Hyperscale and enterprise | Qualification, reliability, watts/TB and TCO |
| Europe | Mature | Moderate decline overall | Enterprise, surveillance and industrial | Compliance, reliability and energy efficiency |
| South America | Smaller | Value-led | Replacement, SMB and surveillance | Landed cost, channel availability and warranty |
| Middle East & Africa | Smaller but heterogeneous | Selective growth | Surveillance, enterprise and replacement | Price, distribution, climate tolerance and support |
Key SATA Hard Disk Drives Manufacturers and Competitive Landscape
The HDD market is structurally concentrated because magnetic-drive manufacturing requires specialized heads, media, motors, firmware, precision assembly and decades of process know-how. Seagate, Western Digital and Toshiba are the direct global HDD manufacturers in the profiled list, while Dell, HPE, Lenovo and other names primarily participate as system vendors, OEMs, customers or adjacent storage companies. Competition therefore centers on areal density, reliability, qualification and exabyte economics rather than rapid entry by new drive manufacturers.
Seagate is using HAMR as the core of its mass-capacity roadmap. The Mozaic 3+ platform reached 30TB-class products and targets higher areal density per platter, allowing the company to increase capacity without proportionally increasing drive materials or rack footprint. The strategic value is strongest with cloud and enterprise customers that measure storage economics in dollars and watts per terabyte rather than drive unit price.
Western Digital is pursuing a parallel path through ePMR, OptiNAND, UltraSMR, an 11-disk platform and higher-capacity CMR products. Its October 2024 announcement of 32TB UltraSMR and 26TB CMR drives demonstrates how the company serves both hyperscale buyers comfortable with host-managed recording behavior and enterprise customers that prefer conventional CMR integration. This dual roadmap reduces dependence on a single recording transition.
Toshiba remains the third global HDD manufacturer and is developing both HAMR and MAMR. Its May 2024 demonstration of more than 30TB with both approaches shows that technology competition remains active despite the industry’s concentration. Toshiba’s challenge is scale relative to the two larger manufacturers, but its presence is strategically important to customers that want supplier diversification and additional qualification options for enterprise storage.
Tier structure
| Competitive tier | Participants | Commercial basis |
|---|---|---|
| Tier 1 HDD manufacturers | Seagate Technology; Western Digital; Toshiba Electronic Devices & Storage | Direct design and manufacture of magnetic drives, with differentiation through areal density, recording technology, firmware, reliability and hyperscale qualification. |
| System OEMs and enterprise integrators | Dell Technologies; HP Enterprise; Lenovo | Purchase, qualify and integrate HDDs into servers, storage arrays and client systems. Their influence comes from platform specifications and customer access rather than direct magnetic-media manufacturing. |
| Adjacent storage and channel participants | Samsung Electronics; Longsys Electronics | Participate in broader storage ecosystems, flash products, electronics and channel markets. Their presence in the profiled list should not be interpreted as equivalent direct manufacturing scale in HDDs. |
Companies profiled: Seagate Technology LLC, Western Digital Corporation, Toshiba Electronic Devices & Storage Corporation, Dell Technologies, HP Enterprise, Lenovo Group Limited, Samsung Electronics, Longsys Electronics. The profiled list is reproduced from the report scope. Where a profiled organization is primarily a system vendor, OEM, cloud operator or customer rather than a merchant chipset or drive manufacturer, the competitive discussion distinguishes that role instead of treating every name as a direct product supplier.
SATA Hard Disk Drives Production Capacity Analysis
SATA HDD production is capital intensive and highly specialized, with capacity concentrated among Seagate, Western Digital and Toshiba. The manufacturing chain includes magnetic media, read/write heads, precision motors, actuators, controllers, PCBs, mechanical components and final clean-room assembly. High-capacity products increase process complexity because more platters, tighter head-media spacing and advanced recording technologies must meet enterprise reliability targets at acceptable yield.
Production economics are increasingly driven by exabytes rather than drive units. A 30TB drive can replace multiple lower-capacity devices in a storage pool, so manufacturers can ship fewer units while still delivering more aggregate capacity. This makes areal-density progress central to factory productivity because each platter and drive slot carries more data. The commercial payoff is strongest when density gains do not materially increase failure rates, power or qualification time.
Head and media manufacturing are important upstream constraints because HAMR and MAMR require specialized materials and precision. Seagate’s HAMR implementation uses a new media and head architecture, while Toshiba is developing both HAMR and MAMR paths. These transitions require capital investment and yield learning, so ramp speed is limited by manufacturing maturity rather than only market demand. A recording technology that performs in the laboratory must still reach cost-effective volume production.
Final assembly and qualification are also highly regionalized. HDD factories and component suppliers are concentrated in Asia, while hyperscale customers often qualify firmware and drive platforms over long periods before broad deployment. This creates a lag between product announcement and full revenue contribution. Vendors must therefore coordinate factory ramps with customer qualification windows, inventory strategy and channel demand, especially when new capacity points require changes in storage-system firmware or host-managed SMR behavior.
SATA Hard Disk Drives Market Dynamics: Drivers, Restraints and Opportunities
The market is in managed transition rather than simple obsolescence. SSDs continue to eliminate HDDs from latency-sensitive client and primary-storage workloads, but data growth and higher areal density preserve a strong role in economical mass storage. The most important market dynamic is the widening gap between declining low-capacity units and rising exabytes per drive. Manufacturers that successfully commercialize 30TB-class and higher products can defend revenue even as total drive shipments fall.
MARKET DRIVERS
| Driver | Impact | Why it matters |
|---|---|---|
| Data growth and retention | High | More generated and retained data expands the capacity requirement for backup, object storage, surveillance and archives. |
| Higher areal density | High | 30TB-class drives reduce dollars and watts per terabyte, improving HDD economics at scale. |
| Hyperscale and cloud storage | High | Large object-storage fleets continue to value mass capacity where latency requirements are moderate. |
| Surveillance and archival workloads | Medium | Sequential-write and long-retention workloads align well with HDD strengths and support application-specific products. |
Data growth sustains demand for economical capacity
Organizations generate logs, video, AI datasets, backups, research data and compliance archives faster than all of it can economically reside on premium flash. HDDs remain useful wherever the storage objective is durable capacity rather than microsecond latency. This mechanism is strongest in object stores and secondary tiers, where a small difference in cost per terabyte becomes material when multiplied across tens or hundreds of petabytes.
Areal density improves system-level economics
Higher-capacity drives increase stored terabytes without requiring the same proportional increase in drive bays, enclosures, power supplies or rack space. Western Digital’s 32TB UltraSMR and Seagate’s 30TB-class HAMR products illustrate how density gains can lower infrastructure cost per stored terabyte. This gives manufacturers a path to defend value even when unit shipments decline, because customers measure total storage capacity and fleet economics rather than number of drives purchased.
Hyperscale storage rewards qualified high-capacity platforms
Cloud providers operate at a scale where small improvements in capacity, power or failure rates have major financial consequences. They can also adapt software and storage architectures to technologies such as SMR when the TCO benefit is sufficient. This makes hyperscale qualification a powerful demand driver for advanced HDD platforms and encourages manufacturers to prioritize high-capacity products whose economics are most visible in very large fleets.
Surveillance and archive workloads remain technically well matched
Video surveillance, media archives and backup systems produce long sequential writes and large retention pools. Those workloads do not require the low latency that justifies all-flash storage, so HDDs retain an attractive cost position. Application-specific firmware, vibration tolerance and workload ratings can further improve reliability in multi-bay recorders and archive appliances, creating defensible niches even as general-purpose client HDD use declines.
MARKET RESTRAINTS
| Restraint | Impact | Why it matters |
|---|---|---|
| SSD substitution | High | Flash provides much lower latency, higher random I/O, lower noise and better shock resistance, removing HDDs from many client and primary-storage workloads. |
| Declining low-capacity economics | High | At small capacities, the HDD cost advantage narrows while mechanical complexity remains, reducing the rationale for low-capacity products. |
| Technology transition and yield risk | Medium-High | HAMR and other density technologies require new materials, heads and manufacturing processes that must achieve enterprise reliability at volume. |
| Energy and performance limitations | Medium | HDDs consume power and provide lower IOPS density than SSDs, limiting use in performance-sensitive racks. |
SSD adoption continues to remove client sockets
The most direct restraint is the superior latency, random I/O, shock resistance and compactness of SSDs. New notebooks and premium desktops overwhelmingly favor flash, and application servers increasingly use NVMe storage. This leaves HDDs competing primarily where capacity economics dominate. The effect is structural rather than cyclical: even if NAND prices rise temporarily, many device designs no longer include the mechanical space or performance assumptions needed for HDDs.
Low-capacity HDDs lose their economic rationale first
A mechanical drive carries motors, heads, platters and precision assembly costs that do not scale down as efficiently as flash at low capacities. As a result, the price difference between a small HDD and a SATA SSD can become too narrow to compensate for the HDD’s performance disadvantage. Manufacturers therefore concentrate engineering on large 3.5-inch products, while lower-capacity segments depend increasingly on replacement and legacy demand.
Next-generation recording technologies introduce manufacturing risk
HAMR, MAMR and new platter architectures must deliver high areal density without compromising reliability, yield or cost. A drive may meet a capacity milestone but still require extended customer qualification before it can enter high-volume fleets. This creates timing risk because manufacturers invest in new heads, media and process equipment before the revenue ramp is fully proven. Delays can reduce the expected cost advantage of a new capacity generation.
Performance and power limit HDD use in dense compute environments
HDDs deliver far fewer random I/O operations per device than SSDs and include mechanical seek latency. In racks where applications need high IOPS density, more HDDs may be required to achieve performance targets, offsetting capacity savings. Power per drive and cooling also matter, although higher capacity can improve watts per terabyte. The net result is a clear separation between capacity-oriented tiers that favor HDDs and performance-oriented tiers that favor flash.
MARKET OPPORTUNITIES
30TB-class and higher mass-capacity drives
The clearest opportunity is continued migration to higher capacities. Seagate, Western Digital and Toshiba are all advancing beyond 30TB through different recording approaches. Customers benefit from fewer drives per petabyte, while manufacturers can preserve value through areal-density leadership. The opportunity is strongest in hyperscale, enterprise backup, object storage and private-cloud environments where fleet-level economics justify long qualification cycles.
AI data lakes and secondary storage
AI infrastructure requires fast accelerators and flash for active datasets, but it also produces large volumes of raw data, checkpoints, generated content and historical versions that do not need to remain on premium media. HDDs can serve this secondary tier at lower cost per terabyte. Suppliers that position mass-capacity drives as part of mixed flash-HDD architectures can benefit from AI growth without competing directly on primary-storage latency.
Surveillance and edge retention
Smart-city, retail, industrial and security systems generate continuous video that must often be stored locally before being moved or deleted. Surveillance-grade HDDs can combine high capacities with firmware optimized for sequential writes and multi-bay vibration. Growth depends on camera counts, retention policies and analytics workflows, creating a distinct opportunity that is less correlated with PC replacement cycles.
Channel expansion of enterprise capacities
As 30TB-class products move from early hyperscale qualification into wider enterprise and NAS channels, smaller organizations can adopt density improvements that were previously limited to the largest cloud operators. This broadens the addressable market for high-capacity drives and gives distributors and system integrators new premium products. Successful vendors must pair capacity with clear compatibility, warranty and workload guidance because smaller buyers have less ability to customize storage software around new recording behavior.
SATA Hard Disk Drives Supply Chain Analysis
Stage 1
Stage 2
Stage 3
Stage 4
The upstream stage includes magnetic media, read/write heads, motors, bearings, actuators and semiconductor controllers. Technology transitions such as HAMR materially change head and media requirements, which means supplier capability must advance together. The bottleneck is process precision: microscopic variations can affect yield and long-term reliability. Because the industry has only three global drive manufacturers, component qualification is tightly integrated with each vendor’s internal product roadmap.
Drive integration combines multiple platters and heads inside a sealed 2.5-inch or 3.5-inch mechanism with firmware, cache and the SATA interface. High-capacity enterprise drives also use helium, advanced actuators and sophisticated error-management algorithms. This stage captures value through mechanical engineering and manufacturing yield. Increasing platter counts or areal density can raise capacity, but only if vibration, thermal behavior and reliability remain within enterprise specifications.
OEM and customer qualification is a major commercial stage. Server vendors, storage-array makers and hyperscale operators validate firmware behavior, error recovery, workload endurance and compatibility before broad deployment. SMR can require host or system awareness, so qualification may involve software as well as hardware. The result is a long sales cycle in which product availability does not immediately equal revenue scale; successful qualification can, however, lead to very large fleet orders.
The downstream stage determines whether HDD economics are attractive for a workload. Data centers value capacity per rack and watts per terabyte; enterprises emphasize reliability and support; surveillance systems need sustained write behavior; consumers primarily compare upfront price and compatibility. These different economics explain why HDDs can decline sharply in notebooks while remaining essential in mass storage. The product succeeds where low-cost retention matters more than low latency.
Recent Developments in the SATA Hard Disk Drives Market
15 Jul 2025 — Seagate expands 30TB HAMR drives into global channel
Seagate announced global channel availability of up to 30TB Exos M and IronWolf Pro drives using its Mozaic 3+ HAMR platform. Wider channel availability moves 30TB-class capacity beyond early hyperscale deployments and increases access for enterprise, NAS and professional storage customers. The development also affects purchasing decisions by changing available capacity, qualification choices, infrastructure economics and the timing of customer migrations to the newest product generation. Official source.
15 Oct 2024 — Western Digital ships 32TB UltraSMR and 26TB CMR drives
Western Digital announced shipping of an 11-disk 32TB UltraSMR HDD and a 26TB CMR HDD for hyperscale, cloud and enterprise customers. The products increase capacity per drive while preserving the 3.5-inch data-center form factor, directly improving rack-density economics. The development also affects purchasing decisions by changing available capacity, qualification choices, infrastructure economics and the timing of customer migrations to the newest product generation. Official source.
14 May 2024 — Toshiba demonstrates more than 30TB with HAMR and MAMR
Toshiba reported successful demonstrations above 30TB using both HAMR and MAMR, including a 32TB 10-disk HAMR design with SMR. The dual-technology program shows that the third global HDD manufacturer is actively investing in next-generation areal density rather than exiting the market. The development also affects purchasing decisions by changing available capacity, qualification choices, infrastructure economics and the timing of customer migrations to the newest product generation. Official source.
17 Jan 2024 — Seagate ramps Mozaic 3+ 30TB-class drives
Seagate announced volume ramp of its Mozaic 3+ HAMR platform with 3TB-plus per platter and 30TB-plus Exos products. The development marks a manufacturing transition toward heat-assisted recording and provides a roadmap for further density gains without changing the standard enterprise drive form factor. The development also affects purchasing decisions by changing available capacity, qualification choices, infrastructure economics and the timing of customer migrations to the newest product generation. Official source.
REPORT SCOPE & SEGMENTATION
| Attribute | Coverage |
|---|---|
| Report title | SATA Hard Disk Drives Market Size, Share & Industry Analysis, By Type (Below 300G, 300G-1T, Above 1T), By Application (Consumer Electronics, Enterprise Storage, Data Centers, Gaming Consoles, Others), By Form Factor (2.5-inch, 3.5-inch), By End User (IT & Telecom, BFSI, Healthcare, Retail, Others), and Regional Forecast, 2026-2034 |
| Base year | 2025 |
| Estimated year | 2026 |
| Forecast period | 2026–2034 |
| Market value | USD 4.19 billion in 2025; USD 4.14 billion in 2026; USD 3.81 billion in 2034; CAGR -1.0% |
| By Type | Below 300G, 300G-1T, Above 1T |
| By Application | Consumer Electronics, Enterprise Storage, Data Centers, Gaming Consoles, Others |
| By Form Factor | 2.5-inch, 3.5-inch |
| By End User | IT & Telecom, BFSI, Healthcare, Retail, Others |
| Regions | North America; Europe; Asia Pacific; South America; Middle East & Africa |
| Companies profiled | Seagate Technology LLC, Western Digital Corporation, Toshiba Electronic Devices & Storage Corporation, Dell Technologies, HP Enterprise, Lenovo Group Limited, Samsung Electronics, Longsys Electronics |
Frequently Asked Questions
What is the current size of the SATA hard disk drives market?
The global SATA hard disk drives market is valued at USD 4.19 billion in 2025 and is estimated at USD 4.14 billion in 2026. It is projected to reach USD 3.81 billion by 2034, representing a -1.0% CAGR during 2026–2034. The modest decline reflects continuing SSD substitution in client and performance-sensitive workloads, partly offset by high-capacity enterprise, data-center, surveillance and archival demand.
Which region leads the SATA hard disk drives market?
Asia Pacific is the largest regional market in 2025 under the report’s regional framing, particularly when unit-oriented demand, manufacturing and price-sensitive storage channels are considered. North America remains strategically important for revenue because hyperscale cloud and enterprise operators buy high-capacity nearline drives. Europe is mature, while South America and the Middle East and Africa retain stronger replacement and surveillance demand in cost-sensitive segments.
Which capacity segment has the strongest long-term position?
The above-1T segment has the strongest structural position because the HDD value proposition improves as capacity rises. Modern 3.5-inch enterprise products reach 26TB, 30TB and 32TB-class capacities, allowing data centers to store more information with fewer drive slots and supporting components. Lower-capacity segments face much heavier competition from SATA and NVMe SSDs because the flash price premium is smaller while the performance advantage remains large.
What are the main application segments for SATA HDDs?
The report segments applications into Consumer Electronics, Enterprise Storage, Data Centers, Gaming Consoles and Others. Enterprise and data-center use is the most defensible because backup, object storage and archives prioritize cost per terabyte. Consumer and gaming demand is more exposed to SSD substitution, while surveillance and other sequential-write applications continue to support HDDs where capacity and retention economics outweigh latency requirements.
Who are the key companies profiled in the SATA HDD market?
The report profiles Seagate Technology, Western Digital, Toshiba Electronic Devices & Storage, Dell Technologies, HP Enterprise, Lenovo, Samsung Electronics and Longsys Electronics. Seagate, Western Digital and Toshiba are the direct global HDD manufacturers. Several other profiled companies are system vendors, OEMs or adjacent storage participants, so the competitive analysis distinguishes direct drive manufacturing from integration, customer and channel roles.
What is driving demand for high-capacity SATA HDDs?
The main drivers are data growth, long retention periods, cloud object storage, backups, AI data lakes, surveillance and continuing gains in areal density. Higher-capacity drives lower the number of devices required for a fixed data set, which can reduce rack space, power supplies, enclosures and maintenance events. This system-level economy is the reason manufacturers continue investing in 30TB-class and higher drives despite declining client HDD volumes.
What is the biggest restraint on the SATA HDD market?
SSD substitution is the largest structural restraint. Flash delivers much lower latency, higher random I/O, silent operation and better shock resistance, which makes it superior for notebooks, premium desktops and primary application storage. HDDs remain competitive where storage capacity is the dominant requirement. This creates a market split in which low-capacity client drives decline while mass-capacity enterprise drives retain a strong role in mixed storage architectures.
How are HAMR and other recording technologies changing the market?
HAMR, ePMR, MAMR, SMR and related technologies raise the amount of data stored on each platter or drive. Seagate’s Mozaic 3+ platform commercialized 30TB-class HAMR products, Western Digital ships 32TB UltraSMR products using ePMR and OptiNAND technologies, and Toshiba has demonstrated more than 30TB with both HAMR and MAMR approaches. These advances are critical because HDD competitiveness depends on continuing to lower cost and power per stored terabyte.
Why do data centers still use HDDs alongside SSDs?
Data centers separate workloads by performance requirement. NVMe SSDs are preferred for latency-sensitive databases and active compute, while HDDs remain attractive for object storage, backups, archives and large data lakes. A mixed architecture avoids paying flash prices for data that is accessed infrequently. High-capacity HDDs can therefore remain essential even in AI infrastructure, because raw datasets, checkpoints, logs and generated content can greatly exceed the capacity of the high-performance tier.
What is the SATA HDD market outlook through 2034?
The market is projected to move from USD 4.14 billion in 2026 to USD 3.81 billion in 2034 at a -1.0% CAGR. The central trend is a shift in mix rather than uniform decline: low-capacity client units continue to contract, while mass-capacity enterprise drives become larger and more valuable. Vendor performance will depend on successful recording-technology ramps, hyperscale qualification and the ability to improve terabytes per rack and watts per terabyte.
Research Sources & Evidence Base
View research sources used for this overview.
- Seagate Technology. Seagate’s Breakthrough 30TB+ Hard Drives Ramp Volume — Mozaic 3+ HAMR, 3TB-plus per platter and 30TB-plus product ramp, 17 January 2024
- Western Digital. Western Digital Delivers World’s Highest Capacity ePMR HDDs — 32TB UltraSMR and 26TB CMR shipping announcement, 15 October 2024
- Toshiba Electronic Devices & Storage. Toshiba Successfully Demonstrates Nearline HDDs with Massive Capacity of Over 30 Terabytes — HAMR and MAMR demonstrations above 30TB, 14 May 2024
- Western Digital. Ultrastar DC HC680 Data Center HDD — 28TB SATA product specifications, OptiNAND, eAMR and workload rating
- Seagate Technology. Seagate Ships 30TB Drives to Meet Global Surge in Data Center AI Storage Demand — global channel availability of 30TB Exos M and IronWolf Pro HAMR drives, 15 July 2025
Get Sample Report PDF for Exclusive Insights
Report Sample Includes
- Table of Contents
- List of Tables & Figures
- Charts, Research Methodology, and more...