Memory Automated Test Equipment (ATE) Market Overview
Memory Automated Test Equipment (ATE) refers to specialized testing equipment designed for testing and evaluating memory devices such as RAM (Random Access Memory) and other types of semiconductor memory. The primary purpose of Memory ATE is to ensure that memory components meet specified performance criteria and quality standards before they are integrated into electronic devices or systems.
This report provides a deep insight into the global Memory Automated Test Equipment (ATE) market covering all its essential aspects. This ranges from a macro overview of the market to micro details of the market size, competitive landscape, development trend, niche market, key market drivers and challenges, SWOT analysis, value chain analysis, etc.
The analysis helps the reader to shape the competition within the industries and strategies for the competitive environment to enhance the potential profit. Furthermore, it provides a simple framework for evaluating and accessing the position of the business organization. The report structure also focuses on the competitive landscape of the Global Memory Automated Test Equipment (ATE) Market, this report introduces in detail the market share, market performance, product situation, operation situation, etc. of the main players, which helps the readers in the industry to identify the main competitors and deeply understand the competition pattern of the market.
In a word, this report is a must-read for industry players, investors, researchers, consultants, business strategists, and all those who have any kind of stake or are planning to foray into the Memory Automated Test Equipment (ATE) market in any manner.
Memory Automated Test Equipment (ATE) Market Analysis:
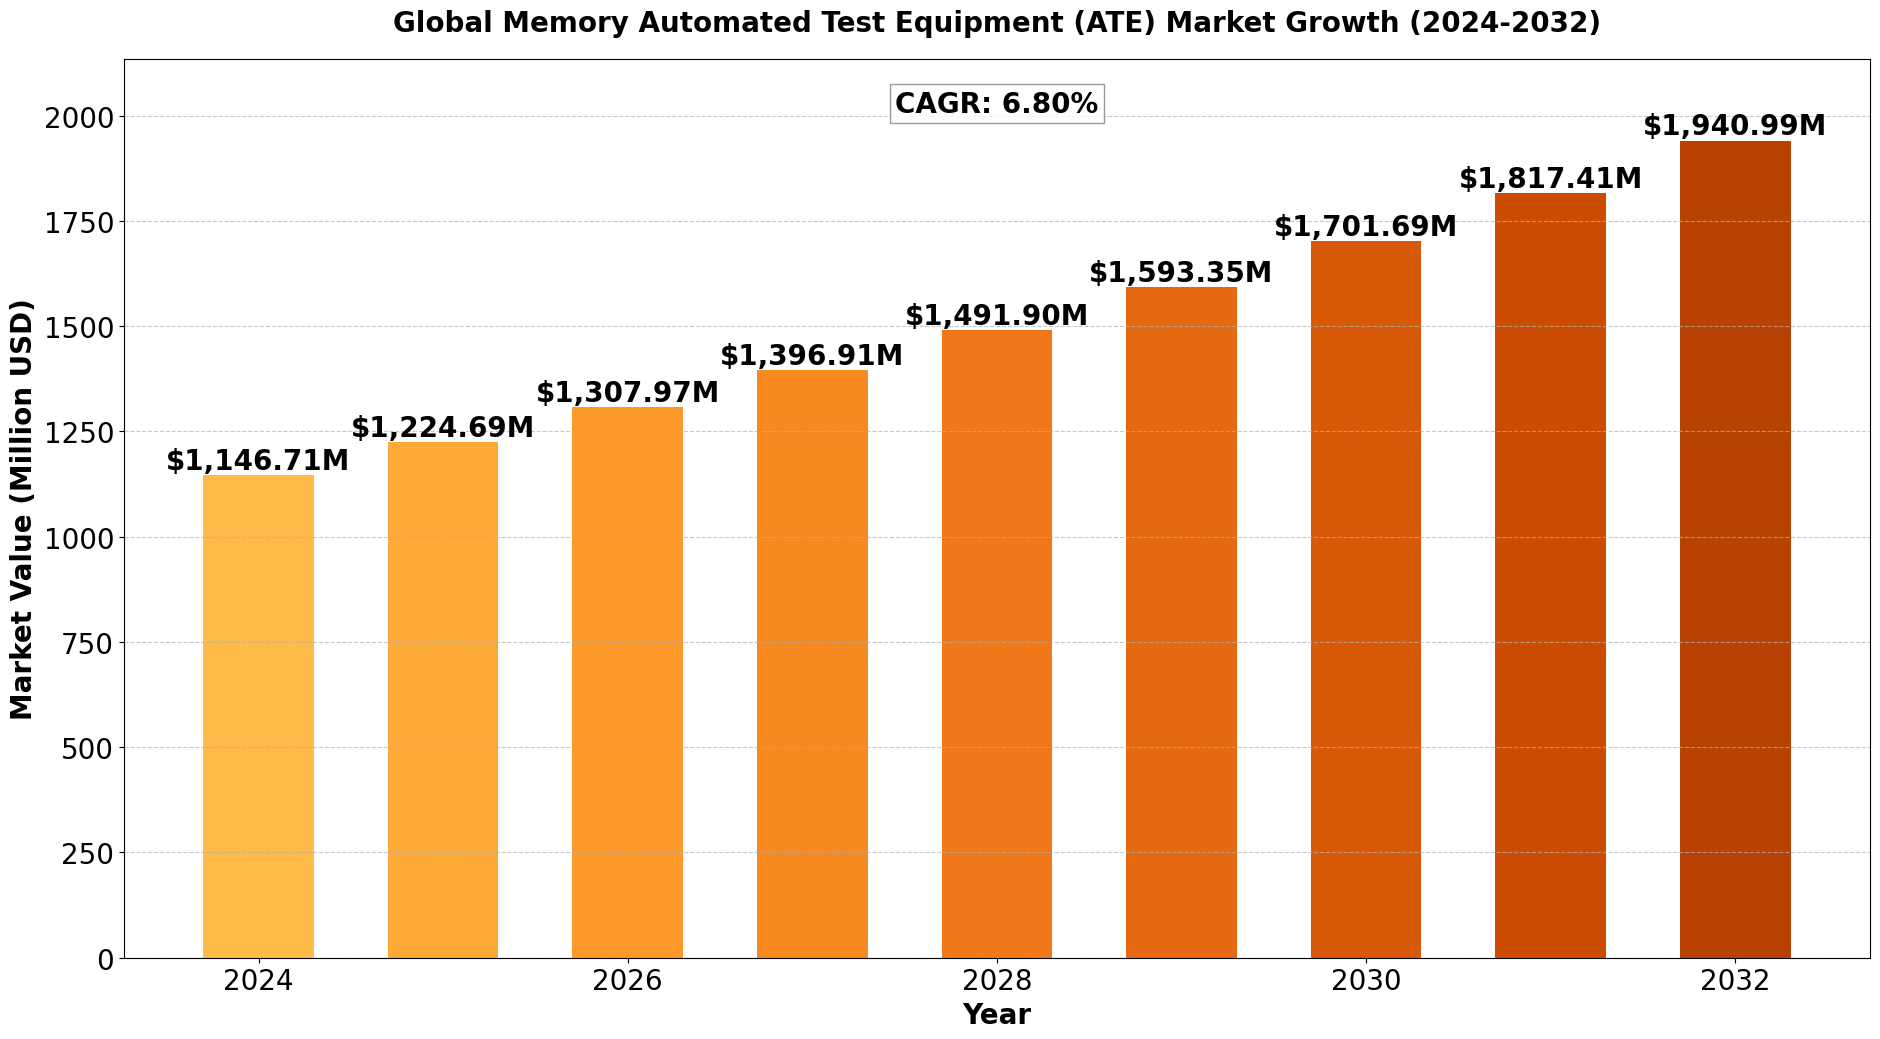
The Global Memory Automated Test Equipment (ATE) Market size was estimated at USD 1073.70 million in 2023 and is projected to reach USD 1940.99 million by 2032, exhibiting a CAGR of 6.80% during the forecast period.
North America Memory Automated Test Equipment (ATE) market size was estimated at USD 313.34 million in 2023, at a CAGR of 5.83% during the forecast period of 2025 through 2032.
Memory Automated Test Equipment (ATE) Key Market Trends :
- Growing Demand for High-Performance Memory Testing
With the rise in AI, IoT, and cloud computing, the demand for high-speed and efficient memory testing is increasing, driving advancements in Memory ATE. - Expansion of Semiconductor Manufacturing
The rapid growth of semiconductor fabrication, especially in Asia-Pacific, is fueling the need for advanced testing equipment to ensure quality and efficiency. - Shift Toward Automation and AI Integration
Automated and AI-driven Memory ATE systems are gaining popularity as they enhance accuracy, reduce human intervention, and improve overall efficiency. - Increasing Investments in 5G and Edge Computing
The deployment of 5G networks and edge computing applications is creating a surge in demand for high-performance memory devices, boosting the Memory ATE market. - Rising Focus on Cost Reduction and Efficiency
Companies are investing in cost-effective and high-throughput Memory ATE solutions to improve testing efficiency while reducing operational costs.
Memory Automated Test Equipment (ATE) Market Regional Analysis :

North America:
Strong demand driven by EVs, 5G infrastructure, and renewable energy, with the U.S. leading the market.
Europe:
Growth fueled by automotive electrification, renewable energy, and strong regulatory support, with Germany as a key player.
Asia-Pacific:
Dominates the market due to large-scale manufacturing in China and Japan, with growing demand from EVs, 5G, and semiconductors.
South America:
Emerging market, driven by renewable energy and EV adoption, with Brazil leading growth.
Middle East & Africa:
Gradual growth, mainly due to investments in renewable energy and EV infrastructure, with Saudi Arabia and UAE as key contributors.
Memory Automated Test Equipment (ATE) Market Segmentation :
The research report includes specific segments by region (country), manufacturers, Type, and Application. Market segmentation creates subsets of a market based on product type, end-user or application, Geographic, and other factors. By understanding the market segments, the decision-maker can leverage this targeting in the product, sales, and marketing strategies. Market segments can power your product development cycles by informing how you create product offerings for different segments.
Key Company
- Advantest
- Teradyne
- Tokyo Seimitsu
- Hangzhou Changchuan Technology
- TEL
- Beijing Huafeng Test & Control Technology
- Hon Precision
- Chroma
Market Segmentation (by Type)
- Testing Machines
- Chip Handlers
- Probe Stations
- Others
Market Segmentation (by Application)
- Automotive
- Consumer
- Defense
- IT& Telecommunications
- Others
Market Drivers
- Surging Demand for Consumer Electronics
The increasing adoption of smartphones, laptops, and other electronic devices is propelling the need for efficient memory testing solutions. - Advancements in Semiconductor Technology
The continuous evolution of semiconductor memory, including DDR5 and NAND flash technologies, is driving demand for cutting-edge Memory ATE systems. - Growing Automotive Semiconductor Applications
The rise in autonomous vehicles and electric vehicles (EVs) is fueling the demand for reliable and high-quality memory testing solutions.
Market Restraints
- High Initial Investment Costs
Memory ATE equipment requires significant capital investment, which can be a barrier for small and medium-sized enterprises. - Complexity in Testing Advanced Memory Devices
As memory technology becomes more sophisticated, testing methodologies must evolve, increasing the complexity and cost of testing. - Supply Chain Disruptions
Geopolitical tensions and semiconductor shortages may impact the availability and pricing of Memory ATE systems.
Opportunities
- Expanding Semiconductor Industry in Emerging Markets
Rapid industrialization in regions like Asia-Pacific and the Middle East is creating significant growth opportunities for the Memory ATE market. - Integration of AI and Machine Learning in Testing
AI-powered analytics and machine learning algorithms can optimize memory testing, reducing failure rates and improving efficiency. - Rising Demand for High-Density Memory Chips
The need for high-performance computing and data centers is driving the demand for advanced memory testing solutions.
Challenges
- Regulatory and Compliance Issues
Stringent regulatory requirements for semiconductor testing may pose challenges for market players. - Technical Limitations in Testing Next-Gen Memory
As memory technologies advance, Memory ATE providers must constantly innovate to keep up with new testing requirements. - Intense Competition Among Key Players
The market is highly competitive, with major players investing heavily in R&D to gain a technological edge.
Key Benefits of This Market Research:
- Industry drivers, restraints, and opportunities covered in the study
- Neutral perspective on the market performance
- Recent industry trends and developments
- Competitive landscape & strategies of key players
- Potential & niche segments and regions exhibiting promising growth covered
- Historical, current, and projected market size, in terms of value
- In-depth analysis of the Memory Automated Test Equipment (ATE) Market
- Overview of the regional outlook of the Memory Automated Test Equipment (ATE) Market:
Key Reasons to Buy this Report:
- Access to date statistics compiled by our researchers. These provide you with historical and forecast data, which is analyzed to tell you why your market is set to change
- This enables you to anticipate market changes to remain ahead of your competitors
- You will be able to copy data from the Excel spreadsheet straight into your marketing plans, business presentations, or other strategic documents
- The concise analysis, clear graph, and table format will enable you to pinpoint the information you require quickly
- Provision of market value data for each segment and sub-segment
- Indicates the region and segment that is expected to witness the fastest growth as well as to dominate the market
- Provides insight into the market through Value Chain
- Market dynamics scenario, along with growth opportunities of the market in the years to come
- 6-month post-sales analyst support
Customization of the Report
In case of any queries or customization requirements, please connect with our sales team, who will ensure that your requirements are met.
FAQs
Q: What are the key driving factors and opportunities in the Memory ATE market?
A: The key drivers include increasing demand for consumer electronics, advancements in semiconductor technology, and the rise of automotive semiconductors. Opportunities lie in AI-driven testing solutions and the expansion of semiconductor industries in emerging markets.
Q: Which region is projected to have the largest market share?
A: Asia-Pacific is expected to dominate the Memory ATE market due to its growing semiconductor manufacturing sector and increasing investments in AI and 5G technology.
Q: Who are the top players in the global Memory ATE market?
A: Leading companies include Advantest, Teradyne, Tokyo Seimitsu, Hangzhou Changchuan Technology, TEL, Beijing Huafeng Test & Control Technology, Hon Precision, and Chroma.
Q: What are the latest technological advancements in the industry?
A: AI-powered testing, automation in chip handling, machine learning-driven fault detection, and high-speed testing solutions for next-gen memory devices are some of the latest innovations in the Memory ATE industry.
Q: What is the current size of the global Memory ATE market?
A: The global Memory ATE market was valued at USD 1073.70 million in 2023 and is projected to reach USD 1940.99 million by 2032, growing at a CAGR of 6.80% during the forecast period.

Get Sample Report PDF for Exclusive Insights
Report Sample Includes
- Table of Contents
- List of Tables & Figures
- Charts, Research Methodology, and more...


