Table of Contents
1 Research Methodology and Statistical Scope
1.1 Market Definition and Statistical Scope of Lever Actuator
1.2 Key Market Segments
1.2.1 Lever Actuator Segment by Type
1.2.2 Lever Actuator Segment by Application
1.3 Methodology & Sources of Information
1.3.1 Research Methodology
1.3.2 Research Process
1.3.3 Market Breakdown and Data Triangulation
1.3.4 Base Year
1.3.5 Report Assumptions & Caveats
2 Lever Actuator Market Overview
2.1 Global Market Overview
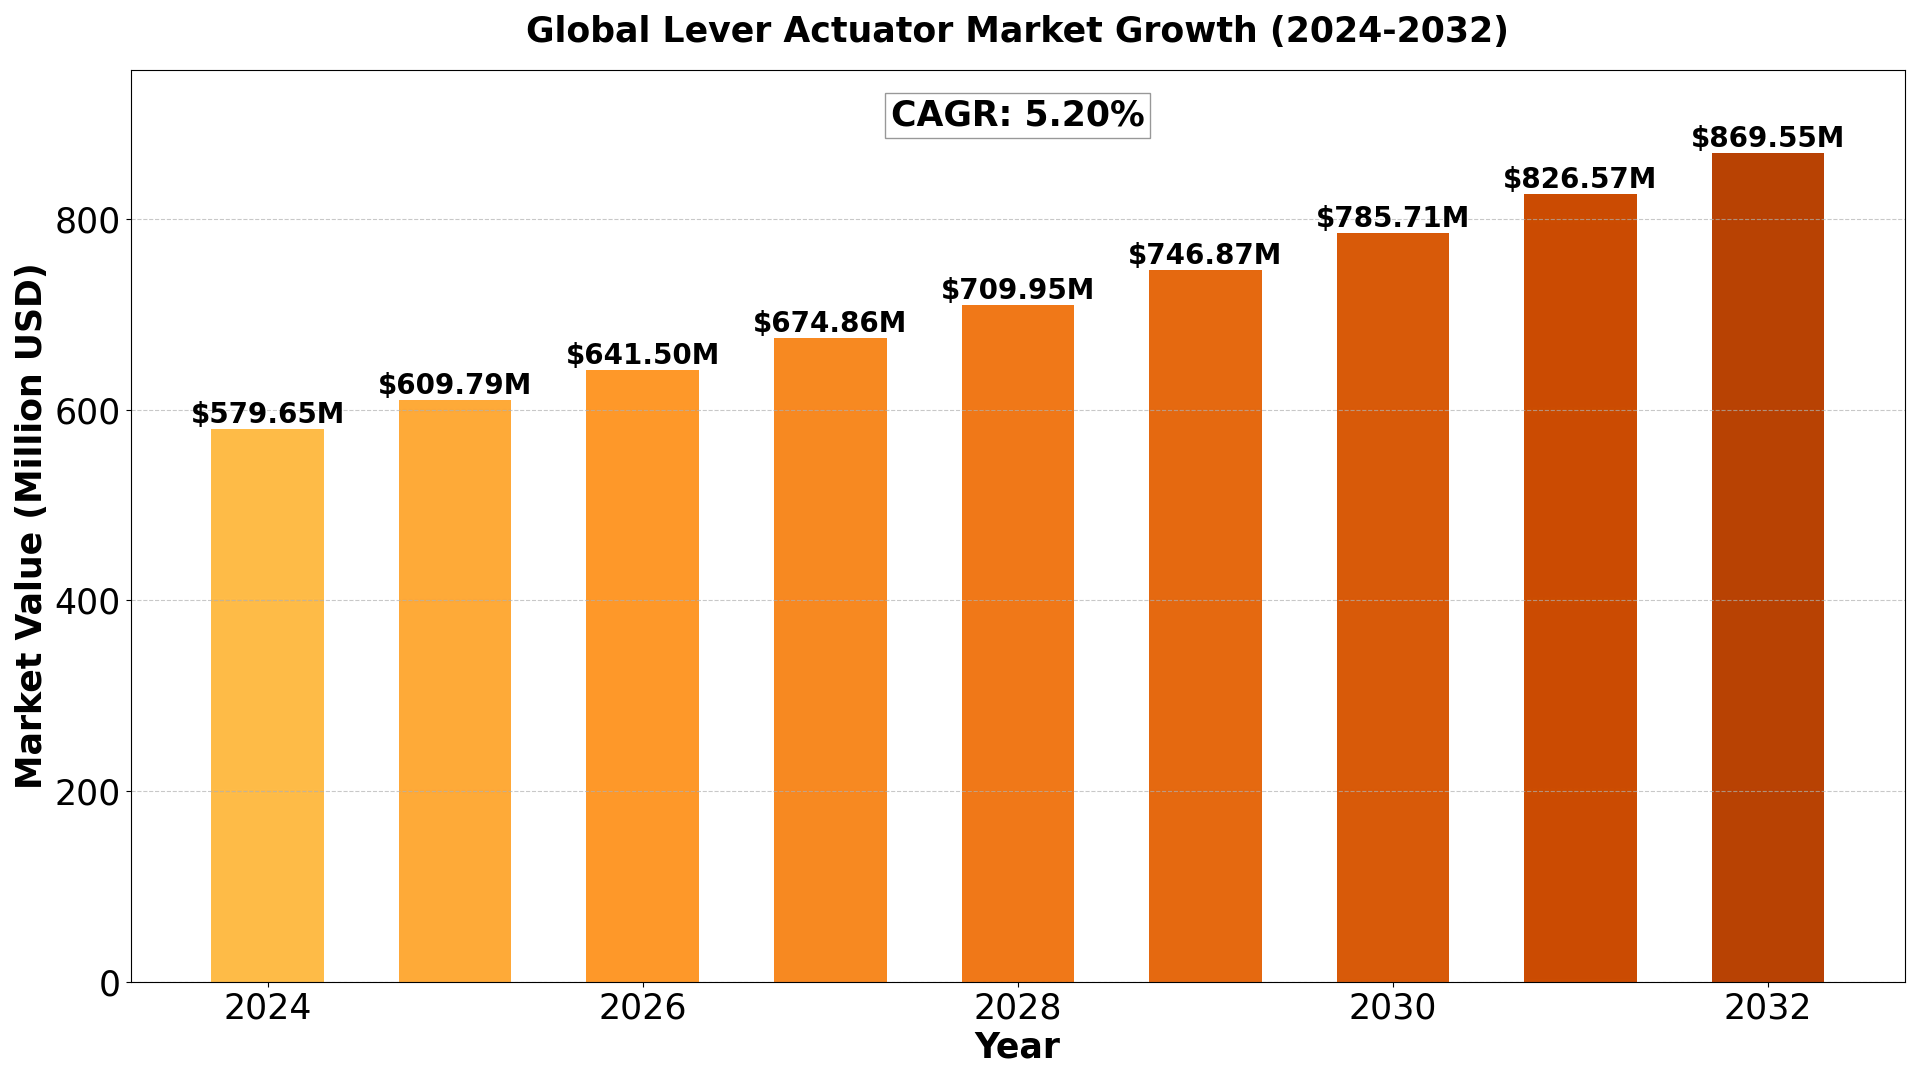
2.1.1 Global Lever Actuator Market Size (M USD) Estimates and Forecasts (2019-2032)
2.1.2 Global Lever Actuator Sales Estimates and Forecasts (2019-2032)
2.2 Market Segment Executive Summary
2.3 Global Market Size by Region
3 Lever Actuator Market Competitive Landscape
3.1 Global Lever Actuator Sales by Manufacturers (2019-2025)
3.2 Global Lever Actuator Revenue Market Share by Manufacturers (2019-2025)
3.3 Lever Actuator Market Share by Company Type (Tier 1, Tier 2, and Tier 3)
3.4 Global Lever Actuator Average Price by Manufacturers (2019-2025)
3.5 Manufacturers Lever Actuator Sales Sites, Area Served, Product Type
3.6 Lever Actuator Market Competitive Situation and Trends
3.6.1 Lever Actuator Market Concentration Rate
3.6.2 Global 5 and 10 Largest Lever Actuator Players Market Share by Revenue
3.6.3 Mergers & Acquisitions, Expansion
4 Lever Actuator Industry Chain Analysis
4.1 Lever Actuator Industry Chain Analysis
4.2 Market Overview of Key Raw Materials
4.3 Midstream Market Analysis
4.4 Downstream Customer Analysis
5 The Development and Dynamics of Lever Actuator Market
5.1 Key Development Trends
5.2 Driving Factors
5.3 Market Challenges
5.4 Market Restraints
5.5 Industry News
5.5.1 New Product Developments
5.5.2 Mergers & Acquisitions
5.5.3 Expansions
5.5.4 Collaboration/Supply Contracts
5.6 Industry Policies
6 Lever Actuator Market Segmentation by Type
6.1 Evaluation Matrix of Segment Market Development Potential (Type)
6.2 Global Lever Actuator Sales Market Share by Type (2019-2025)
6.3 Global Lever Actuator Market Size Market Share by Type (2019-2025)
6.4 Global Lever Actuator Price by Type (2019-2025)
7 Lever Actuator Market Segmentation by Application
7.1 Evaluation Matrix of Segment Market Development Potential (Application)
7.2 Global Lever Actuator Market Sales by Application (2019-2025)
7.3 Global Lever Actuator Market Size (M USD) by Application (2019-2025)
7.4 Global Lever Actuator Sales Growth Rate by Application (2019-2025)
8 Lever Actuator Market Consumption by Region
8.1 Global Lever Actuator Sales by Region
8.1.1 Global Lever Actuator Sales by Region
8.1.2 Global Lever Actuator Sales Market Share by Region
8.2 North America
8.2.1 North America Lever Actuator Sales by Country
8.2.2 U.S.
8.2.3 Canada
8.2.4 Mexico
8.3 Europe
8.3.1 Europe Lever Actuator Sales by Country
8.3.2 Germany
8.3.3 France
8.3.4 U.K.
8.3.5 Italy
8.3.6 Russia
8.4 Asia Pacific
8.4.1 Asia Pacific Lever Actuator Sales by Region
8.4.2 China
8.4.3 Japan
8.4.4 South Korea
8.4.5 India
8.4.6 Southeast Asia
8.5 South America
8.5.1 South America Lever Actuator Sales by Country
8.5.2 Brazil
8.5.3 Argentina
8.5.4 Columbia
8.6 Middle East and Africa
8.6.1 Middle East and Africa Lever Actuator Sales by Region
8.6.2 Saudi Arabia
8.6.3 UAE
8.6.4 Egypt
8.6.5 Nigeria
8.6.6 South Africa
9 Lever Actuator Market Production by Region
9.1 Global Production of Lever Actuator by Region (2019-2025)
9.2 Global Lever Actuator Revenue Market Share by Region (2019-2025)
9.3 Global Lever Actuator Production, Revenue, Price and Gross Margin (2019-2025)
9.4 North America Lever Actuator Production
9.4.1 North America Lever Actuator Production Growth Rate (2019-2025)
9.4.2 North America Lever Actuator Production, Revenue, Price and Gross Margin (2019-2025)
9.5 Europe Lever Actuator Production
9.5.1 Europe Lever Actuator Production Growth Rate (2019-2025)
9.5.2 Europe Lever Actuator Production, Revenue, Price and Gross Margin (2019-2025)
9.6 Japan Lever Actuator Production (2019-2025)
9.6.1 Japan Lever Actuator Production Growth Rate (2019-2025)
9.6.2 Japan Lever Actuator Production, Revenue, Price and Gross Margin (2019-2025)
9.7 China Lever Actuator Production (2019-2025)
9.7.1 China Lever Actuator Production Growth Rate (2019-2025)
9.7.2 China Lever Actuator Production, Revenue, Price and Gross Margin (2019-2025)
10 Key Companies Profile
10.1 Assured Automation
10.1.1 Assured Automation Lever Actuator Basic Information
10.1.2 Assured Automation Lever Actuator Product Overview
10.1.3 Assured Automation Lever Actuator Product Market Performance
10.1.4 Assured Automation Business Overview
10.1.5 Assured Automation Lever Actuator SWOT Analysis
10.1.6 Assured Automation Recent Developments
10.2 AUMA
10.2.1 AUMA Lever Actuator Basic Information
10.2.2 AUMA Lever Actuator Product Overview
10.2.3 AUMA Lever Actuator Product Market Performance
10.2.4 AUMA Business Overview
10.2.5 AUMA Lever Actuator SWOT Analysis
10.2.6 AUMA Recent Developments
10.3 AZ Pheumatica
10.3.1 AZ Pheumatica Lever Actuator Basic Information
10.3.2 AZ Pheumatica Lever Actuator Product Overview
10.3.3 AZ Pheumatica Lever Actuator Product Market Performance
10.3.4 AZ Pheumatica Lever Actuator SWOT Analysis
10.3.5 AZ Pheumatica Business Overview
10.3.6 AZ Pheumatica Recent Developments
10.4 BiS Valves
10.4.1 BiS Valves Lever Actuator Basic Information
10.4.2 BiS Valves Lever Actuator Product Overview
10.4.3 BiS Valves Lever Actuator Product Market Performance
10.4.4 BiS Valves Business Overview
10.4.5 BiS Valves Recent Developments
10.5 Crafco
10.5.1 Crafco Lever Actuator Basic Information
10.5.2 Crafco Lever Actuator Product Overview
10.5.3 Crafco Lever Actuator Product Market Performance
10.5.4 Crafco Business Overview
10.5.5 Crafco Recent Developments
10.6 Inc.
10.6.1 Inc. Lever Actuator Basic Information
10.6.2 Inc. Lever Actuator Product Overview
10.6.3 Inc. Lever Actuator Product Market Performance
10.6.4 Inc. Business Overview
10.6.5 Inc. Recent Developments
10.7 DEZURIK
10.7.1 DEZURIK Lever Actuator Basic Information
10.7.2 DEZURIK Lever Actuator Product Overview
10.7.3 DEZURIK Lever Actuator Product Market Performance
10.7.4 DEZURIK Business Overview
10.7.5 DEZURIK Recent Developments
10.8 Flameskill
10.8.1 Flameskill Lever Actuator Basic Information
10.8.2 Flameskill Lever Actuator Product Overview
10.8.3 Flameskill Lever Actuator Product Market Performance
10.8.4 Flameskill Business Overview
10.8.5 Flameskill Recent Developments
10.9 General Electric Company
10.9.1 General Electric Company Lever Actuator Basic Information
10.9.2 General Electric Company Lever Actuator Product Overview
10.9.3 General Electric Company Lever Actuator Product Market Performance
10.9.4 General Electric Company Business Overview
10.9.5 General Electric Company Recent Developments
10.10 Keraflo
10.10.1 Keraflo Lever Actuator Basic Information
10.10.2 Keraflo Lever Actuator Product Overview
10.10.3 Keraflo Lever Actuator Product Market Performance
10.10.4 Keraflo Business Overview
10.10.5 Keraflo Recent Developments
10.11 Kind shock
10.11.1 Kind shock Lever Actuator Basic Information
10.11.2 Kind shock Lever Actuator Product Overview
10.11.3 Kind shock Lever Actuator Product Market Performance
10.11.4 Kind shock Business Overview
10.11.5 Kind shock Recent Developments
10.12 Lovato Electric
10.12.1 Lovato Electric Lever Actuator Basic Information
10.12.2 Lovato Electric Lever Actuator Product Overview
10.12.3 Lovato Electric Lever Actuator Product Market Performance
10.12.4 Lovato Electric Business Overview
10.12.5 Lovato Electric Recent Developments
10.13 Lumen
10.13.1 Lumen Lever Actuator Basic Information
10.13.2 Lumen Lever Actuator Product Overview
10.13.3 Lumen Lever Actuator Product Market Performance
10.13.4 Lumen Business Overview
10.13.5 Lumen Recent Developments
10.14 Osmanl? Otomotiv
10.14.1 Osmanl? Otomotiv Lever Actuator Basic Information
10.14.2 Osmanl? Otomotiv Lever Actuator Product Overview
10.14.3 Osmanl? Otomotiv Lever Actuator Product Market Performance
10.14.4 Osmanl? Otomotiv Business Overview
10.14.5 Osmanl? Otomotiv Recent Developments
10.15 Physik Instrumente GmbH
10.15.1 Physik Instrumente GmbH Lever Actuator Basic Information
10.15.2 Physik Instrumente GmbH Lever Actuator Product Overview
10.15.3 Physik Instrumente GmbH Lever Actuator Product Market Performance
10.15.4 Physik Instrumente GmbH Business Overview
10.15.5 Physik Instrumente GmbH Recent Developments
10.16 saVRee
10.16.1 saVRee Lever Actuator Basic Information
10.16.2 saVRee Lever Actuator Product Overview
10.16.3 saVRee Lever Actuator Product Market Performance
10.16.4 saVRee Business Overview
10.16.5 saVRee Recent Developments
10.17 Spac
10.17.1 Spac Lever Actuator Basic Information
10.17.2 Spac Lever Actuator Product Overview
10.17.3 Spac Lever Actuator Product Market Performance
10.17.4 Spac Business Overview
10.17.5 Spac Recent Developments
10.18 WAMGroup
10.18.1 WAMGroup Lever Actuator Basic Information
10.18.2 WAMGroup Lever Actuator Product Overview
10.18.3 WAMGroup Lever Actuator Product Market Performance
10.18.4 WAMGroup Business Overview
10.18.5 WAMGroup Recent Developments
10.19 SMC Corporation
10.19.1 SMC Corporation Lever Actuator Basic Information
10.19.2 SMC Corporation Lever Actuator Product Overview
10.19.3 SMC Corporation Lever Actuator Product Market Performance
10.19.4 SMC Corporation Business Overview
10.19.5 SMC Corporation Recent Developments
10.20 Parker Hannifin
10.20.1 Parker Hannifin Lever Actuator Basic Information
10.20.2 Parker Hannifin Lever Actuator Product Overview
10.20.3 Parker Hannifin Lever Actuator Product Market Performance
10.20.4 Parker Hannifin Business Overview
10.20.5 Parker Hannifin Recent Developments
10.21 Johnson Electric
10.21.1 Johnson Electric Lever Actuator Basic Information
10.21.2 Johnson Electric Lever Actuator Product Overview
10.21.3 Johnson Electric Lever Actuator Product Market Performance
10.21.4 Johnson Electric Business Overview
10.21.5 Johnson Electric Recent Developments
10.22 SCHUNK
10.22.1 SCHUNK Lever Actuator Basic Information
10.22.2 SCHUNK Lever Actuator Product Overview
10.22.3 SCHUNK Lever Actuator Product Market Performance
10.22.4 SCHUNK Business Overview
10.22.5 SCHUNK Recent Developments
10.23 Festo
10.23.1 Festo Lever Actuator Basic Information
10.23.2 Festo Lever Actuator Product Overview
10.23.3 Festo Lever Actuator Product Market Performance
10.23.4 Festo Business Overview
10.23.5 Festo Recent Developments
10.24 Thomson Industries
10.24.1 Thomson Industries Lever Actuator Basic Information
10.24.2 Thomson Industries Lever Actuator Product Overview
10.24.3 Thomson Industries Lever Actuator Product Market Performance
10.24.4 Thomson Industries Business Overview
10.24.5 Thomson Industries Recent Developments
10.25 Rotork
10.25.1 Rotork Lever Actuator Basic Information
10.25.2 Rotork Lever Actuator Product Overview
10.25.3 Rotork Lever Actuator Product Market Performance
10.25.4 Rotork Business Overview
10.25.5 Rotork Recent Developments
10.26 Linak
10.26.1 Linak Lever Actuator Basic Information
10.26.2 Linak Lever Actuator Product Overview
10.26.3 Linak Lever Actuator Product Market Performance
10.26.4 Linak Business Overview
10.26.5 Linak Recent Developments
10.27 Tolomatic
10.27.1 Tolomatic Lever Actuator Basic Information
10.27.2 Tolomatic Lever Actuator Product Overview
10.27.3 Tolomatic Lever Actuator Product Market Performance
10.27.4 Tolomatic Business Overview
10.27.5 Tolomatic Recent Developments
11 Lever Actuator Market Forecast by Region
11.1 Global Lever Actuator Market Size Forecast
11.2 Global Lever Actuator Market Forecast by Region
11.2.1 North America Market Size Forecast by Country
11.2.2 Europe Lever Actuator Market Size Forecast by Country
11.2.3 Asia Pacific Lever Actuator Market Size Forecast by Region
11.2.4 South America Lever Actuator Market Size Forecast by Country
11.2.5 Middle East and Africa Forecasted Consumption of Lever Actuator by Country
12 Forecast Market by Type and by Application (2025-2032)
12.1 Global Lever Actuator Market Forecast by Type (2025-2032)
12.1.1 Global Forecasted Sales of Lever Actuator by Type (2025-2032)
12.1.2 Global Lever Actuator Market Size Forecast by Type (2025-2032)
12.1.3 Global Forecasted Price of Lever Actuator by Type (2025-2032)
12.2 Global Lever Actuator Market Forecast by Application (2025-2032)
12.2.1 Global Lever Actuator Sales (K Units) Forecast by Application
12.2.2 Global Lever Actuator Market Size (M USD) Forecast by Application (2025-2032)
13 Conclusion and Key FindingsList of Tables
Table 1. Introduction of the Type
Table 2. Introduction of the Application
Table 3. Market Size (M USD) Segment Executive Summary
Table 4. Lever Actuator Market Size Comparison by Region (M USD)
Table 5. Global Lever Actuator Sales (K Units) by Manufacturers (2019-2025)
Table 6. Global Lever Actuator Sales Market Share by Manufacturers (2019-2025)
Table 7. Global Lever Actuator Revenue (M USD) by Manufacturers (2019-2025)
Table 8. Global Lever Actuator Revenue Share by Manufacturers (2019-2025)
Table 9. Company Type (Tier 1, Tier 2, and Tier 3) & (based on the Revenue in Lever Actuator as of 2022)
Table 10. Global Market Lever Actuator Average Price (USD/Unit) of Key Manufacturers (2019-2025)
Table 11. Manufacturers Lever Actuator Sales Sites and Area Served
Table 12. Manufacturers Lever Actuator Product Type
Table 13. Global Lever Actuator Manufacturers Market Concentration Ratio (CR5 and HHI)
Table 14. Mergers & Acquisitions, Expansion Plans
Table 15. Industry Chain Map of Lever Actuator
Table 16. Market Overview of Key Raw Materials
Table 17. Midstream Market Analysis
Table 18. Downstream Customer Analysis
Table 19. Key Development Trends
Table 20. Driving Factors
Table 21. Lever Actuator Market Challenges
Table 22. Global Lever Actuator Sales by Type (K Units)
Table 23. Global Lever Actuator Market Size by Type (M USD)
Table 24. Global Lever Actuator Sales (K Units) by Type (2019-2025)
Table 25. Global Lever Actuator Sales Market Share by Type (2019-2025)
Table 26. Global Lever Actuator Market Size (M USD) by Type (2019-2025)
Table 27. Global Lever Actuator Market Size Share by Type (2019-2025)
Table 28. Global Lever Actuator Price (USD/Unit) by Type (2019-2025)
Table 29. Global Lever Actuator Sales (K Units) by Application
Table 30. Global Lever Actuator Market Size by Application
Table 31. Global Lever Actuator Sales by Application (2019-2025) & (K Units)
Table 32. Global Lever Actuator Sales Market Share by Application (2019-2025)
Table 33. Global Lever Actuator Sales by Application (2019-2025) & (M USD)
Table 34. Global Lever Actuator Market Share by Application (2019-2025)
Table 35. Global Lever Actuator Sales Growth Rate by Application (2019-2025)
Table 36. Global Lever Actuator Sales by Region (2019-2025) & (K Units)
Table 37. Global Lever Actuator Sales Market Share by Region (2019-2025)
Table 38. North America Lever Actuator Sales by Country (2019-2025) & (K Units)
Table 39. Europe Lever Actuator Sales by Country (2019-2025) & (K Units)
Table 40. Asia Pacific Lever Actuator Sales by Region (2019-2025) & (K Units)
Table 41. South America Lever Actuator Sales by Country (2019-2025) & (K Units)
Table 42. Middle East and Africa Lever Actuator Sales by Region (2019-2025) & (K Units)
Table 43. Global Lever Actuator Production (K Units) by Region (2019-2025)
Table 44. Global Lever Actuator Revenue (US$ Million) by Region (2019-2025)
Table 45. Global Lever Actuator Revenue Market Share by Region (2019-2025)
Table 46. Global Lever Actuator Production (K Units), Revenue (US$ Million), Price (USD/Unit) and Gross Margin (2019-2025)
Table 47. North America Lever Actuator Production (K Units), Revenue (US$ Million), Price (USD/Unit) and Gross Margin (2019-2025)
Table 48. Europe Lever Actuator Production (K Units), Revenue (US$ Million), Price (USD/Unit) and Gross Margin (2019-2025)
Table 49. Japan Lever Actuator Production (K Units), Revenue (US$ Million), Price (USD/Unit) and Gross Margin (2019-2025)
Table 50. China Lever Actuator Production (K Units), Revenue (US$ Million), Price (USD/Unit) and Gross Margin (2019-2025)
Table 51. Assured Automation Lever Actuator Basic Information
Table 52. Assured Automation Lever Actuator Product Overview
Table 53. Assured Automation Lever Actuator Sales (K Units), Revenue (M USD), Price (USD/Unit) and Gross Margin (2019-2025)
Table 54. Assured Automation Business Overview
Table 55. Assured Automation Lever Actuator SWOT Analysis
Table 56. Assured Automation Recent Developments
Table 57. AUMA Lever Actuator Basic Information
Table 58. AUMA Lever Actuator Product Overview
Table 59. AUMA Lever Actuator Sales (K Units), Revenue (M USD), Price (USD/Unit) and Gross Margin (2019-2025)
Table 60. AUMA Business Overview
Table 61. AUMA Lever Actuator SWOT Analysis
Table 62. AUMA Recent Developments
Table 63. AZ Pheumatica Lever Actuator Basic Information
Table 64. AZ Pheumatica Lever Actuator Product Overview
Table 65. AZ Pheumatica Lever Actuator Sales (K Units), Revenue (M USD), Price (USD/Unit) and Gross Margin (2019-2025)
Table 66. AZ Pheumatica Lever Actuator SWOT Analysis
Table 67. AZ Pheumatica Business Overview
Table 68. AZ Pheumatica Recent Developments
Table 69. BiS Valves Lever Actuator Basic Information
Table 70. BiS Valves Lever Actuator Product Overview
Table 71. BiS Valves Lever Actuator Sales (K Units), Revenue (M USD), Price (USD/Unit) and Gross Margin (2019-2025)
Table 72. BiS Valves Business Overview
Table 73. BiS Valves Recent Developments
Table 74. Crafco Lever Actuator Basic Information
Table 75. Crafco Lever Actuator Product Overview
Table 76. Crafco Lever Actuator Sales (K Units), Revenue (M USD), Price (USD/Unit) and Gross Margin (2019-2025)
Table 77. Crafco Business Overview
Table 78. Crafco Recent Developments
Table 79. Inc. Lever Actuator Basic Information
Table 80. Inc. Lever Actuator Product Overview
Table 81. Inc. Lever Actuator Sales (K Units), Revenue (M USD), Price (USD/Unit) and Gross Margin (2019-2025)
Table 82. Inc. Business Overview
Table 83. Inc. Recent Developments
Table 84. DEZURIK Lever Actuator Basic Information
Table 85. DEZURIK Lever Actuator Product Overview
Table 86. DEZURIK Lever Actuator Sales (K Units), Revenue (M USD), Price (USD/Unit) and Gross Margin (2019-2025)
Table 87. DEZURIK Business Overview
Table 88. DEZURIK Recent Developments
Table 89. Flameskill Lever Actuator Basic Information
Table 90. Flameskill Lever Actuator Product Overview
Table 91. Flameskill Lever Actuator Sales (K Units), Revenue (M USD), Price (USD/Unit) and Gross Margin (2019-2025)
Table 92. Flameskill Business Overview
Table 93. Flameskill Recent Developments
Table 94. General Electric Company Lever Actuator Basic Information
Table 95. General Electric Company Lever Actuator Product Overview
Table 96. General Electric Company Lever Actuator Sales (K Units), Revenue (M USD), Price (USD/Unit) and Gross Margin (2019-2025)
Table 97. General Electric Company Business Overview
Table 98. General Electric Company Recent Developments
Table 99. Keraflo Lever Actuator Basic Information
Table 100. Keraflo Lever Actuator Product Overview
Table 101. Keraflo Lever Actuator Sales (K Units), Revenue (M USD), Price (USD/Unit) and Gross Margin (2019-2025)
Table 102. Keraflo Business Overview
Table 103. Keraflo Recent Developments
Table 104. Kind shock Lever Actuator Basic Information
Table 105. Kind shock Lever Actuator Product Overview
Table 106. Kind shock Lever Actuator Sales (K Units), Revenue (M USD), Price (USD/Unit) and Gross Margin (2019-2025)
Table 107. Kind shock Business Overview
Table 108. Kind shock Recent Developments
Table 109. Lovato Electric Lever Actuator Basic Information
Table 110. Lovato Electric Lever Actuator Product Overview
Table 111. Lovato Electric Lever Actuator Sales (K Units), Revenue (M USD), Price (USD/Unit) and Gross Margin (2019-2025)
Table 112. Lovato Electric Business Overview
Table 113. Lovato Electric Recent Developments
Table 114. Lumen Lever Actuator Basic Information
Table 115. Lumen Lever Actuator Product Overview
Table 116. Lumen Lever Actuator Sales (K Units), Revenue (M USD), Price (USD/Unit) and Gross Margin (2019-2025)
Table 117. Lumen Business Overview
Table 118. Lumen Recent Developments
Table 119. Osmanl? Otomotiv Lever Actuator Basic Information
Table 120. Osmanl? Otomotiv Lever Actuator Product Overview
Table 121. Osmanl? Otomotiv Lever Actuator Sales (K Units), Revenue (M USD), Price (USD/Unit) and Gross Margin (2019-2025)
Table 122. Osmanl? Otomotiv Business Overview
Table 123. Osmanl? Otomotiv Recent Developments
Table 124. Physik Instrumente GmbH Lever Actuator Basic Information
Table 125. Physik Instrumente GmbH Lever Actuator Product Overview
Table 126. Physik Instrumente GmbH Lever Actuator Sales (K Units), Revenue (M USD), Price (USD/Unit) and Gross Margin (2019-2025)
Table 127. Physik Instrumente GmbH Business Overview
Table 128. Physik Instrumente GmbH Recent Developments
Table 129. saVRee Lever Actuator Basic Information
Table 130. saVRee Lever Actuator Product Overview
Table 131. saVRee Lever Actuator Sales (K Units), Revenue (M USD), Price (USD/Unit) and Gross Margin (2019-2025)
Table 132. saVRee Business Overview
Table 133. saVRee Recent Developments
Table 134. Spac Lever Actuator Basic Information
Table 135. Spac Lever Actuator Product Overview
Table 136. Spac Lever Actuator Sales (K Units), Revenue (M USD), Price (USD/Unit) and Gross Margin (2019-2025)
Table 137. Spac Business Overview
Table 138. Spac Recent Developments
Table 139. WAMGroup Lever Actuator Basic Information
Table 140. WAMGroup Lever Actuator Product Overview
Table 141. WAMGroup Lever Actuator Sales (K Units), Revenue (M USD), Price (USD/Unit) and Gross Margin (2019-2025)
Table 142. WAMGroup Business Overview
Table 143. WAMGroup Recent Developments
Table 144. SMC Corporation Lever Actuator Basic Information
Table 145. SMC Corporation Lever Actuator Product Overview
Table 146. SMC Corporation Lever Actuator Sales (K Units), Revenue (M USD), Price (USD/Unit) and Gross Margin (2019-2025)
Table 147. SMC Corporation Business Overview
Table 148. SMC Corporation Recent Developments
Table 149. Parker Hannifin Lever Actuator Basic Information
Table 150. Parker Hannifin Lever Actuator Product Overview
Table 151. Parker Hannifin Lever Actuator Sales (K Units), Revenue (M USD), Price (USD/Unit) and Gross Margin (2019-2025)
Table 152. Parker Hannifin Business Overview
Table 153. Parker Hannifin Recent Developments
Table 154. Johnson Electric Lever Actuator Basic Information
Table 155. Johnson Electric Lever Actuator Product Overview
Table 156. Johnson Electric Lever Actuator Sales (K Units), Revenue (M USD), Price (USD/Unit) and Gross Margin (2019-2025)
Table 157. Johnson Electric Business Overview
Table 158. Johnson Electric Recent Developments
Table 159. SCHUNK Lever Actuator Basic Information
Table 160. SCHUNK Lever Actuator Product Overview
Table 161. SCHUNK Lever Actuator Sales (K Units), Revenue (M USD), Price (USD/Unit) and Gross Margin (2019-2025)
Table 162. SCHUNK Business Overview
Table 163. SCHUNK Recent Developments
Table 164. Festo Lever Actuator Basic Information
Table 165. Festo Lever Actuator Product Overview
Table 166. Festo Lever Actuator Sales (K Units), Revenue (M USD), Price (USD/Unit) and Gross Margin (2019-2025)
Table 167. Festo Business Overview
Table 168. Festo Recent Developments
Table 169. Thomson Industries Lever Actuator Basic Information
Table 170. Thomson Industries Lever Actuator Product Overview
Table 171. Thomson Industries Lever Actuator Sales (K Units), Revenue (M USD), Price (USD/Unit) and Gross Margin (2019-2025)
Table 172. Thomson Industries Business Overview
Table 173. Thomson Industries Recent Developments
Table 174. Rotork Lever Actuator Basic Information
Table 175. Rotork Lever Actuator Product Overview
Table 176. Rotork Lever Actuator Sales (K Units), Revenue (M USD), Price (USD/Unit) and Gross Margin (2019-2025)
Table 177. Rotork Business Overview
Table 178. Rotork Recent Developments
Table 179. Linak Lever Actuator Basic Information
Table 180. Linak Lever Actuator Product Overview
Table 181. Linak Lever Actuator Sales (K Units), Revenue (M USD), Price (USD/Unit) and Gross Margin (2019-2025)
Table 182. Linak Business Overview
Table 183. Linak Recent Developments
Table 184. Tolomatic Lever Actuator Basic Information
Table 185. Tolomatic Lever Actuator Product Overview
Table 186. Tolomatic Lever Actuator Sales (K Units), Revenue (M USD), Price (USD/Unit) and Gross Margin (2019-2025)
Table 187. Tolomatic Business Overview
Table 188. Tolomatic Recent Developments
Table 189. Global Lever Actuator Sales Forecast by Region (2025-2032) & (K Units)
Table 190. Global Lever Actuator Market Size Forecast by Region (2025-2032) & (M USD)
Table 191. North America Lever Actuator Sales Forecast by Country (2025-2032) & (K Units)
Table 192. North America Lever Actuator Market Size Forecast by Country (2025-2032) & (M USD)
Table 193. Europe Lever Actuator Sales Forecast by Country (2025-2032) & (K Units)
Table 194. Europe Lever Actuator Market Size Forecast by Country (2025-2032) & (M USD)
Table 195. Asia Pacific Lever Actuator Sales Forecast by Region (2025-2032) & (K Units)
Table 196. Asia Pacific Lever Actuator Market Size Forecast by Region (2025-2032) & (M USD)
Table 197. South America Lever Actuator Sales Forecast by Country (2025-2032) & (K Units)
Table 198. South America Lever Actuator Market Size Forecast by Country (2025-2032) & (M USD)
Table 199. Middle East and Africa Lever Actuator Consumption Forecast by Country (2025-2032) & (Units)
Table 200. Middle East and Africa Lever Actuator Market Size Forecast by Country (2025-2032) & (M USD)
Table 201. Global Lever Actuator Sales Forecast by Type (2025-2032) & (K Units)
Table 202. Global Lever Actuator Market Size Forecast by Type (2025-2032) & (M USD)
Table 203. Global Lever Actuator Price Forecast by Type (2025-2032) & (USD/Unit)
Table 204. Global Lever Actuator Sales (K Units) Forecast by Application (2025-2032)
Table 205. Global Lever Actuator Market Size Forecast by Application (2025-2032) & (M USD)
List of Figures
Figure 1. Product Picture of Lever Actuator
Figure 2. Data Triangulation
Figure 3. Key Caveats
Figure 4. Global Lever Actuator Market Size (M USD), 2019-2032
Figure 5. Global Lever Actuator Market Size (M USD) (2019-2032)
Figure 6. Global Lever Actuator Sales (K Units) & (2019-2032)
Figure 7. Evaluation Matrix of Segment Market Development Potential (Type)
Figure 8. Evaluation Matrix of Segment Market Development Potential (Application)
Figure 9. Evaluation Matrix of Regional Market Development Potential
Figure 10. Lever Actuator Market Size by Country (M USD)
Figure 11. Lever Actuator Sales Share by Manufacturers in 2023
Figure 12. Global Lever Actuator Revenue Share by Manufacturers in 2023
Figure 13. Lever Actuator Market Share by Company Type (Tier 1, Tier 2 and Tier 3): 2023
Figure 14. Global Market Lever Actuator Average Price (USD/Unit) of Key Manufacturers in 2023
Figure 15. The Global 5 and 10 Largest Players: Market Share by Lever Actuator Revenue in 2023
Figure 16. Evaluation Matrix of Segment Market Development Potential (Type)
Figure 17. Global Lever Actuator Market Share by Type
Figure 18. Sales Market Share of Lever Actuator by Type (2019-2025)
Figure 19. Sales Market Share of Lever Actuator by Type in 2023
Figure 20. Market Size Share of Lever Actuator by Type (2019-2025)
Figure 21. Market Size Market Share of Lever Actuator by Type in 2023
Figure 22. Evaluation Matrix of Segment Market Development Potential (Application)
Figure 23. Global Lever Actuator Market Share by Application
Figure 24. Global Lever Actuator Sales Market Share by Application (2019-2025)
Figure 25. Global Lever Actuator Sales Market Share by Application in 2023
Figure 26. Global Lever Actuator Market Share by Application (2019-2025)
Figure 27. Global Lever Actuator Market Share by Application in 2023
Figure 28. Global Lever Actuator Sales Growth Rate by Application (2019-2025)
Figure 29. Global Lever Actuator Sales Market Share by Region (2019-2025)
Figure 30. North America Lever Actuator Sales and Growth Rate (2019-2025) & (K Units)
Figure 31. North America Lever Actuator Sales Market Share by Country in 2023
Figure 32. U.S. Lever Actuator Sales and Growth Rate (2019-2025) & (K Units)
Figure 33. Canada Lever Actuator Sales (K Units) and Growth Rate (2019-2025)
Figure 34. Mexico Lever Actuator Sales (Units) and Growth Rate (2019-2025)
Figure 35. Europe Lever Actuator Sales and Growth Rate (2019-2025) & (K Units)
Figure 36. Europe Lever Actuator Sales Market Share by Country in 2023
Figure 37. Germany Lever Actuator Sales and Growth Rate (2019-2025) & (K Units)
Figure 38. France Lever Actuator Sales and Growth Rate (2019-2025) & (K Units)
Figure 39. U.K. Lever Actuator Sales and Growth Rate (2019-2025) & (K Units)
Figure 40. Italy Lever Actuator Sales and Growth Rate (2019-2025) & (K Units)
Figure 41. Russia Lever Actuator Sales and Growth Rate (2019-2025) & (K Units)
Figure 42. Asia Pacific Lever Actuator Sales and Growth Rate (K Units)
Figure 43. Asia Pacific Lever Actuator Sales Market Share by Region in 2023
Figure 44. China Lever Actuator Sales and Growth Rate (2019-2025) & (K Units)
Figure 45. Japan Lever Actuator Sales and Growth Rate (2019-2025) & (K Units)
Figure 46. South Korea Lever Actuator Sales and Growth Rate (2019-2025) & (K Units)
Figure 47. India Lever Actuator Sales and Growth Rate (2019-2025) & (K Units)
Figure 48. Southeast Asia Lever Actuator Sales and Growth Rate (2019-2025) & (K Units)
Figure 49. South America Lever Actuator Sales and Growth Rate (K Units)
Figure 50. South America Lever Actuator Sales Market Share by Country in 2023
Figure 51. Brazil Lever Actuator Sales and Growth Rate (2019-2025) & (K Units)
Figure 52. Argentina Lever Actuator Sales and Growth Rate (2019-2025) & (K Units)
Figure 53. Columbia Lever Actuator Sales and Growth Rate (2019-2025) & (K Units)
Figure 54. Middle East and Africa Lever Actuator Sales and Growth Rate (K Units)
Figure 55. Middle East and Africa Lever Actuator Sales Market Share by Region in 2023
Figure 56. Saudi Arabia Lever Actuator Sales and Growth Rate (2019-2025) & (K Units)
Figure 57. UAE Lever Actuator Sales and Growth Rate (2019-2025) & (K Units)
Figure 58. Egypt Lever Actuator Sales and Growth Rate (2019-2025) & (K Units)
Figure 59. Nigeria Lever Actuator Sales and Growth Rate (2019-2025) & (K Units)
Figure 60. South Africa Lever Actuator Sales and Growth Rate (2019-2025) & (K Units)
Figure 61. Global Lever Actuator Production Market Share by Region (2019-2025)
Figure 62. North America Lever Actuator Production (K Units) Growth Rate (2019-2025)
Figure 63. Europe Lever Actuator Production (K Units) Growth Rate (2019-2025)
Figure 64. Japan Lever Actuator Production (K Units) Growth Rate (2019-2025)
Figure 65. China Lever Actuator Production (K Units) Growth Rate (2019-2025)
Figure 66. Global Lever Actuator Sales Forecast by Volume (2019-2032) & (K Units)
Figure 67. Global Lever Actuator Market Size Forecast by Value (2019-2032) & (M USD)
Figure 68. Global Lever Actuator Sales Market Share Forecast by Type (2025-2032)
Figure 69. Global Lever Actuator Market Share Forecast by Type (2025-2032)
Figure 70. Global Lever Actuator Sales Forecast by Application (2025-2032)
Figure 71. Global Lever Actuator Market Share Forecast by Application (2025-2032)