MARKET INSIGHTS
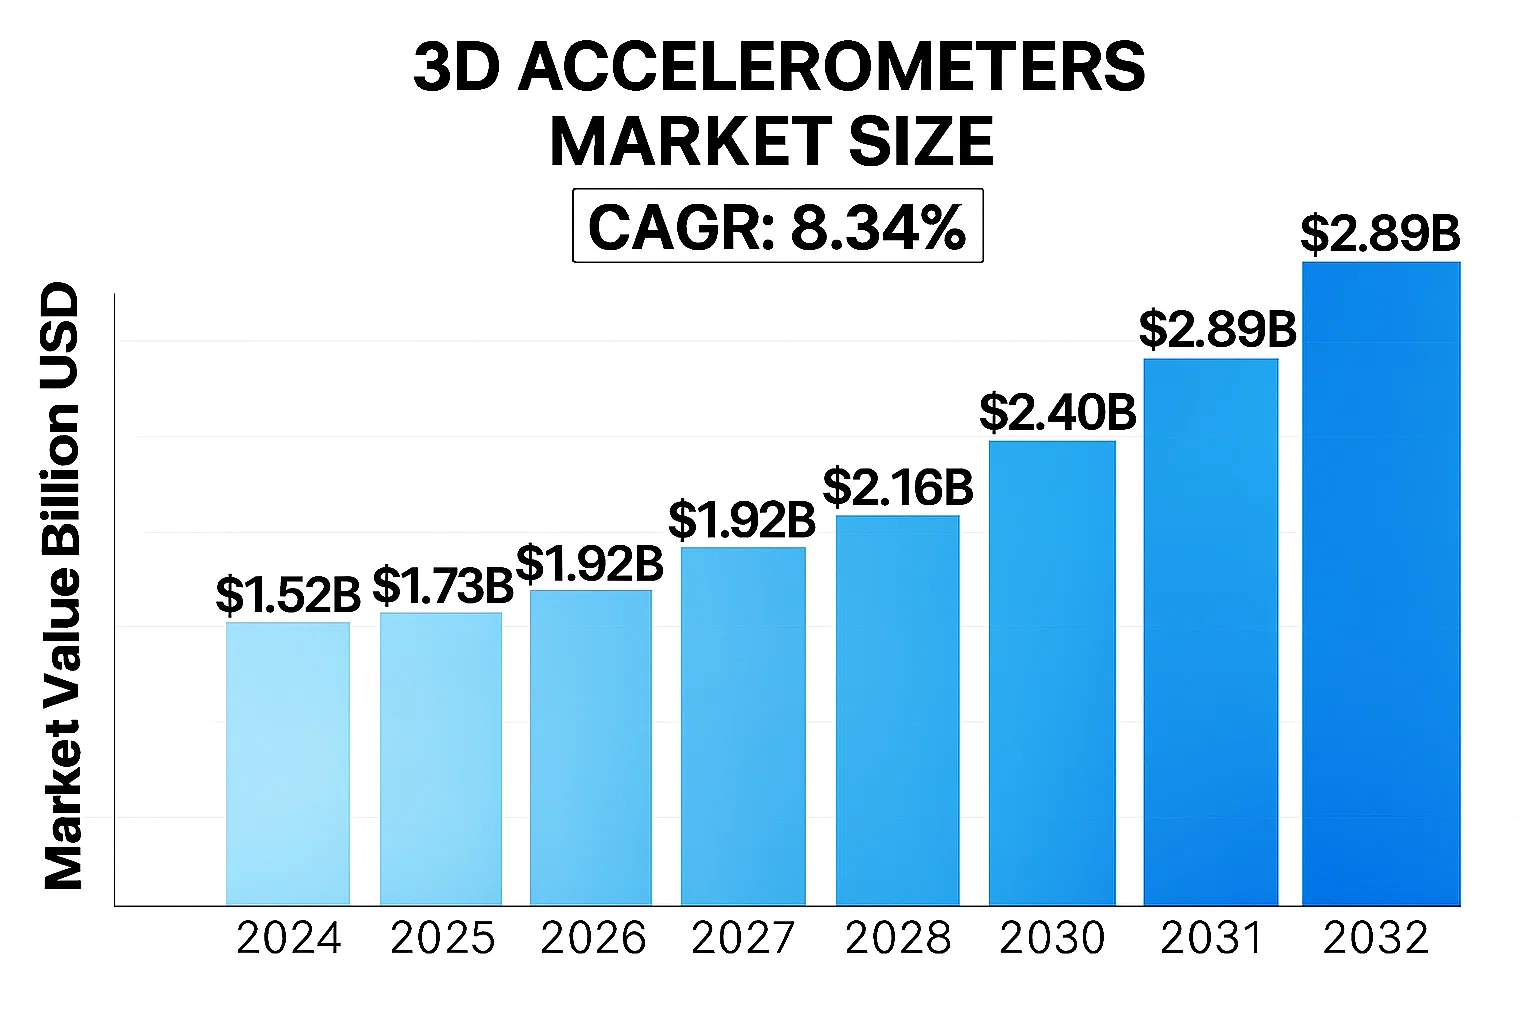
The global 3D Accelerometers Market was valued at US$ 1.52 billion in 2024 and is projected to reach US$ 2.89 billion by 2032, at a CAGR of 8.34% during the forecast period 2025-2032.
3D accelerometers are sensors that measure acceleration forces in three perpendicular axes (X, Y, and Z), enabling precise motion detection and orientation tracking. These compact devices combine micro-electromechanical systems (MEMS) technology with advanced signal processing to deliver high-precision measurements across various applications. The primary types include capacitive, piezoelectric, and piezoresistive accelerometers, each offering distinct advantages in sensitivity, power consumption, and frequency response.
The market growth is driven by expanding adoption in consumer electronics such as smartphones and wearables, where 3D accelerometers enable features like screen rotation and activity tracking. Industrial automation applications are also contributing significantly, particularly in predictive maintenance and robotics. However, challenges remain in achieving higher accuracy for specialized sectors like aerospace while maintaining cost-effectiveness for mass-market devices. Recent technological advancements include the development of ultra-low-power accelerometers for IoT devices and high-G sensors for automotive safety systems.
MARKET DYNAMICS
MARKET DRIVERS
Proliferation of IoT and Smart Devices Fuels 3D Accelerometer Adoption
The global explosion of IoT-connected devices and smart technology is creating unprecedented demand for 3D accelerometers. These sensors have become essential components in smartphones, wearables, and smart home devices, enabling advanced motion sensing capabilities. The consumer electronics sector alone accounts for over 60% of accelerometer applications, with projections indicating the IoT market will surpass 29 billion connected devices by 2030. This exponential growth is driving innovation in 3D accelerometer technology, pushing manufacturers to develop smaller, more energy-efficient sensors capable of delivering high-precision measurements in increasingly compact form factors.
Automotive Safety Regulations Accelerate Market Expansion
Stringent vehicle safety mandates worldwide are significantly boosting adoption of 3D accelerometers in automotive applications. The growing implementation of electronic stability control (ESC) systems, required by law in many countries, directly depends on these sensors for rollover detection and crash sensing. Furthermore, the advancement of autonomous vehicle technologies has created demand for high-performance accelerometers that integrate with advanced driver assistance systems (ADAS). The automotive segment is projected to be the fastest-growing application area for 3D accelerometers, with anticipated compound annual growth exceeding 12% through 2030 as manufacturers incorporate more sophisticated safety features.
Healthcare Wearables Revolution Creates New Growth Avenues
The dramatic rise of medical and fitness wearables has opened significant opportunities for 3D accelerometer manufacturers. These sensors are critical for tracking patient movement patterns, detecting falls in elderly care, and monitoring physical activity in fitness devices. The global healthcare wearables market, currently valued at over $25 billion, is expected to nearly double within the next five years, directly correlating to increased demand for precision motion sensors. Recent technological advancements have enabled development of medical-grade accelerometers capable of detecting subtle movements with sub-milligravitational accuracy, expanding their use in clinical applications and remote patient monitoring.
MARKET RESTRAINTS
Miniaturization and Power Consumption Challenges Limit Deployment
While demand for compact 3D accelerometers grows, decreasing sensor size while maintaining accuracy presents significant engineering hurdles. As device dimensions shrink below 1mm³, manufacturers face increasing difficulties with signal noise reduction and calibration stability. Power consumption constraints in battery-operated applications further complicate development, requiring delicate trade-offs between performance and energy efficiency. These technical limitations affect both production yields and unit costs, potentially slowing market expansion in price-sensitive applications.
Intense Price Pressure from Asian Manufacturers Squeezes Margins
The rapid commoditization of basic accelerometer products, particularly from cost-competitive Asian manufacturers, has created pricing challenges for the broader market. With some MEMS accelerometer prices declining by as much as 40% over the past five years, established players are under pressure to differentiate through advanced features and specialized applications. This pricing erosion affects R&D investment capacity industry-wide, potentially slowing innovation cycles for next-generation sensor technologies.
MARKET CHALLENGES
Supply Chain Vulnerabilities Impact Production Stability
The global semiconductor shortage has exposed critical vulnerabilities in MEMS sensor supply chains, affecting 3D accelerometer production capacity worldwide. Specialized fabrication facilities for MEMS devices require substantial capital investment and have limited global capacity. Recent disruptions have created lead times exceeding six months for some accelerometer models, forcing OEMs to redesign products around available components. This instability threatens to temporarily constrain market growth despite strong underlying demand.
MARKET OPPORTUNITIES
Industrial IoT Expansion Creates New High-Value Applications
The growth of industrial Internet of Things (IIoT) solutions presents significant opportunities for advanced 3D accelerometer applications. Condition monitoring systems for industrial machinery increasingly incorporate vibration analysis capabilities that require high-performance accelerometers. These ruggedized sensors must operate reliably in harsh environments while providing precise measurement data. With predictive maintenance solutions projected to grow at 30% annually, manufacturers capable of delivering industrial-grade accelerometers with enhanced shock resistance and wide temperature tolerance are well positioned for market leadership.
Emergence of AI-Enabled Sensing Opens New Frontiers
The integration of artificial intelligence with motion sensing creates substantial innovation potential for 3D accelerometers. Smart sensors with embedded machine learning algorithms can perform edge processing, reducing system power consumption and response latency. This technology evolution is particularly relevant for applications like gesture recognition and human activity monitoring, where real-time processing provides significant user experience improvements. As AI adoption grows in consumer electronics and industrial applications, demand for intelligent accelerometers with processing capabilities is expected to rise dramatically.
3D ACCELEROMETERS MARKET TRENDS
Expanding Applications in Consumer Electronics Drive Market Growth
The global 3D accelerometers market is experiencing robust growth, primarily fueled by increasing integration in consumer electronics such as smartphones, tablets, and wearable devices. These components enable motion sensing, screen rotation, and gesture recognition functionalities that have become standard in modern devices. With over 1.5 billion smartphones shipped annually and wearable adoption surpassing 200 million units, the demand for high-precision, low-power accelerometers continues to escalate. Furthermore, gaming consoles and virtual reality systems are incorporating advanced motion tracking capabilities, creating additional growth avenues for 3D accelerometer manufacturers.
Other Trends
Automotive Safety Applications
Advanced driver assistance systems (ADAS) and electronic stability control technologies are driving significant adoption in the automotive sector. Modern vehicles now incorporate multiple 3D accelerometers for rollover detection, impact sensing, and navigation systems. Regulatory mandates in major markets like the EU and North America requiring electronic stability control in all new vehicles have further bolstered this demand. The automotive segment currently represents approximately 25% of industrial accelerometer applications, with projections indicating steady growth as autonomous vehicle development accelerates.
Miniaturization and MEMS Technology Advancements
Continuous breakthroughs in microelectromechanical systems (MEMS) fabrication techniques have enabled the development of smaller, more energy-efficient 3D accelerometers without compromising accuracy. Recent innovations have reduced package sizes below 3mm×3mm while maintaining sub-μg resolution capabilities. This miniaturization trend aligns perfectly with the requirements of IoT devices and medical implants, opening new application frontiers. Manufacturers are concurrently addressing power consumption challenges, with some next-generation products achieving 50% reduction in operational current compared to previous models.
Industrial IoT and Predictive Maintenance Applications
Industrial sector adoption is accelerating as manufacturers implement condition monitoring systems for predictive maintenance. 3D accelerometers provide critical vibration data that enables early detection of machinery faults, potentially preventing costly downtime. This application segment is growing at an estimated 18% CAGR as industries digitize operations. Particularly in oil & gas, energy generation, and heavy manufacturing sectors, the ability to monitor equipment health in real time without physical inspection presents significant operational advantages. Wireless sensor networks incorporating 3D accelerometers are becoming standard in modern industrial environments.
COMPETITIVE LANDSCAPE
Key Industry Players
Leading Sensor Manufacturers Compete Through Technological Differentiation
The global 3D accelerometers market features a diverse competitive ecosystem comprising semiconductor giants, specialized sensor manufacturers, and emerging technology firms. Infineon Technologies AG dominates the automotive segment, holding approximately 22% market share in vehicle stability systems as of 2023. This leadership stems from their proprietary MEMS technology and strategic partnerships with major automakers.
STMicroelectronics and Bosch Sensortec collectively account for nearly 35% of consumer electronics accelerometer shipments, driven by their ultra-low-power designs for smartphones and wearables. Both companies continue to invest heavily in nanotechnology R&D, with Bosch allocating over $400 million annually to MEMS development.
The industrial sector sees fierce competition between TE Connectivity and Honeywell International, who differentiate through ruggedized sensor designs capable of operating in extreme environments. Their combined expertise in aerospace and defense applications gives them a strong position in high-margin markets.
Emerging players like Murata Manufacturing are gaining traction through innovative packaging technologies that reduce sensor footprint while maintaining accuracy significantly improve battery life in IoT devices. Their recent product launches have captured 12% of the wireless sensor network market.
List of Key 3D Accelerometer Manufacturers
- Infineon Technologies AG (Germany)
- STMicroelectronics (Switzerland)
- Bosch Sensortec (Germany)
- TE Connectivity Ltd. (Switzerland)
- Honeywell International Inc. (U.S.)
- Murata Manufacturing Co., Ltd. (Japan)
- Analog Devices, Inc. (U.S.)
- NXP Semiconductors N.V. (Netherlands)
- Kionix, Inc. (U.S.)
Segment Analysis:
By Type
Wireless Network Connectivity Segment Leads Due to Increasing Demand for IoT and Smart Devices
The market is segmented based on type into:
- Wired network connectivity
- Wireless network connectivity
By Application
Consumer Electronics Dominates Market Share Driven by Smartphone and Wearable Adoption
The market is segmented based on application into:
- Consumer electronics
- Healthcare
- Aerospace & defense
- Industrial robotics
- Automotive
By Technology
MEMS-Based Accelerometers Hold Largest Share Due to Miniaturization Trends
The market is segmented based on technology into:
- MEMS-based
- Piezoelectric
- Piezoresistive
Regional Analysis: Global 3D Accelerometers Market
North America
The North American 3D accelerometers market dominates globally, driven by strong demand from automotive, aerospace, and healthcare sectors. The U.S. accounts for over 60% of regional revenue, fueled by IoT adoption and smart device proliferation. Stricter automotive safety regulations (e.g., NHTSA mandates on electronic stability control systems) and defense modernization programs ($842 billion U.S. defense budget for 2024) propel market growth. However, market saturation in consumer electronics presents challenges, pushing manufacturers toward high-precision industrial applications. Major players like Infineon and KEYENCE leverage advanced MEMS technology to maintain competitive advantage.
Europe
Europe maintains steady growth with stringent industrial standards (ISO 13849 for machinery safety) and rapid Industry 4.0 adoption. Germany leads in industrial robotics applications (~38% of EU demand), while France sees expansion in aerospace-grade accelerometers. The EU’s Green Deal initiative influences production methods, favoring energy-efficient MEMS fabrication. Challenges include slower upgrade cycles in automotive compared to North America and pricing pressures from Asian manufacturers. Recent collaborations between LMI Technologies and European research institutes aim to develop next-gen vibration monitoring systems for wind turbines and railway networks.
Asia-Pacific
As the fastest-growing market (projected 8.7% CAGR through 2028), Asia-Pacific benefits from burgeoning electronics manufacturing in China (~45% global smartphone production) and India’s defense modernization ($72.6 billion budget allocation). Japan remains pivotal for high-reliability components in automotive (Toyota, Honda) and robotics (FANUC). Emerging applications in structural health monitoring (India’s $1.4 trillion National Infrastructure Pipeline) and agricultural drones fuel demand. Price sensitivity and IP protection concerns persist, though Chinese firms like Huawei increasingly source domestic 3D accelerometers for IoT devices, reducing import reliance.
South America
Market growth here is tempered by economic volatility but shows promise in mining (Chile, Peru) and oil/gas (Brazil) equipment monitoring. Brazil’s automotive sector recovery (~10% production increase in 2023) drives aftermarket demand for vibration sensors. Infrastructure constraints and limited local semiconductor fabrication limit high-end adoption, with most imports coming from U.S. and Chinese suppliers. Recent trade agreements may improve component accessibility, particularly for Argentina’s renewable energy projects requiring condition monitoring systems.
Middle East & Africa
This emerging market focuses on defense (GCC nations’ $128.5 billion cumulative military spending) and oilfield applications. The UAE leads in smart city projects (Dubai 2040 Urban Plan) deploying 3D accelerometers in building stability systems. South Africa’s mining sector utilizes vibration sensing, though adoption slows due to power reliability issues. Long-term prospects exist in African IoT development (45% mobile penetration growth since 2020), but market education about precision measurement benefits remains crucial for broader industrial uptake beyond current oil/gas concentration.
Report Scope
This market research report provides a comprehensive analysis of the global and regional 3D accelerometers markets, covering the forecast period 2025–2032. It offers detailed insights into market dynamics, technological advancements, competitive landscape, and key trends shaping the industry.
Key focus areas of the report include:
- Market Size & Forecast: Historical data and future projections for revenue, unit shipments, and market value across major regions and segments.
- Segmentation Analysis: Detailed breakdown by product type, technology, application, and end-user industry to identify high-growth segments and investment opportunities.
- Regional Outlook: Insights into market performance across North America, Europe, Asia-Pacific, Latin America, and the Middle East & Africa, including country-level analysis where relevant.
- Competitive Landscape: Profiles of leading market participants, including their product offerings, R&D focus, manufacturing capacity, pricing strategies, and recent developments such as mergers, acquisitions, and partnerships.
- Technology Trends & Innovation: Assessment of emerging technologies, integration of AI/IoT, MEMS design trends, fabrication techniques, and evolving industry standards.
- Market Drivers & Restraints: Evaluation of factors driving market growth along with challenges, supply chain constraints, regulatory issues, and market-entry barriers.
- Stakeholder Analysis: Insights for component suppliers, OEMs, system integrators, investors, and policymakers regarding the evolving ecosystem and strategic opportunities.
Primary and secondary research methods are employed, including interviews with industry experts, data from verified sources, and real-time market intelligence to ensure the accuracy and reliability of the insights presented.
FREQUENTLY ASKED QUESTIONS:
What is the current market size of Global 3D Accelerometers Market?
-> 3D Accelerometers Market was valued at US$ 1.52 billion in 2024 and is projected to reach US$ 2.89 billion by 2032, at a CAGR of 8.34% during the forecast period 2025-2032.
Which key companies operate in Global 3D Accelerometers Market?
-> Key players include STMicroelectronics, Bosch Sensortec, NXP Semiconductors, Analog Devices, Murata Manufacturing, and TDK InvenSense, among others.
What are the key growth drivers?
-> Key growth drivers include increasing adoption in smartphones, wearables, automotive safety systems, and industrial IoT applications, along with advancements in MEMS technology.
Which region dominates the market?
-> Asia-Pacific dominates the market with over 45% share, driven by strong electronics manufacturing in China, Japan, and South Korea, while North America leads in technological innovation.
What are the emerging trends?
-> Emerging trends include integration with AI for predictive maintenance, development of ultra-low power sensors, and miniaturization for biomedical applications.

Get Sample Report PDF for Exclusive Insights
Report Sample Includes
- Table of Contents
- List of Tables & Figures
- Charts, Research Methodology, and more...


