EWSE Market, Size, Trends, Business Strategies 2026-2034

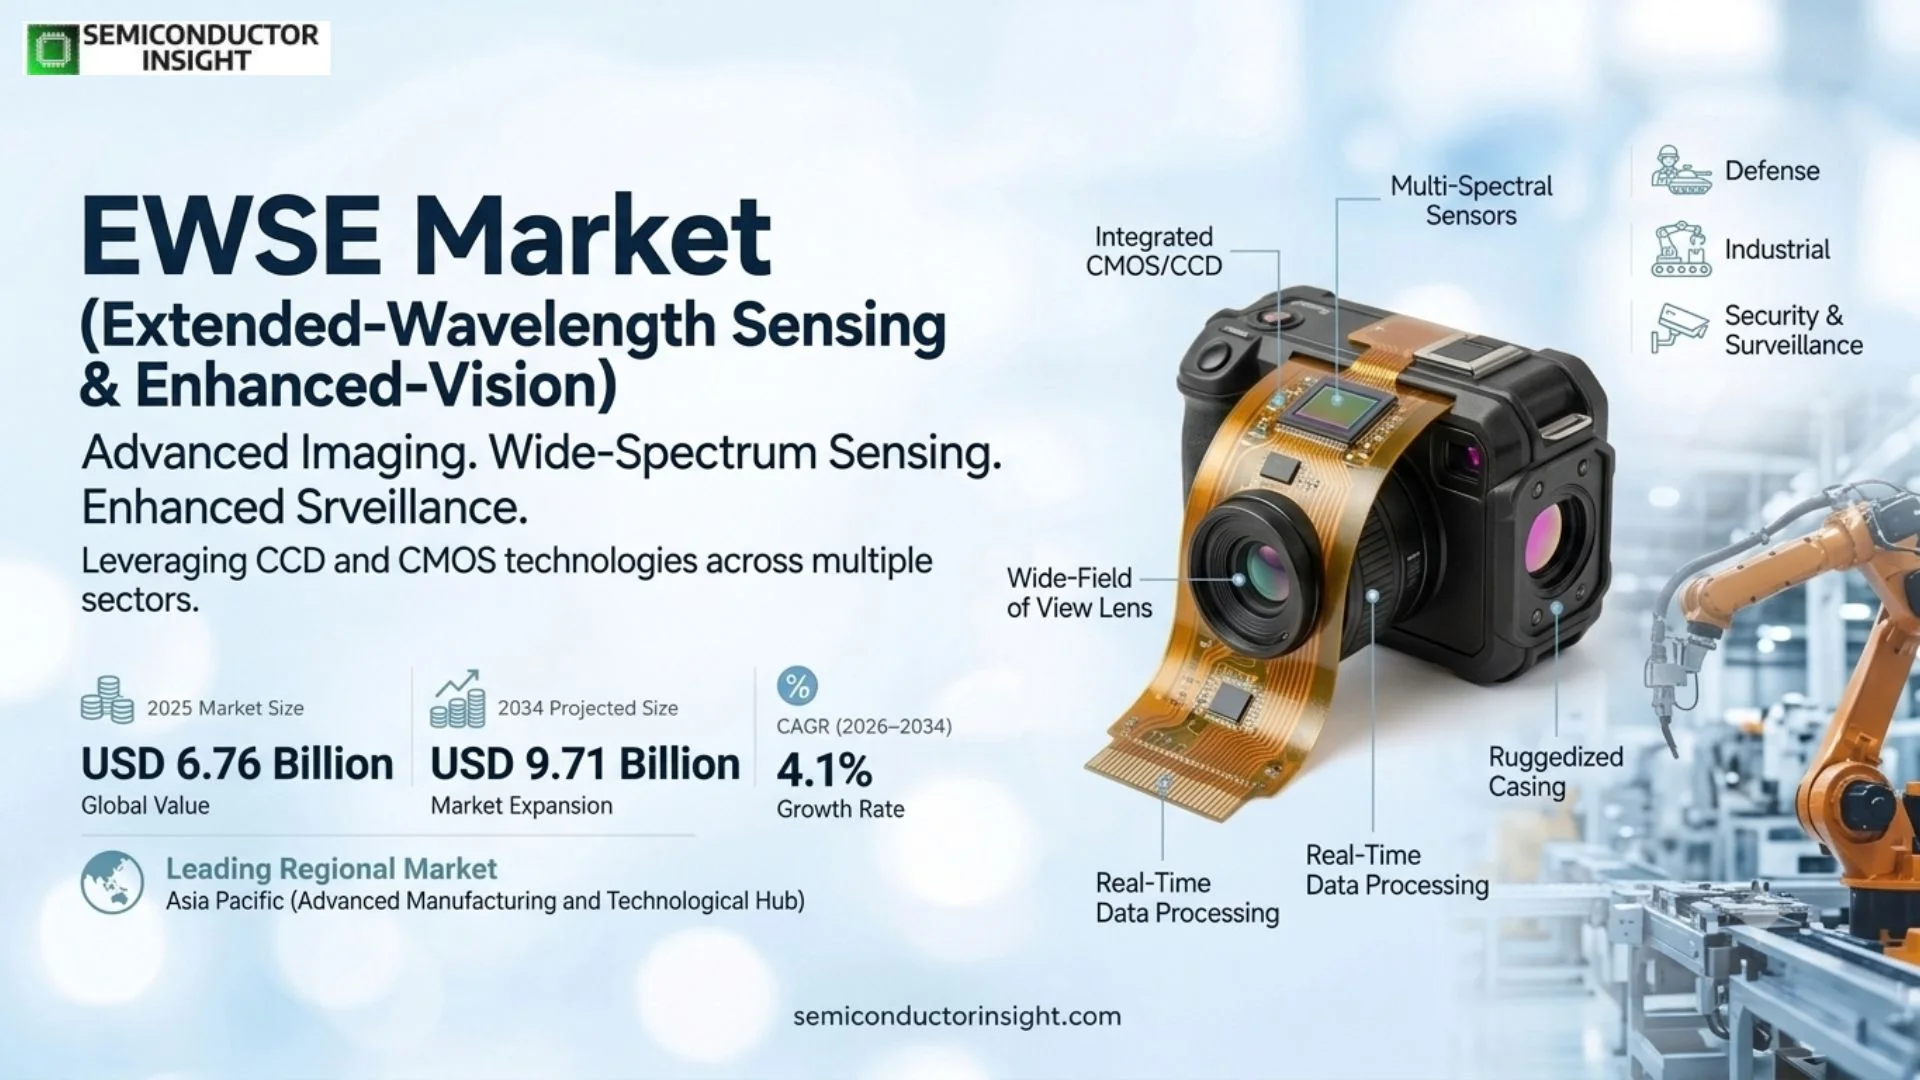
EWSE market is projected to reach USD 9.71 billion by 2034, representing a 4.1% CAGR during 2026–2034. The 2026 estimated market size is USD 7.04 billion. The market covers CCD and CMOS imaging technologies used across defense, industrial, and security and surveillance applications, with Asia Pacific positioned as the leading regional market.

PDF Icon Download Sample Report PDF
  • Quick Dispatch

    All Orders

  • Secure Payment

    100% Secure Payment

Price range: $1,500.00 through $4,250.00

Clear

Key Statistics

2025 Market Size
USD 6.76 billion
2034 Projected Size
USD 9.71 billion
CAGR (2026–2034)
4.1%
Largest Market in 2025
Asia Pacific

Key Takeaways

  • CMOS is the strategic growth technology because lower power, on-chip processing, higher integration and modern global-shutter architectures are expanding adoption across surveillance, defense and industrial vision.
  • Security and surveillance remains a major application as 4K, HDR, low-light and AI-enabled cameras require better sensitivity, dynamic range and edge-ready image data.
  • Industrial imaging is expanding through machine vision, robotics and automated inspection, where global-shutter CMOS sensors provide distortion-free capture of fast-moving objects.
  • Asia Pacific is the leading regional market through image-sensor manufacturing, security-camera production and industrial-electronics scale in China, Japan, South Korea and other Asian markets.
  • Defense imaging is moving toward fused and intensified digital systems. Photonis/Exosens now combines advanced image intensifier technology with CMOS cameras for low-light defense and surveillance.

EWSE Market Overview

EWSE market is valued at USD 6.76 billion in 2025 and is projected to reach USD 9.71 billion by 2034, representing a 4.1% CAGR during 2026–2034. The 2026 estimated market size is USD 7.04 billion. The market covers CCD and CMOS imaging technologies used across defense, industrial, and security and surveillance applications, with Asia Pacific positioned as the leading regional market.

Base year: 2025 · Estimated year: 2026 · Forecast period: 2026–2034 · Historical data: 2019–2025 · Values in USD

EWSE products in this market are image-sensing devices and related imaging solutions that convert photons into electrical signals for digital processing. The competitive landscape includes CMOS image-sensor vendors, low-light and intensified-imaging specialists, and companies serving security, machine vision and defense applications. Performance is determined by sensitivity, dynamic range, shutter architecture, frame rate, noise, spectral response and power consumption.

CMOS technology continues to displace CCD in many new systems because it supports smaller pixels, lower system power, higher levels of on-chip integration and scalable high-speed digital interfaces. Global-shutter CMOS is especially important in machine vision and robotics because all pixels capture at the same instant, avoiding motion distortion. Rolling-shutter CMOS remains widely used in surveillance where low-light performance, HDR and cost are critical.

Application requirements are diverging. Industrial vision needs fast global shutter, precise synchronization and deterministic image capture; security cameras emphasize high dynamic range, low-light sensitivity and long operating life; defense platforms add SWaP constraints, very low-light imaging and ruggedization. This creates room for both high-volume commercial sensors and specialized premium imaging products.

Segment Analysis: By Type

By type, the market is segmented into CCD and CMOS. CMOS is the main technology direction because modern devices integrate active pixels, column or on-chip conversion, digital interfaces and additional processing while reducing power and system complexity.

Type Technology profile Market position
CMOS Active-pixel CMOS architectures integrate readout and digital functions on chip. Modern devices support rolling or global shutter, high frame rates, HDR, NIR enhancement and MIPI/LVDS interfaces. Backside illumination and stacked designs improve sensitivity and integration. Primary growth segment. Security, machine vision, robotics and defense systems increasingly standardize on CMOS because of power efficiency, speed, integration and broad foundry scalability.
CCD CCD sensors transfer charge across the pixel array to one or a few output nodes. The architecture historically delivered very uniform low-noise imaging and remains relevant in selected scientific, defense and specialty applications where established performance outweighs integration benefits. A mature specialty segment. New mainstream designs increasingly favor CMOS, while CCD remains useful where legacy systems, specific spectral characteristics or proven image quality are valued.

Shutter and spectral-performance segmentation

The market can also be segmented by shutter architecture and spectral capability. Global shutter is central to machine vision and robotics, while rolling shutter remains common in surveillance and cost-sensitive systems. Visible, near-infrared and intensified imaging cover different operating environments, from factory inspection to nighttime security and defense observation.

Axis Segments Commercial implication
By Shutter Architecture Rolling Shutter · Global Shutter Rolling shutter supports high-resolution, power-efficient surveillance and general imaging. Global shutter eliminates motion distortion and is preferred for fast industrial inspection, robotics and high-speed measurement.
By Spectral / Low-Light Capability Visible · NIR-Enhanced · Intensified / Low-Light · Extended Spectrum NIR enhancement improves night and machine-vision performance; intensified systems serve extremely low-light defense and surveillance; extended-spectrum imaging addresses specialized industrial and security requirements.

Segment Analysis: By Application

By application, the market covers Defense, Industrial, and Security & Surveillance. Security and industrial imaging drive broad unit demand, while defense supports higher-value systems with low-light, rugged and mission-specific performance.

Application Key market insight
Security & Surveillance Commercial and industrial cameras require reliable 24/7 imaging across bright sunlight, backlight and low-light scenes. High dynamic range, NIR sensitivity, low noise and edge-AI compatibility are increasingly standard requirements for fixed, dome, PTZ and smart-home security cameras.
Industrial Machine vision, robotics, inspection, code reading and factory automation use image sensors to measure, classify and guide motion in real time. High frame rate and global shutter reduce motion artifacts, while compact BSI sensors support embedded vision and 3D sensing.
Defense Defense systems use low-light cameras, image intensifiers and rugged sensors for night observation, targeting, situational awareness and surveillance. High sensitivity, SWaP optimization and wide dynamic range are key differentiators.
Robotics & Automation Robots increasingly use multiple cameras for navigation, SLAM, bin picking and safety. NIR-enhanced global-shutter CMOS devices allow structured-light and active-stereo systems to operate across variable illumination.
Smart Infrastructure Traffic monitoring, access control, building security and city surveillance create recurring demand for imaging platforms that combine HDR, low-light performance and embedded analytics.

EWSE Market Growth

Regional Analysis

Asia Pacific is the leading EWSE market, supported by security-camera manufacturing, electronics production, industrial automation and image-sensor supply chains. North America remains a major defense, industrial and surveillance market, while Europe is strong in machine vision, industrial imaging and specialized security applications.

How do regional EWSE demand patterns differ?

Asia Pacific combines manufacturing scale and fast automation deployment. North America has strong defense, security and machine-vision demand and remains important for advanced system design. Europe emphasizes industrial automation, robotics and premium sensing. Emerging regions grow through surveillance infrastructure, industrial automation and security investment.

Region Market position Growth outlook Core demand Commercial priority
Asia Pacific Leading High Security, industrial & electronics Cost, integration and production scale
North America Major high-value market Moderate to high Defense, security & industrial Low-light, AI integration and ruggedness
Europe Industrial technology hub Moderate Machine vision & automation Global shutter, quality and lifecycle
South America Emerging Moderate Security & industrial Affordability and distribution
Middle East & Africa Emerging Moderate Security, defense & infrastructure Low-light performance and rugged systems
Asia PacificLEADING REGIONAL MARKET

Why does Asia Pacific lead the market?

The region combines image-sensor production, security-camera manufacturing, industrial automation and electronics scale. China is a major security and camera-manufacturing base, Japan has long-standing sensor and machine-vision expertise, South Korea has strong electronics demand, and Southeast Asia supports broader electronics production.

Market position
Leading
Growth outlook
High
Demand profile
Security & industrial
Commercial gate
Scale and integration
Country / cluster Role Market instance
China High-volume imaging market Security, industrial cameras and local sensor supply create large unit demand.
Japan Sensor / machine-vision hub Industrial automation and precision imaging support higher-specification sensors.
South Korea Electronics ecosystem Security, robotics and electronics production create recurring demand.
India / Southeast Asia Growth markets Security infrastructure and manufacturing automation expand the installed imaging base.
Modern security sensors are moving toward very high dynamic range. OMNIVISION’s OS08G10 supports 4K HDR and up to 140 dB dynamic range for high-resolution security applications.
Global-shutter CMOS supports fast industrial inspection. ams OSRAM’s current machine-vision portfolio includes high-speed global-shutter sensors for automation and robotics.
Regional camera manufacturing favors local sensor design-in. Shorter engineering cycles help vendors align resolution, optics and ISP requirements with OEM platforms.
North AmericaDEFENSE & INDUSTRIAL IMAGING

What drives North American demand?

Defense, surveillance, industrial automation and advanced machine vision support high-value demand. U.S. security and defense programs require low-light and rugged imaging, while industrial customers use high-speed CMOS sensors for automation and quality inspection. The region also has strong design ecosystems for smart cameras and AI vision.

Market position
Major high-value
Growth outlook
Moderate to high
Demand profile
Defense & industrial
Commercial gate
Performance and ruggedness
Country / cluster Role Market instance
United States Primary market Defense, industrial automation and security create the strongest regional demand.
Canada Industrial / research niche Machine vision, security and research imaging support specialized applications.
Mexico Manufacturing growth market Factory automation and security systems create downstream image-sensor demand.
Photonis Defense received a 1,600-system U.S. Army BiNOD delivery order in August 2026. The program combines advanced low-light imaging and U.S.-based system production.
Machine vision continues to expand into physical AI. Image sensors provide real-time visual data for automated inspection and robotic decision-making.
Security systems increasingly require edge-ready HDR imaging. Higher dynamic range reduces loss of detail across headlights, shadows and mixed lighting.
Europe

What differentiates Europe?

Europe has strong machine-vision, robotics, defense and scientific-imaging demand. Germany leads industrial automation, while France and other countries support defense and photonics ecosystems. Buyers emphasize high reliability, precision, long lifecycle and application-specific imaging rather than only unit cost.

Market position
Industrial technology hub
Growth outlook
Moderate
Demand profile
Machine vision & defense
Commercial gate
Quality and lifecycle
Country / cluster Role Market instance
Germany Automation hub Machine vision and robotics create strong global-shutter sensor demand.
France Defense / photonics hub Low-light and intensified imaging support defense and scientific applications.
Benelux / Nordics Advanced imaging niches Industrial, scientific and security markets support specialized sensors.
Exosens introduced 80 lp/mm image-intensifier technology in January 2026. The platform targets scientific and low-light imaging applications.
Photonis iLumos integrates a 5G image intensifier with a CMOS sensor. The architecture targets compact defense and surveillance imaging.
European machine vision values global-shutter performance. Distortion-free capture is essential for fast-moving production lines and robotics.
South America

How does demand develop in South America?

Demand is concentrated in security, industrial inspection and smart-infrastructure projects. Brazil is the largest regional opportunity, while other countries adopt imaging technologies through imported cameras and automation systems. Cost and distribution remain important barriers to higher-end imaging adoption.

Market position
Emerging
Growth outlook
Moderate
Demand profile
Security & industrial
Commercial gate
Cost and channel access
Country / cluster Role Market instance
Brazil Largest regional market Security systems and industrial automation create the broadest demand.
Chile Industrial niche Mining, infrastructure and security support specialized vision use.
Argentina Selective market Industrial and public-security projects create smaller demand.
Security upgrades drive mainstream CMOS adoption. Cost-effective HDR sensors fit commercial surveillance platforms.
Industrial inspection grows with factory automation. Global-shutter sensors support motion capture and defect detection.
Most high-end products remain imported. Distributor support and OEM integration influence local availability.
Middle East & Africa

What drives regional growth?

Security, defense, smart-city and critical-infrastructure investment are the main drivers. Gulf countries deploy advanced surveillance and low-light imaging at airports, borders and large infrastructure projects, while Africa is led by urban security and industrial demand in selected markets.

Market position
Emerging
Growth outlook
Moderate
Demand profile
Security & defense
Commercial gate
Low-light and ruggedness
Country / cluster Role Market instance
UAE Security / smart-city hub Advanced surveillance and infrastructure create premium imaging demand.
Saudi Arabia Large infrastructure market Smart-city, defense and industrial projects expand security imaging.
South Africa Regional industrial base Commercial security and automation create the strongest sub-Saharan demand.
24/7 surveillance favors NIR and HDR sensors. High contrast and low-light conditions are common in outdoor infrastructure.
Defense applications value compact intensified imaging. SWaP and ruggedness remain critical system constraints.
Smart-city projects expand camera density. Edge analytics increases the value of high-quality sensor data.

Competitive Landscape

Key participants include OMNIVISION Technologies, BAE Systems, Photonis/Exosens, ams OSRAM, GalaxyCore, onsemi, Pixelplus and PixArt Imaging. Competition is split between high-volume CMOS suppliers and specialized defense or industrial imaging companies, with product differentiation centered on low-light performance, global shutter, dynamic range, power and spectral response.

OMNIVISION has a broad commercial and industrial security portfolio spanning HDR, low-light and NIR-enhanced CMOS sensors. Current security products include high-resolution sensors using PureCel, Nyxel and TheiaCel technologies, giving the company broad coverage from cost-sensitive 1080p designs to high-end 4K surveillance.

onsemi serves machine vision and industrial imaging with global-shutter families including XGS and PYTHON, while ams OSRAM provides global-shutter CMOS products such as Mira and CMV/CSG devices for robotics and factory automation. These vendors compete heavily on frame rate, NIR sensitivity, pixel size and compact system integration.

Photonis/Exosens represents the specialized end of the market with intensified and low-light imaging for defense and surveillance. BAE Systems serves defense imaging and sensing applications, while GalaxyCore, Pixelplus and PixArt compete across high-volume imaging and application-specific sensor categories.

Competitive tier structure

Competitive tier Representative companies Competitive strengths
High-volume CMOS leaders OMNIVISION; onsemi; GalaxyCore; Pixelplus; PixArt Imaging CMOS scale, security-camera design wins, low-light performance and cost-efficient integration
Industrial / machine-vision specialists ams OSRAM; onsemi Global shutter, NIR sensitivity, high frame rate and compact machine-vision architectures
Defense / low-light specialists Photonis / Exosens; BAE Systems Intensified imaging, rugged systems, extreme low-light performance and defense qualification

Key companies profiled

OMNIVISION TechnologiesBAE SystemsPhotonis / Exosensams OSRAMGalaxyCoreonsemiPixelplusPixArt Imaging

EWSE Production & Image-Sensor Capacity Analysis

Capacity is determined by image-sensor wafer supply, pixel-process technology, wafer-level optics or packaging, testing and customer-specific qualification. CMOS capacity benefits from mainstream semiconductor foundry infrastructure, while specialized intensified and defense imaging uses lower-volume processes with more complex materials, calibration and system assembly.

High-volume CMOS economics depend on wafer yield and pixel scaling. Backside illumination, stacked architectures and advanced HDR add process complexity but can improve sensitivity and on-chip functionality. Security and industrial customers also require stable supply over longer periods than consumer smartphones, increasing the value of product longevity.

Specialized low-light imaging has a different capacity model. Image intensifier tubes, low-noise cameras and rugged defense systems require tight material control, calibration and final assembly. Production is therefore measured more by qualified system output than raw wafer starts.

Market Dynamics

Growth is driven by security infrastructure, industrial automation, machine vision, defense modernization and AI-enabled imaging. Restraints include rapid sensor obsolescence, price pressure, optical-system complexity and long defense qualification. Opportunities center on HDR security sensors, global-shutter robotics, NIR imaging and intensified digital cameras.

MARKET DRIVERS

Security cameras are moving to higher image quality

4K, HDR and better low-light imaging improve identification and reduce blind spots. Sensor vendors can add value through dynamic range, NIR sensitivity and lower power.

Machine vision needs distortion-free high-speed capture

Global-shutter CMOS lets factories inspect moving objects without rolling-shutter artifacts. Higher frame rates improve line speed and inspection throughput.

Defense modernization increases low-light requirements

Night observation and persistent surveillance benefit from intensified and high-sensitivity digital imaging. Compact integrated cameras can reduce size and weight on soldier, vehicle and airborne platforms.

AI increases the value of clean sensor data

Edge analytics depend on accurate images. Better sensor dynamic range and noise performance can improve detection and classification before software processing.

Drivers Impact Analysis

Driver Impact Primary markets Time horizon
Security-camera modernization High Asia Pacific, North America, Middle East Persistent
Industrial automation / machine vision High Europe, Asia Pacific, North America Persistent
Defense low-light imaging Medium to high North America, Europe, Middle East Medium to long term
AI / edge vision High Global Medium to long term

MARKET RESTRAINTS

Image-sensor generations change quickly

Pixel size, HDR and interface technology evolve rapidly, which can shorten product lives and require frequent camera redesign.

High-volume security markets are price competitive

Sensor performance must improve while OEMs continue to demand lower system cost, pressuring margins in mainstream camera categories.

Sensor performance depends on the full optical stack

Lens quality, illumination, ISP tuning and enclosure design can limit system performance even when the image sensor itself is strong.

Defense programs require long validation cycles

Ruggedization, export controls and mission qualification slow adoption of new imaging technology despite strong performance.

Restraints Impact Analysis

Restraint Impact Exposure Time horizon
Rapid technology cycles High Commercial CMOS Persistent
Price pressure Medium to high Security / industrial volume Persistent
Optical and ISP integration Medium OEM designs Persistent
Defense qualification time Medium to high Military applications Medium term

MARKET OPPORTUNITIES

Expand HDR security imaging

High dynamic range and NIR performance are increasingly valuable in outdoor, traffic and critical-infrastructure surveillance.

Scale global-shutter CMOS in robotics

Robots and machine-vision systems need compact, low-power sensors with synchronized exposure and high frame rate.

Integrate intensified CMOS systems

Combining image intensifier tubes with digital CMOS cameras creates compact systems that bridge analog low-light gain and digital processing.

Use NIR for active 3D vision

Structured light and active stereo use NIR-enhanced sensors to improve depth range and reduce visible illumination requirements.

EWSE Image-Sensor Value Chain Analysis

Pixel / sensor design

Pixel architecture, shutter, HDR and analog readout determine sensitivity and speed.

Wafer fabrication & packaging

CMOS or CCD wafers are fabricated, diced and packaged for camera or module integration.

Optics / ISP integration

Lenses, illumination and image processors convert raw sensor data into usable video or measurements.

Defense / industrial / security deployment

Cameras and imaging systems deliver surveillance, inspection, navigation and low-light observation.

Pixel architecture determines core imaging performance

Pixel area, read noise, full-well capacity and shutter method set sensitivity, dynamic range and motion behavior.

Fabrication controls yield and cost

CMOS sensors benefit from high-volume semiconductor processing, while specialty low-light and intensified technologies require more dedicated production.

Optics and processing shape system-level image quality

A sensor must be matched to lens MTF, illumination and ISP algorithms. HDR or NIR capability only creates value when the camera stack is tuned correctly.

Application requirements determine product life

Security and industrial sensors often stay in production longer than consumer-camera parts because camera certification and system redesign are costly.

Recent Developments in the EWSE Market

25 August 2026

Photonis Defense receives first U.S. Army BiNOD production order

Photonis Defense received an order for 1,600 complete binocular night-observation systems, marking low-rate initial production and expanding low-light defense imaging in the U.S.

Primary source

14 January 2026

Exosens introduces 80 lp/mm image-intensifier technology

The new Photonis image-intensifier platform reaches up to 80 lp/mm resolution with ultra-fast gating for scientific and low-light imaging.

Primary source

2026

Photonis expands intensified CMOS camera platform

The current iLumos system combines a Photonis 5G image intensifier tube with a CMOS sensor in a compact SWaP-optimized camera for defense and surveillance.

Primary source

2025

ams OSRAM updates global-shutter machine-vision sensors

Current Mira and CMV/CSG products support high-speed global shutter, NIR enhancement and industrial machine-vision applications.

Primary source

Current

OMNIVISION expands high-dynamic-range security imaging

The OS08G10 combines 4K resolution with TheiaCel technology and HDR operation for high-resolution security cameras.

Primary source

REPORT SCOPE & SEGMENTATION

Attribute Details
Study Period 2019–2034
Base Year 2025
Estimated Year 2026
Forecast Period 2026–2034
Historical Period 2019–2025
Market Size 2025 USD 6.76 billion
Market Size 2034 USD 9.71 billion
Growth Rate 4.1% during 2026–2034
Unit Value (USD Million/Billion) and image-sensor unit shipments
By Type CCD · CMOS
By Application Defense · Industrial · Security and Surveillance
By Shutter Architecture Rolling Shutter · Global Shutter
By Spectral Capability Visible · NIR-Enhanced · Intensified / Low-Light · Extended Spectrum
By Region Each region analysed by sensor type, application, shutter architecture, low-light capability and country market
North AmericaUnited States, Canada, Mexico
EuropeGermany, France, United Kingdom, Benelux and other European markets
Asia PacificChina, Japan, South Korea, India, Southeast Asia and other Asian markets
South AmericaBrazil, Chile, Argentina and other South American markets
Middle East & AfricaUAE, Saudi Arabia, South Africa and other MEA markets
Key Companies Profiled OMNIVISION Technologies · BAE Systems · Photonis / Exosens · ams OSRAM · GalaxyCore · onsemi · Pixelplus · PixArt Imaging
Customization Scope Free report customization equivalent to up to four analyst working days with purchase. Addition or alteration to country, regional and segment scope.

Frequently Asked Questions

What is the 2025 size of the EWSE market?

The market is valued at USD 6.76 billion in 2025 and is projected to reach USD 9.71 billion by 2034. The 2026 estimate is USD 7.04 billion and the 2026–2034 CAGR is 4.1%.

Which image-sensor technology is gaining share?

CMOS is the main growth technology because it supports lower power, higher integration, high frame rate, HDR and global-shutter architectures for security, industrial and defense imaging.

Which applications are covered?

The market covers defense, industrial, and security and surveillance applications. Industrial machine vision and security cameras drive broad unit demand, while defense supports specialized low-light systems.

Which region leads the market?

Asia Pacific is the leading regional market through image-sensor manufacturing, security-camera production, industrial automation and electronics scale.

What is the estimated market size in 2026?

The 2026 estimated market size is USD 7.04 billion, based on the long-term market growth path from the published 2023 and 2032 values.

Why is global shutter important?

Global shutter captures all pixels at the same moment, preventing motion distortion. It is important in machine vision, robotics and high-speed inspection where moving objects must be measured accurately.

What are the main market restraints?

Rapid sensor generations, pricing pressure, camera-system integration and long defense qualification cycles are the main constraints.

How does low-light imaging create value?

NIR enhancement, HDR and image intensification improve visibility in dark or mixed-light conditions, supporting surveillance, defense observation and industrial inspection.

Which companies are active in the market?

Key companies include OMNIVISION, BAE Systems, Photonis/Exosens, ams OSRAM, GalaxyCore, onsemi, Pixelplus and PixArt Imaging.

What does the report cover?

The report covers CCD and CMOS technologies, defense, industrial and security applications, regional markets, competitive landscape, production analysis, market dynamics, recent developments and supporting evidence.

Research Sources & Evidence Base

View primary and authoritative evidence used in this overview
  1. OMNIVISION. OS08G10 Security Image Sensor – Official product evidence on 4K HDR CMOS imaging for security applications.
  2. onsemi. Machine Vision Image Sensors – Official portfolio covering global-shutter CMOS image sensors for industrial machine vision.
  3. ams OSRAM. CMOS Image Sensing Technology – Official technology overview of global-shutter CMOS and industrial imaging.
  4. Exosens. Defense & Surveillance Imaging – Official overview of low-light and intensified imaging for defense and surveillance.
  5. Exosens. Photonis Defense BiNOD Order – August 2026 primary evidence on low-light defense imaging commercialization.

EWSE Market, Size, Trends, Business Strategies 2026-2034

Get Sample Report PDF for Exclusive Insights

Report Sample Includes

  • Table of Contents
  • List of Tables & Figures
  • Charts, Research Methodology, and more...

PDF Icon Download Sample Report PDF

Download Sample Report

Table of Content

Table of Contents
1 Research Methodology and Statistical Scope
1.1 Market Definition and Statistical Scope of EWSE
1.2 Key Market Segments
1.2.1 EWSE Segment by Type
1.2.2 EWSE Segment by Application
1.3 Methodology & Sources of Information
1.3.1 Research Methodology
1.3.2 Research Process
1.3.3 Market Breakdown and Data Triangulation
1.3.4 Base Year
1.3.5 Report Assumptions & Caveats
2 EWSE Market Overview
2.1 Global Market Overview
2.1.1 Global EWSE Market Size (M USD) Estimates and Forecasts (2019-2032)
2.1.2 Global EWSE Sales Estimates and Forecasts (2019-2032)
2.2 Market Segment Executive Summary
2.3 Global Market Size by Region
3 EWSE Market Competitive Landscape
3.1 Global EWSE Sales by Manufacturers (2019-2025)
3.2 Global EWSE Revenue Market Share by Manufacturers (2019-2025)
3.3 EWSE Market Share by Company Type (Tier 1, Tier 2, and Tier 3)
3.4 Global EWSE Average Price by Manufacturers (2019-2025)
3.5 Manufacturers EWSE Sales Sites, Area Served, Product Type
3.6 EWSE Market Competitive Situation and Trends
3.6.1 EWSE Market Concentration Rate
3.6.2 Global 5 and 10 Largest EWSE Players Market Share by Revenue
3.6.3 Mergers & Acquisitions, Expansion
4 EWSE Industry Chain Analysis
4.1 EWSE Industry Chain Analysis
4.2 Market Overview of Key Raw Materials
4.3 Midstream Market Analysis
4.4 Downstream Customer Analysis
5 The Development and Dynamics of EWSE Market
5.1 Key Development Trends
5.2 Driving Factors
5.3 Market Challenges
5.4 Market Restraints
5.5 Industry News
5.5.1 New Product Developments
5.5.2 Mergers & Acquisitions
5.5.3 Expansions
5.5.4 Collaboration/Supply Contracts
5.6 Industry Policies
6 EWSE Market Segmentation by Type
6.1 Evaluation Matrix of Segment Market Development Potential (Type)
6.2 Global EWSE Sales Market Share by Type (2019-2025)
6.3 Global EWSE Market Size Market Share by Type (2019-2025)
6.4 Global EWSE Price by Type (2019-2025)
7 EWSE Market Segmentation by Application
7.1 Evaluation Matrix of Segment Market Development Potential (Application)
7.2 Global EWSE Market Sales by Application (2019-2025)
7.3 Global EWSE Market Size (M USD) by Application (2019-2025)
7.4 Global EWSE Sales Growth Rate by Application (2019-2025)
8 EWSE Market Consumption by Region
8.1 Global EWSE Sales by Region
8.1.1 Global EWSE Sales by Region
8.1.2 Global EWSE Sales Market Share by Region
8.2 North America
8.2.1 North America EWSE Sales by Country
8.2.2 U.S.
8.2.3 Canada
8.2.4 Mexico
8.3 Europe
8.3.1 Europe EWSE Sales by Country
8.3.2 Germany
8.3.3 France
8.3.4 U.K.
8.3.5 Italy
8.3.6 Russia
8.4 Asia Pacific
8.4.1 Asia Pacific EWSE Sales by Region
8.4.2 China
8.4.3 Japan
8.4.4 South Korea
8.4.5 India
8.4.6 Southeast Asia
8.5 South America
8.5.1 South America EWSE Sales by Country
8.5.2 Brazil
8.5.3 Argentina
8.5.4 Columbia
8.6 Middle East and Africa
8.6.1 Middle East and Africa EWSE Sales by Region
8.6.2 Saudi Arabia
8.6.3 UAE
8.6.4 Egypt
8.6.5 Nigeria
8.6.6 South Africa
9 EWSE Market Production by Region
9.1 Global Production of EWSE by Region (2019-2025)
9.2 Global EWSE Revenue Market Share by Region (2019-2025)
9.3 Global EWSE Production, Revenue, Price and Gross Margin (2019-2025)
9.4 North America EWSE Production
9.4.1 North America EWSE Production Growth Rate (2019-2025)
9.4.2 North America EWSE Production, Revenue, Price and Gross Margin (2019-2025)
9.5 Europe EWSE Production
9.5.1 Europe EWSE Production Growth Rate (2019-2025)
9.5.2 Europe EWSE Production, Revenue, Price and Gross Margin (2019-2025)
9.6 Japan EWSE Production (2019-2025)
9.6.1 Japan EWSE Production Growth Rate (2019-2025)
9.6.2 Japan EWSE Production, Revenue, Price and Gross Margin (2019-2025)
9.7 China EWSE Production (2019-2025)
9.7.1 China EWSE Production Growth Rate (2019-2025)
9.7.2 China EWSE Production, Revenue, Price and Gross Margin (2019-2025)
10 Key Companies Profile
10.1 Omnivision Technologies
10.1.1 Omnivision Technologies EWSE Basic Information
10.1.2 Omnivision Technologies EWSE Product Overview
10.1.3 Omnivision Technologies EWSE Product Market Performance
10.1.4 Omnivision Technologies Business Overview
10.1.5 Omnivision Technologies EWSE SWOT Analysis
10.1.6 Omnivision Technologies Recent Developments
10.2 Bae Systems
10.2.1 Bae Systems EWSE Basic Information
10.2.2 Bae Systems EWSE Product Overview
10.2.3 Bae Systems EWSE Product Market Performance
10.2.4 Bae Systems Business Overview
10.2.5 Bae Systems EWSE SWOT Analysis
10.2.6 Bae Systems Recent Developments
10.3 Photonis
10.3.1 Photonis EWSE Basic Information
10.3.2 Photonis EWSE Product Overview
10.3.3 Photonis EWSE Product Market Performance
10.3.4 Photonis EWSE SWOT Analysis
10.3.5 Photonis Business Overview
10.3.6 Photonis Recent Developments
10.4 Ams Ag
10.4.1 Ams Ag EWSE Basic Information
10.4.2 Ams Ag EWSE Product Overview
10.4.3 Ams Ag EWSE Product Market Performance
10.4.4 Ams Ag Business Overview
10.4.5 Ams Ag Recent Developments
10.5 Galaxycore
10.5.1 Galaxycore EWSE Basic Information
10.5.2 Galaxycore EWSE Product Overview
10.5.3 Galaxycore EWSE Product Market Performance
10.5.4 Galaxycore Business Overview
10.5.5 Galaxycore Recent Developments
10.6 On Semiconductor
10.6.1 On Semiconductor EWSE Basic Information
10.6.2 On Semiconductor EWSE Product Overview
10.6.3 On Semiconductor EWSE Product Market Performance
10.6.4 On Semiconductor Business Overview
10.6.5 On Semiconductor Recent Developments
10.7 Pixelplus
10.7.1 Pixelplus EWSE Basic Information
10.7.2 Pixelplus EWSE Product Overview
10.7.3 Pixelplus EWSE Product Market Performance
10.7.4 Pixelplus Business Overview
10.7.5 Pixelplus Recent Developments
10.8 Pixart Imaging
10.8.1 Pixart Imaging EWSE Basic Information
10.8.2 Pixart Imaging EWSE Product Overview
10.8.3 Pixart Imaging EWSE Product Market Performance
10.8.4 Pixart Imaging Business Overview
10.8.5 Pixart Imaging Recent Developments
11 EWSE Market Forecast by Region
11.1 Global EWSE Market Size Forecast
11.2 Global EWSE Market Forecast by Region
11.2.1 North America Market Size Forecast by Country
11.2.2 Europe EWSE Market Size Forecast by Country
11.2.3 Asia Pacific EWSE Market Size Forecast by Region
11.2.4 South America EWSE Market Size Forecast by Country
11.2.5 Middle East and Africa Forecasted Consumption of EWSE by Country
12 Forecast Market by Type and by Application (2025-2032)
12.1 Global EWSE Market Forecast by Type (2025-2032)
12.1.1 Global Forecasted Sales of EWSE by Type (2025-2032)
12.1.2 Global EWSE Market Size Forecast by Type (2025-2032)
12.1.3 Global Forecasted Price of EWSE by Type (2025-2032)
12.2 Global EWSE Market Forecast by Application (2025-2032)
12.2.1 Global EWSE Sales (K Units) Forecast by Application
12.2.2 Global EWSE Market Size (M USD) Forecast by Application (2025-2032)
13 Conclusion and Key FindingsList of Tables
Table 1. Introduction of the Type
Table 2. Introduction of the Application
Table 3. Market Size (M USD) Segment Executive Summary
Table 4. EWSE Market Size Comparison by Region (M USD)
Table 5. Global EWSE Sales (K Units) by Manufacturers (2019-2025)
Table 6. Global EWSE Sales Market Share by Manufacturers (2019-2025)
Table 7. Global EWSE Revenue (M USD) by Manufacturers (2019-2025)
Table 8. Global EWSE Revenue Share by Manufacturers (2019-2025)
Table 9. Company Type (Tier 1, Tier 2, and Tier 3) & (based on the Revenue in EWSE as of 2022)
Table 10. Global Market EWSE Average Price (USD/Unit) of Key Manufacturers (2019-2025)
Table 11. Manufacturers EWSE Sales Sites and Area Served
Table 12. Manufacturers EWSE Product Type
Table 13. Global EWSE Manufacturers Market Concentration Ratio (CR5 and HHI)
Table 14. Mergers & Acquisitions, Expansion Plans
Table 15. Industry Chain Map of EWSE
Table 16. Market Overview of Key Raw Materials
Table 17. Midstream Market Analysis
Table 18. Downstream Customer Analysis
Table 19. Key Development Trends
Table 20. Driving Factors
Table 21. EWSE Market Challenges
Table 22. Global EWSE Sales by Type (K Units)
Table 23. Global EWSE Market Size by Type (M USD)
Table 24. Global EWSE Sales (K Units) by Type (2019-2025)
Table 25. Global EWSE Sales Market Share by Type (2019-2025)
Table 26. Global EWSE Market Size (M USD) by Type (2019-2025)
Table 27. Global EWSE Market Size Share by Type (2019-2025)
Table 28. Global EWSE Price (USD/Unit) by Type (2019-2025)
Table 29. Global EWSE Sales (K Units) by Application
Table 30. Global EWSE Market Size by Application
Table 31. Global EWSE Sales by Application (2019-2025) & (K Units)
Table 32. Global EWSE Sales Market Share by Application (2019-2025)
Table 33. Global EWSE Sales by Application (2019-2025) & (M USD)
Table 34. Global EWSE Market Share by Application (2019-2025)
Table 35. Global EWSE Sales Growth Rate by Application (2019-2025)
Table 36. Global EWSE Sales by Region (2019-2025) & (K Units)
Table 37. Global EWSE Sales Market Share by Region (2019-2025)
Table 38. North America EWSE Sales by Country (2019-2025) & (K Units)
Table 39. Europe EWSE Sales by Country (2019-2025) & (K Units)
Table 40. Asia Pacific EWSE Sales by Region (2019-2025) & (K Units)
Table 41. South America EWSE Sales by Country (2019-2025) & (K Units)
Table 42. Middle East and Africa EWSE Sales by Region (2019-2025) & (K Units)
Table 43. Global EWSE Production (K Units) by Region (2019-2025)
Table 44. Global EWSE Revenue (US$ Million) by Region (2019-2025)
Table 45. Global EWSE Revenue Market Share by Region (2019-2025)
Table 46. Global EWSE Production (K Units), Revenue (US$ Million), Price (USD/Unit) and Gross Margin (2019-2025)
Table 47. North America EWSE Production (K Units), Revenue (US$ Million), Price (USD/Unit) and Gross Margin (2019-2025)
Table 48. Europe EWSE Production (K Units), Revenue (US$ Million), Price (USD/Unit) and Gross Margin (2019-2025)
Table 49. Japan EWSE Production (K Units), Revenue (US$ Million), Price (USD/Unit) and Gross Margin (2019-2025)
Table 50. China EWSE Production (K Units), Revenue (US$ Million), Price (USD/Unit) and Gross Margin (2019-2025)
Table 51. Omnivision Technologies EWSE Basic Information
Table 52. Omnivision Technologies EWSE Product Overview
Table 53. Omnivision Technologies EWSE Sales (K Units), Revenue (M USD), Price (USD/Unit) and Gross Margin (2019-2025)
Table 54. Omnivision Technologies Business Overview
Table 55. Omnivision Technologies EWSE SWOT Analysis
Table 56. Omnivision Technologies Recent Developments
Table 57. Bae Systems EWSE Basic Information
Table 58. Bae Systems EWSE Product Overview
Table 59. Bae Systems EWSE Sales (K Units), Revenue (M USD), Price (USD/Unit) and Gross Margin (2019-2025)
Table 60. Bae Systems Business Overview
Table 61. Bae Systems EWSE SWOT Analysis
Table 62. Bae Systems Recent Developments
Table 63. Photonis EWSE Basic Information
Table 64. Photonis EWSE Product Overview
Table 65. Photonis EWSE Sales (K Units), Revenue (M USD), Price (USD/Unit) and Gross Margin (2019-2025)
Table 66. Photonis EWSE SWOT Analysis
Table 67. Photonis Business Overview
Table 68. Photonis Recent Developments
Table 69. Ams Ag EWSE Basic Information
Table 70. Ams Ag EWSE Product Overview
Table 71. Ams Ag EWSE Sales (K Units), Revenue (M USD), Price (USD/Unit) and Gross Margin (2019-2025)
Table 72. Ams Ag Business Overview
Table 73. Ams Ag Recent Developments
Table 74. Galaxycore EWSE Basic Information
Table 75. Galaxycore EWSE Product Overview
Table 76. Galaxycore EWSE Sales (K Units), Revenue (M USD), Price (USD/Unit) and Gross Margin (2019-2025)
Table 77. Galaxycore Business Overview
Table 78. Galaxycore Recent Developments
Table 79. On Semiconductor EWSE Basic Information
Table 80. On Semiconductor EWSE Product Overview
Table 81. On Semiconductor EWSE Sales (K Units), Revenue (M USD), Price (USD/Unit) and Gross Margin (2019-2025)
Table 82. On Semiconductor Business Overview
Table 83. On Semiconductor Recent Developments
Table 84. Pixelplus EWSE Basic Information
Table 85. Pixelplus EWSE Product Overview
Table 86. Pixelplus EWSE Sales (K Units), Revenue (M USD), Price (USD/Unit) and Gross Margin (2019-2025)
Table 87. Pixelplus Business Overview
Table 88. Pixelplus Recent Developments
Table 89. Pixart Imaging EWSE Basic Information
Table 90. Pixart Imaging EWSE Product Overview
Table 91. Pixart Imaging EWSE Sales (K Units), Revenue (M USD), Price (USD/Unit) and Gross Margin (2019-2025)
Table 92. Pixart Imaging Business Overview
Table 93. Pixart Imaging Recent Developments
Table 94. Global EWSE Sales Forecast by Region (2025-2032) & (K Units)
Table 95. Global EWSE Market Size Forecast by Region (2025-2032) & (M USD)
Table 96. North America EWSE Sales Forecast by Country (2025-2032) & (K Units)
Table 97. North America EWSE Market Size Forecast by Country (2025-2032) & (M USD)
Table 98. Europe EWSE Sales Forecast by Country (2025-2032) & (K Units)
Table 99. Europe EWSE Market Size Forecast by Country (2025-2032) & (M USD)
Table 100. Asia Pacific EWSE Sales Forecast by Region (2025-2032) & (K Units)
Table 101. Asia Pacific EWSE Market Size Forecast by Region (2025-2032) & (M USD)
Table 102. South America EWSE Sales Forecast by Country (2025-2032) & (K Units)
Table 103. South America EWSE Market Size Forecast by Country (2025-2032) & (M USD)
Table 104. Middle East and Africa EWSE Consumption Forecast by Country (2025-2032) & (Units)
Table 105. Middle East and Africa EWSE Market Size Forecast by Country (2025-2032) & (M USD)
Table 106. Global EWSE Sales Forecast by Type (2025-2032) & (K Units)
Table 107. Global EWSE Market Size Forecast by Type (2025-2032) & (M USD)
Table 108. Global EWSE Price Forecast by Type (2025-2032) & (USD/Unit)
Table 109. Global EWSE Sales (K Units) Forecast by Application (2025-2032)
Table 110. Global EWSE Market Size Forecast by Application (2025-2032) & (M USD)
List of Figures
Figure 1. Product Picture of EWSE
Figure 2. Data Triangulation
Figure 3. Key Caveats
Figure 4. Global EWSE Market Size (M USD), 2019-2032
Figure 5. Global EWSE Market Size (M USD) (2019-2032)
Figure 6. Global EWSE Sales (K Units) & (2019-2032)
Figure 7. Evaluation Matrix of Segment Market Development Potential (Type)
Figure 8. Evaluation Matrix of Segment Market Development Potential (Application)
Figure 9. Evaluation Matrix of Regional Market Development Potential
Figure 10. EWSE Market Size by Country (M USD)
Figure 11. EWSE Sales Share by Manufacturers in 2023
Figure 12. Global EWSE Revenue Share by Manufacturers in 2023
Figure 13. EWSE Market Share by Company Type (Tier 1, Tier 2 and Tier 3): 2023
Figure 14. Global Market EWSE Average Price (USD/Unit) of Key Manufacturers in 2023
Figure 15. The Global 5 and 10 Largest Players: Market Share by EWSE Revenue in 2023
Figure 16. Evaluation Matrix of Segment Market Development Potential (Type)
Figure 17. Global EWSE Market Share by Type
Figure 18. Sales Market Share of EWSE by Type (2019-2025)
Figure 19. Sales Market Share of EWSE by Type in 2023
Figure 20. Market Size Share of EWSE by Type (2019-2025)
Figure 21. Market Size Market Share of EWSE by Type in 2023
Figure 22. Evaluation Matrix of Segment Market Development Potential (Application)
Figure 23. Global EWSE Market Share by Application
Figure 24. Global EWSE Sales Market Share by Application (2019-2025)
Figure 25. Global EWSE Sales Market Share by Application in 2023
Figure 26. Global EWSE Market Share by Application (2019-2025)
Figure 27. Global EWSE Market Share by Application in 2023
Figure 28. Global EWSE Sales Growth Rate by Application (2019-2025)
Figure 29. Global EWSE Sales Market Share by Region (2019-2025)
Figure 30. North America EWSE Sales and Growth Rate (2019-2025) & (K Units)
Figure 31. North America EWSE Sales Market Share by Country in 2023
Figure 32. U.S. EWSE Sales and Growth Rate (2019-2025) & (K Units)
Figure 33. Canada EWSE Sales (K Units) and Growth Rate (2019-2025)
Figure 34. Mexico EWSE Sales (Units) and Growth Rate (2019-2025)
Figure 35. Europe EWSE Sales and Growth Rate (2019-2025) & (K Units)
Figure 36. Europe EWSE Sales Market Share by Country in 2023
Figure 37. Germany EWSE Sales and Growth Rate (2019-2025) & (K Units)
Figure 38. France EWSE Sales and Growth Rate (2019-2025) & (K Units)
Figure 39. U.K. EWSE Sales and Growth Rate (2019-2025) & (K Units)
Figure 40. Italy EWSE Sales and Growth Rate (2019-2025) & (K Units)
Figure 41. Russia EWSE Sales and Growth Rate (2019-2025) & (K Units)
Figure 42. Asia Pacific EWSE Sales and Growth Rate (K Units)
Figure 43. Asia Pacific EWSE Sales Market Share by Region in 2023
Figure 44. China EWSE Sales and Growth Rate (2019-2025) & (K Units)
Figure 45. Japan EWSE Sales and Growth Rate (2019-2025) & (K Units)
Figure 46. South Korea EWSE Sales and Growth Rate (2019-2025) & (K Units)
Figure 47. India EWSE Sales and Growth Rate (2019-2025) & (K Units)
Figure 48. Southeast Asia EWSE Sales and Growth Rate (2019-2025) & (K Units)
Figure 49. South America EWSE Sales and Growth Rate (K Units)
Figure 50. South America EWSE Sales Market Share by Country in 2023
Figure 51. Brazil EWSE Sales and Growth Rate (2019-2025) & (K Units)
Figure 52. Argentina EWSE Sales and Growth Rate (2019-2025) & (K Units)
Figure 53. Columbia EWSE Sales and Growth Rate (2019-2025) & (K Units)
Figure 54. Middle East and Africa EWSE Sales and Growth Rate (K Units)
Figure 55. Middle East and Africa EWSE Sales Market Share by Region in 2023
Figure 56. Saudi Arabia EWSE Sales and Growth Rate (2019-2025) & (K Units)
Figure 57. UAE EWSE Sales and Growth Rate (2019-2025) & (K Units)
Figure 58. Egypt EWSE Sales and Growth Rate (2019-2025) & (K Units)
Figure 59. Nigeria EWSE Sales and Growth Rate (2019-2025) & (K Units)
Figure 60. South Africa EWSE Sales and Growth Rate (2019-2025) & (K Units)
Figure 61. Global EWSE Production Market Share by Region (2019-2025)
Figure 62. North America EWSE Production (K Units) Growth Rate (2019-2025)
Figure 63. Europe EWSE Production (K Units) Growth Rate (2019-2025)
Figure 64. Japan EWSE Production (K Units) Growth Rate (2019-2025)
Figure 65. China EWSE Production (K Units) Growth Rate (2019-2025)
Figure 66. Global EWSE Sales Forecast by Volume (2019-2032) & (K Units)
Figure 67. Global EWSE Market Size Forecast by Value (2019-2032) & (M USD)
Figure 68. Global EWSE Sales Market Share Forecast by Type (2025-2032)
Figure 69. Global EWSE Market Share Forecast by Type (2025-2032)
Figure 70. Global EWSE Sales Forecast by Application (2025-2032)
Figure 71. Global EWSE Market Share Forecast by Application (2025-2032)