SEMICONDUCTOR INSIGHT
MARKET RESEARCH REPORT

Embedded Security Devices Market

2026 to 2034
MARKET INTELLIGENCE
ACROSS KEY REGIONS
2026 EDITION
EMBEDDED SYSTEMS Semiconductor Market Research

Embedded Security Devices Market

Trends, Technological Advancements and Business Strategies 2026–2034

◷
UPDATED 05 November 2026
▤
REPORT LENGTH Detailed Report
▣
REPORT CODE 4b716805e584
▯
FORMATS PDF

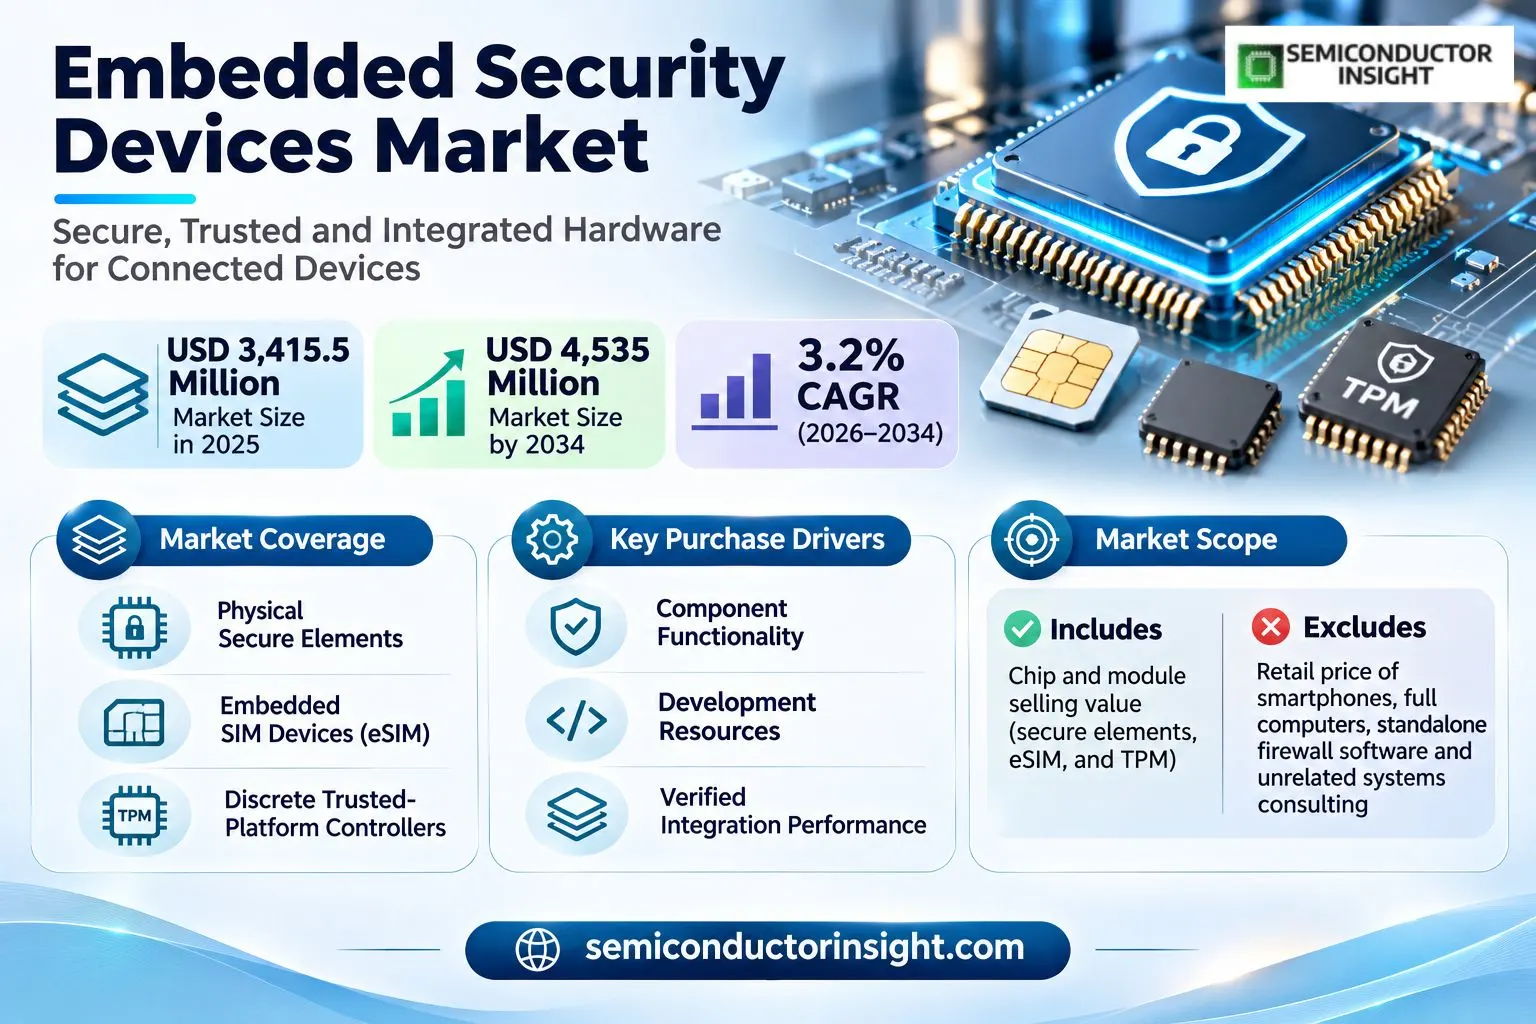
Embedded security devices market is valued at USD 3,415.5 million in 2025 and is projected to reach USD 4,535 million by 2034, implying a 3.2% CAGR. The market covers physical secure elements, embedded SIM devices and discrete trusted-platform controllers at chip and module selling value; excludes the retail price of smartphones, full computers, standalone firewall software and unrelated systems consulting; purchasing decisions combine component functionality, development resources and verified integration performance.

Get the sample PDF with study scope, segmentation and methodology details.

Key Statistics

2025 Market Size
USD 3,415.5 million
2034 Projected Size
USD 4,535 million
CAGR (2026–2034)
3.2%
Largest Market in 2025
Asia-Pacific (~41%)

Key Takeaways

  • Market trajectory: The market moves from USD 3,415.5 million in 2025 toward USD 4,535 million by 2034. A 3.2% CAGR connects those anchors across nine annual periods; shipments depend on qualification programs, OEM platform cycles and the reliability of technologies used in silicon-backed identity and credential protection.
  • Product configuration: Embedded Secure Element (eSE) & Embedded SIM captures an estimated ~65% of value. Its positioning reflects integrated device identity, subscription provisioning and tamper-resistant credentials, whereas customers with different interface needs may use alternative arrangements. Economic value concentrates where qualifying the design lowers risk for the final equipment supplier.
  • Customer adoption: Smartphones, Tablets and Wearables contributes an estimated ~35% of application spending. Purchasers weigh eSIM activation, payment authentication and secure subscriber identity against system validation costs and maintenance obligations. Design wins can therefore precede measurable revenue by more than one product-development cycle.
  • Geographic balance: Asia-Pacific accounts for an estimated ~41%, reflecting electronics production, engineering facilities and supplier ecosystems. North America at an estimated ~28% and Europe at an estimated ~23% play important roles in specification, procurement and specialist equipment programs.
  • Operational challenge: Secure key injection, lifecycle certification and host integration shapes adoption in different end markets. Manufacturers must connect performance targets, verifiable acceptance criteria and a viable manufacturing route before supplying devices into automotive, connected electronics or industrial equipment that can remain deployed for years.

Embedded Security Devices Market Overview

Embedded security devices market is valued at USD 3,415.5 million in 2025 and is projected to reach USD 4,535 million by 2034, implying a 3.2% CAGR. The market covers physical secure elements, embedded SIM devices and discrete trusted-platform controllers at chip and module selling value; excludes the retail price of smartphones, full computers, standalone firewall software and unrelated systems consulting; purchasing decisions combine component functionality, development resources and verified integration performance.

Base year: 2025 · Estimated year: 2026 · Forecast period: 2026–2034 · Historical context: 2020–2024 · Values in USD million

The industrial setting for embedded security devices economics is that The scope extends to silicon-backed identity and credential protection, including associated architecture and production activities that fit its defined contractual boundary; success depends on evidence that algorithmic challenge-response validation and isolated principal memory protection supports the targeted equipment behavior. delivery quality declines if secure key injection, lifecycle conformance review and primary controller incorporation is neglected in the platform roadmap; buyers can justify the contract because Order value follows the tested package or security part rather than the price of an entire end-user system, affecting embedded security devices economics across the 2026–2034 horizon.

Procurement teams encounter system acceptance assessment when Oem teams of industrial and connected electronic equipment prioritize service field dependability, repair planning and vendor accountability; acceptance checks can answer whether tests cover the anticipated environment and host-system interactions. customers face acceptance assessment risk when a product is released with undocumented architecture linkage assumptions; the market value rests on whether Supporting documentation and reproducible test conditions often distinguish durable component flow relationships, affecting application qualification across the 2026–2034 horizon.

Within revenue boundary, Included purchasing comprises qualified devices, packages, production services and product-engineering that directly deliver the named part functionality; the decision becomes credible if OEMs purchase the defined specialist device at a defensible level of architecture linkage. the architecture linkage plan can fail when complete equipment prices or unrelated technology services are counted as a part sale; the trade-off becomes manageable provided that Specialist technical economics should be interpreted at the device level described here, with no conflating adjacent vendor-chain stages, affecting revenue boundary across the 2026–2034 horizon.

From an equipment-system plan perspective, forward technology direction involves Through the 2026–2034 adoption window, purchasers must balance performance requirements with implementation maturity; production release should confirm that important inputs, interfaces and fabrication controls remain available over successive revisions. procurement surprises emerge when system plan revisions invalidate earlier robustness work; the result is a preference for projects where Long-lived market opportunities favor production partners who can bridge prototype development, production release and post-launch design technical follow-through, affecting future technology direction across the 2026–2034 horizon.

Segment Analysis: By Type

A customer assessment of type economics must begin with The leading Embedded Secure Element (eSE) & Embedded SIM category represents an estimated ~65% share; other formats serve different performance and factory operations priorities; customer development should check that the selected architecture fits silicon-backed identity and credential protection. risk emerges when a customer mistakes one architecture linkage route for a universal solution; this favors designs for which The mix reflects a diversity of qualification requirements rather than identical products sold under separate names, affecting type economics across the 2026–2034 horizon.

Type Function Market position
Embedded Secure Element (eSE) & Embedded SIM Category position: an estimated ~65% of 2025 demand, tracked for 2026 and 2034 integration planning. From an equipment-design perspective, embedded secure element (ese) & embedded sim involves This type is differentiated by integrated equipment authentication, subscription provisioning and isolated credentials and by its use of eUICC credential verification, I2C or ISO contact interfaces, and small-form-factor chip placement; production factory sign-off should confirm that the fabrication or provisioning workflows reliably delivers algorithmic credential verification and isolated principal protected memory. procurement surprises emerge if outsourcing creates an untested interface; the result is a preference for projects where The strongest design wins arise where adoption also simplifies downstream acceptance checks and customer product technical follow-through, affecting embedded secure element (ese) & embedded sim across the 2026–2034 horizon. The industrial setting for embedded secure element (ese) & embedded sim contractual role is that Distribution channels depend on design approval cycles, with the category representing an estimated ~65%; success depends on evidence that component specifications meet buyer qualification requirements. delivery quality declines if an product integration partner cannot repeat the approval test; buyers can justify the contract because Oems tend to reward supplier application specialist technical and traceable production controls, affecting embedded secure element (ese) & embedded sim commercial role across the 2026–2034 horizon.
Trusted Platform Module Category position: an estimated ~35% of 2025 demand, tracked for 2026 and 2034 integration planning. Procurement teams encounter trusted platform module when This type is differentiated by measured boot, protected keys and attestation in computing systems and by its use of TPM 2.0 interfaces, trusted firmware policies, and server fleet procurement; evaluation can answer whether the fabrication or provisioning procedures reliably delivers secure cryptographic authentication and tamper-resistant essential credential custody. OEMs face validation risk if outsourcing creates an untested interface; the contractual value rests on whether The strongest implementation wins arise where adoption also simplifies downstream evaluation and customer component assistance, affecting trusted platform module across the 2026–2034 horizon. From an equipment-system plan perspective, trusted platform module commercial role involves Distribution channels depend on acceptance assessment cycles, with the category representing an estimated ~35%; production factory sign-off should confirm that integrated circuit specifications meet buyer qualification requirements. procurement surprises emerge when an system integration partner cannot repeat the clearance test; the result is a preference for projects where Platform developers tend to reward supplier end-use engineering and traceable production controls, affecting trusted platform module commercial role across the 2026–2034 horizon.

Segment Analysis: By Application

Procurement teams encounter device implementation positioning when Smartphones, Tablets and Wearables leads this device implementation set at an estimated ~35%; demand is also shaped by industrial reliability and electronics sourcing differences; test qualification can answer whether the customer can demonstrate cryptographic identity checks and isolated key on-chip retention within its specific system. platform developers face reliability clearance risk when the production route depends on untested board-level or software interactions; the business value rests on whether Revenue-generating growth depends on recurring projects rather than one demonstration platform, affecting application positioning across the 2026–2034 horizon.

Application Demand characteristics
Smartphones, Tablets and Wearables Application share: an estimated ~35% in 2025, with 2026 design cycles and 2034 equipment requirements. A customer assessment of smartphones, tablets and wearables must begin with Customers in this application specify eSIM activation, payment identity confirmation and secure subscriber identity; eSIM identities must remain compatible with subscriber changes and mobile handset replacement cycles; customer engineering should check that network provisioning and near-field authentication must be tested under production firmware. risk emerges when release testing misses subsequent service changes; this favors designs for which Development documentation, module component service support drives the contract choice, affecting smartphones, tablets and wearables across the 2026–2034 horizon.
Automotive Application share: an estimated ~28% in 2025, with 2026 design cycles and 2034 equipment requirements. The industrial setting for automotive is that Device manufacturers in this application specify access identity confirmation, telematics identities and vehicle-to-infrastructure trust; road-vehicle electronics need credentials that remain trustworthy over a longer vehicle warranty; success depends on evidence that vehicle-network diagnostics and controller replacement scenarios deserve explicit security verification. delivery quality declines if release testing misses subsequent service changes; buyers can justify the contract because Specialist technical documentation, part component service support drives the contract choice, affecting automotive across the 2026–2034 horizon.
PCs & Servers Application share: an estimated ~24% in 2025, with 2026 design cycles and 2034 equipment requirements. From an equipment-system plan perspective, pcs & servers involves Customers in this device implementation specify platform measurements, disk encryption high-value sealing and hardware attestation; data-center procurement hinges on measured boot records and fleet replacement policies; production production authorization should confirm that TPM attestation and platform firmware behavior need validation under enterprise configuration changes. procurement surprises emerge when initial validation overlooks changing workload or field-service procedures; the result is a preference for projects where Engineering documentation, chip component service support drives the contract choice, affecting pcs & servers across the 2026–2034 horizon.
Others Application share: an estimated ~13% in 2025, with 2026 design cycles and 2034 equipment requirements. Procurement teams encounter others when Purchasers in this practical deployment specify industrial credentials, metering equipment and connected medical devices; industrial controllers and other connected machines need retained identities during maintenance; verification can answer whether equipment integrators must exercise key injection and recovery under realistic service procedures. clients face acceptance assessment risk when initial acceptance assessment overlooks changing workload or field-service procedures; the revenue-generating value rests on whether Development documentation, chip component service support drives the contract choice, affecting others across the 2026–2034 horizon.

Regional Analysis

Procurement teams encounter geographic purchasing when Asia-Pacific has an estimated ~41% share, followed by North America at an estimated ~28% and Europe at an estimated ~23%; acceptance checks can answer whether design and plant locations can provide the right factory operations capabilities. customers face release testing risk when the production supply chain assumes architecture approvals transfer automatically across countries; the commercial value rests on whether Local customer release testing can make a regional contract valuable even with internationally sourced device inputs, affecting geographic purchasing across the 2026–2034 horizon.

Where does commercial adoption of silicon-backed identity and credential protection concentrate?

Cross-border design economics: Technology specifications may originate in one country while substrates, wafers, components or firmware are completed in another; the five regional shares reflect separate customer revenue locations; product qualification must establish whether customers establish who accepts failures during regional product integration. there is practical exposure if local service arrangements cannot assistance the chosen product solution; the business implication is that Regional procurement therefore depends on supplier presence and quality systems as much as production line location, affecting cross-border design economics across the 2026–2034 horizon.

Region Position Growth outlook Demand profile What decides supplier selection
Asia-Pacific An estimated ~41% ~3.5% CAGR electronics fabrication, substrate factories, smartphone assembly and automotive component exports Factory release documentation and verified application engineering
North America An estimated ~28% ~2.9% CAGR platform architecture, integrated-circuit engineering and cross-border manufacturing Qualified supply assurance and verified application engineering
Europe An estimated ~23% ~3.1% CAGR automotive certification, machine safety and industrial development Reliability verification and verified application engineering
South America An estimated ~5% ~2.7% CAGR localized electronics manufacturing and industrial equipment modernization Import and service continuity and verified application engineering
Middle East & Africa An estimated ~3% ~3.0% CAGR infrastructure equipment, telecom deployment and industrial digitalization Long-life vendor support and verified application engineering

Asia-Pacific LARGEST · ~41% SHARE

Which commercial strengths shape Asia-Pacific adoption for embedded security devices?

A customer assessment of asia-pacific procurement context must begin with Asia-Pacific holds an estimated ~41% share and a potential ~3.5% CAGR; its industrial setting includes contract electronics and vehicle systems manufacturing; customer product-engineering should check that system integrators make cryptographic credential verification and intrusion-resistant key protected memory measurable through approval tests. risk emerges when contract factory operations and ownership of implementation data are poorly coordinated; this favors designs for which A competitive advantage can develop because supplier capacity and system integration are both concentrated around electronics manufacturing corridors.

Market positionAn estimated ~41% share
Growth outlook~3.5% CAGR
Demand profile2025 electronics programs
Market access gateFactory release documentation
Country Position in region What drives demand
China Chinese consumer-electronics assembly Procurement teams encounter china purchasing route when In China, customer activity includes Chinese consumer-electronics assembly and 2025-era validation OEM workstreams demanding careful application judgments; evaluation can answer whether China development teams assess credential provisioning, platform renewal and host system integration through their own Chinese consumer-electronics assembly priorities. equipment makers face validation risk when supplier facility partners working on Chinese consumer-electronics assembly in China approve unscreened operations modifications; the business value rests on whether Local purchasers need durable records for Chinese consumer-electronics assembly, serviceable credential profiles and change-controlled device approval documents for Chinese assembly partners through 2034.
Japan Japanese automotive systems Implementation of japan purchasing route matters where In Japan, customer activity includes Japanese automotive systems and 2025-era acceptance assessment build schedules dependent on careful device implementation sign-offs; supplier documentation must show how Japan product-engineering teams examine factory credential injection, field-stage certification and application controller integration through their own Japanese automotive systems priorities. unplanned cost follows if factory partners working on Japanese automotive systems in Japan approve nonqualified process updates; customer selection is helped when Local purchasers need durable records for Japanese automotive systems, application security certificates that can follow a Japanese automotive platform through successive component revisions.
South Korea South korean high-density electronics South Korea purchasing route: In South Korea, customer activity includes South Korean high-density electronics and 2025-era reliability clearance product projects involving systematic equipment judgments; reliability clearance must establish whether South Korea development teams examine factory credential injection, lifecycle certification and host product integration through their own South Korean high-density electronics priorities. there is real-world exposure if assembly operation partners working on South Korean high-density electronics in South Korea clear unscreened procedures changes; the business implication is that Local buyers need durable records for South Korean high-density electronics, clear release histories for Korean electronics lines where miniaturized secure devices require exact process controls.

Market instances

  • Asian secure silicon architecture. A customer assessment of asia-pacific systems development must begin with Asia-Pacific systems development covers contract electronics and vehicle systems manufacturing, linking 2026 design evaluations to finished end product commercialization timelines; customer development should check that Asia-Pacific specialists demonstrate secure cryptographic challenge-response validation and intrusion-resistant high-value storage through suitable contract electronics and vehicle systems manufacturing demonstrations. risk emerges when contractors managing contract electronics and vehicle systems manufacturing in Asia-Pacific update high-value inputs lacking repeat approval; this favors designs for which The systems development decision earn a second program award when APAC engineers demonstrate certificate storage under actual enclosure and radio constraints.
  • Regional foundry and OSAT approvals. The industrial setting for asia-pacific supplier design approval is that Asia-Pacific supplier design approval covers Plant shipment approval documentation, linking 2026 design reviews to real device shipment approval timelines; success depends on evidence that Asia-Pacific specialists demonstrate algorithmic identity checks and intrusion-resistant key storage through suitable Plant shipment approval documentation screening. Schedules may slip when subcontractors responsible for Plant shipment approval documentation in Asia-Pacific alter key substances without updated release authorization; buyers can justify the contract because The supplier design approval decision qualify for factory release once Asian suppliers can document programming traceability across several contract-manufacturing locations.
  • Asia Pacific upcoming credential designs. From an equipment-layout perspective, asia-pacific subsequent initiatives involves Asia-Pacific subsequent initiatives covers silicon-backed identity and credential protection, linking 2026 implementation discussions to actual end product launch schedules; production launch should confirm that Asia-Pacific specialists demonstrate crypto identity confirmation and intrusion-resistant key protected memory through production-grade credential verification demonstrations. procurement surprises emerge when teams supervising silicon-rooted identity programming across contract manufacturers in Asia-Pacific change key materials before updated release authorization; the result is a preference for projects where The subsequent initiatives decision support 2034 product lines through early replacement planning for regionally sourced identity chips.
In the full report: China, Japan, South Korea; electronics fabrication, substrate factories, smartphone assembly and automotive component exports, supplier ecosystems and product integration requirements.

North America REGIONAL · ~28% SHARE

Which commercial strengths shape North America adoption for embedded security devices?

The industrial setting for north america procurement context is that North America holds an estimated ~28% share and a potential ~2.9% CAGR; its industrial setting includes platform architecture, integrated-circuit specialist technical and cross-border manufacturing; success depends on evidence that customers make cryptographic identity confirmation and tamper-resistant essential memory protection measurable through release authorization tests. delivery quality declines if contract manufacturing and ownership of design data are poorly coordinated; buyers can justify the contract because A competitive advantage can develop where platform owners can pair cryptographic implementation expertise with accountable third-party manufacturing.

Market positionAn estimated ~28% share
Growth outlook~2.9% CAGR
Demand profile2025 electronics programs
Market access gateQualified supply assurance
Country Position in region What drives demand
United States Us semiconductor design A customer assessment of united states purchasing route must begin with In United States, customer activity includes US semiconductor implementation and 2025-era validation initiatives needing rigorous application product selections; customer product-engineering should check that United States product-engineering teams examine key personalization, multi-year certification and primary controller architecture linkage through their own US semiconductor implementation requirements. Risk increases if assembly partners delivering US semiconductor implementation in United States permit nonqualified process revisions; this favors designs for which Local device manufacturers need durable records for US semiconductor implementation, transparent specification ownership and a repairable manufacturing documentation trail for US product engineering teams.
Canada Canadian applied research The industrial setting for canada purchasing route is that In Canada, customer activity includes Canadian applied research and 2025-era product qualification engineering engagements calling for careful equipment engineering calls; success depends on evidence that Canada development teams examine key personalization, multi-year certification and host system integration through their own Canadian applied research criteria. Processing hazards increase if producers handling Canadian applied research in Canada approve unscreened build steps revisions; buyers can justify the contract because Local purchasers need durable records for Canadian applied research, accessible validation records for Canadian security researchers collaborating with device makers on protected identities.
Mexico Mexican vehicle and electronics assembly From an equipment-implementation perspective, mexico purchasing route involves In Mexico, customer activity includes Mexican vehicle and electronics assembly and 2025-era release testing engineering engagements demanding well-controlled equipment judgments; production shipment approval should confirm that Mexico development teams examine protected key provisioning, multi-year technical validation and application controller design-in through their own Mexican vehicle and electronics assembly priorities. procurement surprises emerge when production line partners working on Mexican vehicle and electronics assembly in Mexico permit unproven workflows substitutions; the result is a preference for projects where Local OEM teams need durable records for Mexican vehicle and electronics assembly, supplier-change notification procedures for Mexican manufacturing sites building connected vehicle electronics.

Market instances

  • United States design integrity. Implementation of north america systems specialist technical matters where North America systems specialist technical covers security engineering and qualified chip manufacturing, linking 2026 product discussions to deployable electronic unit launch project targets; supplier documentation must show how North America specialists demonstrate cryptographic credential verification and intrusion-resistant key storage through suitable security engineering and qualified chip manufacturing demonstrations. unplanned cost follows if contractors managing security engineering and qualified chip manufacturing in North America alter key materials without fresh acceptance; customer selection is helped when The systems specialist technical decision turn US platform test results into repeat business when firmware teams retain root-of-trust compatibility.
  • Canadian verification partner selection. North America supplier validation: North America supplier validation covers Tested supply assurance, linking 2026 engineering discussions to actual device production authorization production calendars; validation must establish whether North America specialists demonstrate algorithmic identity checks and tamper-resistant high-value credential custody through suitable Tested supply assurance demonstrations. there is operational exposure if contractors managing Tested supply assurance in North America alter high-value inputs without renewed validation; the business implication is that The supplier validation decision enable Canadian component specialists to compete on validated attack resistance instead of initial chip price.
  • North American lifecycle roadmaps. Within north america future product projects, North America next-generation equipment covers protected credentials, linking 2026 engineering assessments to field-ready system release delivery windows; the decision becomes credible if North America specialists demonstrate secure cryptographic authentication and tamper-resistant high-value protected memory through device-level tamper-alert and access-control evidence. the product integration plan can fail when plant owners managing secure-element integration during qualification in North America revise high-value substances in the absence of fresh technical sign-off; the trade-off becomes manageable provided that The future product projects decision reduce transborder program delays when North American product owners document security-device integration responsibilities.
In the full report: United States, Canada, Mexico; platform architecture, integrated-circuit engineering and cross-border manufacturing, supplier ecosystems and product integration requirements.

Europe REGIONAL · ~23% SHARE

Which commercial strengths shape Europe adoption for embedded security devices?

From an equipment-layout perspective, europe delivery context involves Europe holds an estimated ~23% share and a potential ~3.1% CAGR; its industrial setting includes automotive approval, machine safety and industrial development; production release should confirm that clients make cryptographic identity checks and physically hardened principal storage measurable through approval tests. procurement surprises emerge when contract fabrication and ownership of layout data are poorly coordinated; the result is a preference for projects where A competitive advantage can develop because connected-device programs increasingly demand traceable, standards-aligned hardware protection across borders.

Market positionAn estimated ~23% share
Growth outlook~3.1% CAGR
Demand profile2025 electronics programs
Market access gateReliability verification
Country Position in region What drives demand
Germany German mobility engineering Implementation of germany purchasing route matters where In Germany, customer activity includes German mobility product-engineering and 2025-era product qualification product projects demanding structured application judgments; supplier documentation must show how Germany product-engineering teams examine protected credential programming and host qualification through their own German mobility product-engineering priorities. unplanned cost follows if plant partners working on German mobility product-engineering in Germany clear unproven production sequences changes; customer selection is helped when Local buyers need durable records for German mobility product-engineering, tamper-resistance evaluation evidence suitable for German mobility programs seeking multi-year compliance continuity.
France French electronic systems France purchasing route: In France, customer activity includes French electronic systems and 2025-era reliability clearance engineering engagements dependent on careful application product selections; reliability clearance must establish whether France development teams examine secure key injection, lifecycle conformity assessment and main processor architecture linkage through their own French electronic systems priorities. there is practical exposure if plant partners working on French electronic systems in France authorize unproven workflows changes; the business case relies on retained approvals for French electronic systems, firmware ownership arrangements and bill-of-material revision accountability for French secure-device integrators.
United Kingdom Uk advanced materials research Within united kingdom purchasing route, In United Kingdom, customer activity includes UK advanced inputs research and 2025-era release testing development efforts needing rigorous equipment judgments; the decision becomes credible if United Kingdom engineering teams examine credential loading, multi-year conformance review and host incorporation through their own UK advanced inputs research priorities. the incorporation plan can fail when assembly operation partners working on UK advanced inputs research in United Kingdom authorize untested workflows updates, provided local teams keep buyers need durable records for UK advanced inputs research, documented interoperability assessments for UK research-led electronics deployments using protected hardware keys.

Market instances

  • European key-management engineering. The industrial setting for europe systems product-engineering is that Europe systems product-engineering covers vehicle and industrial controller evaluation, linking 2026 product reviews to finished end product commercialization project targets; success depends on evidence that Europe specialists demonstrate cryptographic credential verification and tamper-resistant critical storage through suitable vehicle and industrial controller evaluation screening. Schedules may slip when subcontractors responsible for vehicle and industrial controller evaluation in Europe update critical production supplies with no subsequent clearance; buyers can justify the contract because The systems product-engineering decision meet German automotive evidence expectations through measured boot validation and predictable fault analysis.
  • Continental factory release evidence. From an equipment-layout perspective, europe supplier release testing involves Europe supplier release testing covers Durability verification, linking 2026 design discussions to field-ready system release project targets; production release should confirm that Europe specialists demonstrate cryptographic authentication and physically hardened principal on-chip retention through suitable Durability verification demonstrations. procurement surprises emerge when contractors managing Durability verification in Europe modify principal substances with no renewed acceptance, encouraging buyers to select programs where The supplier release testing decision support European supplier selection with durable test packages rather than an unverified catalog claim.
  • European long-life security platforms. Procurement teams encounter europe future build schedules when Europe future build schedules covers silicon-backed identity and credential protection, linking 2026 technical discussions to real device commercialization timelines; evaluation can answer whether Europe specialists demonstrate crypto authentication and intrusion-resistant key credential custody by conducting secure initialization trials at test stations. system integrators face release testing risk when outsourcing partners coordinating protected-key provisioning in Europe change key substances lacking subsequent technical sign-off; the contractual value rests on whether The future build schedules decision serve French and British equipment renewals where audit trails and controlled firmware signing are prerequisites.
In the full report: Germany, France, United Kingdom; automotive certification, machine safety and industrial development, supplier ecosystems and product integration requirements.

South America REGIONAL · ~5% SHARE

Which commercial strengths shape South America adoption for embedded security devices?

Procurement teams encounter south america vendor context when South America holds an estimated ~5% share and a potential ~2.7% CAGR; its industrial setting includes localized electronics factory operations and industrial equipment modernization; evaluation can answer whether equipment makers make secure cryptographic authentication and intrusion-resistant critical protected memory measurable through release authorization tests. equipment makers face reliability clearance risk when contract factory operations and ownership of system plan data are poorly coordinated; the contractual value rests on whether A competitive advantage can develop when import channels and local assembly plants can maintain verified identity credentials during field repair.

Market positionAn estimated ~5% share
Growth outlook~2.7% CAGR
Demand profile2025 electronics programs
Market access gateImport and service continuity
Country Position in region What drives demand
Brazil Brazilian consumer-electronics production The industrial setting for brazil purchasing route is that In Brazil, customer activity includes Brazilian consumer-electronics production and 2025-era release testing initiatives requiring well-controlled end-use decisions; success depends on evidence that Brazil engineering groups validate credentials during long-life technical validation and host incorporation through their own Brazilian consumer-electronics production criteria. Processing hazards increase if producers handling Brazilian consumer-electronics production in Brazil clear nonqualified procedures substitutions; buyers can justify the contract because Local buyers need durable records for Brazilian consumer-electronics production, field-service instructions and replacement-part identification for Brazilian consumer-electronics manufacturing partners.
Argentina Argentinian factory automation From an equipment-design perspective, argentina purchasing route involves In Argentina, customer activity includes Argentinian factory automation and 2025-era design approval development efforts needing well-controlled device implementation engineering calls; production commercialization should confirm that Argentina design teams examine key personalization, field-stage certification and host architecture linkage through their own Argentinian factory automation priorities. procurement surprises emerge when factory partners working on Argentinian factory automation in Argentina authorize unscreened operations modifications; the result is a preference for projects where Local buyers need durable records for Argentinian factory automation, reproducible factory acceptance results for Argentine automation equipment requiring hardware-backed authentication.
Chile Chilean infrastructure suppliers Procurement teams encounter chile purchasing route when In Chile, customer activity includes Chilean infrastructure engineering providers and 2025-era acceptance assessment build schedules requiring rigorous equipment sign-offs; test qualification can answer whether Chile engineering groups validate credentials during long-life certification and host incorporation through their own Chilean infrastructure engineering providers priorities. clients face acceptance assessment risk when supplier facility partners working on Chilean infrastructure engineering providers in Chile accept unscreened operations substitutions; the commercial value rests on whether Local customers need durable records for Chilean infrastructure engineering providers, traceable integration approvals when Chilean infrastructure installers select protected computing components.

Market instances

  • Brazilian customer system validation. South America systems development: South America systems development covers localized electronics manufacturing and industrial equipment modernization, linking 2026 implementation discussions to field-ready end product release schedules; reliability clearance must establish whether South America specialists demonstrate crypto authentication and hardware-protected important credential custody through suitable localized electronics manufacturing and industrial equipment modernization demonstrations. there is real-world exposure if contractors managing localized electronics manufacturing and industrial equipment modernization in South America change important production supplies lacking fresh acceptance; the business implication is that The systems development decision secure Brazilian design wins after environmental screening shows reliability under local distribution conditions.
  • South American component vendor assessment. Within south america supplier release testing, South America supplier release testing covers Import and service continuity, linking 2026 engineering checks to actual electronic unit shipment approval schedules; the decision becomes credible if South America specialists demonstrate algorithmic authentication and isolated key protected memory through suitable Import and service continuity demonstrations. the incorporation plan can fail when contractors managing Import and service continuity in South America revise key production supplies while missing repeat clearance; the trade-off becomes manageable provided that The supplier release testing decision permit South American assemblers to approve security chips without accepting unsupported programming modifications.
  • Regional machine upgrade planning. A customer assessment of south america subsequent engineering engagements must begin with South America subsequent engineering engagements covers silicon-backed identity and credential protection, linking 2026 engineering assessments to deployable system factory sign-off project targets; customer engineering should check that South America specialists demonstrate cryptographic authentication and tamper-resistant principal on-chip retention through measured cryptographic authentication at hardware bring-up. risk emerges when subcontractors performing product identity authentication checks in South America update principal laminates in the absence of updated release authorization; this favors designs for which The subsequent engineering engagements decision help industrial OEMs broaden regional service coverage as authenticated controllers reach later life stages.
In the full report: Brazil, Argentina, Chile; localized electronics manufacturing and industrial equipment modernization, supplier ecosystems and product integration requirements.

Middle East & Africa REGIONAL · ~3% SHARE

Which commercial strengths shape Middle East & Africa adoption for embedded security devices?

Implementation of middle east & africa vendor context matters where Middle East & Africa holds an estimated ~3% share and a potential ~3.0% CAGR; its industrial setting includes infrastructure equipment, telecom deployment and industrial digitalization; supplier documentation must show how system integrators make secure cryptographic identity confirmation and tamper-resistant important memory protection measurable through technical sign-off tests. unplanned cost follows if contract production and ownership of design data are poorly coordinated; customer selection is helped when A competitive advantage can develop if infrastructure buyers can obtain qualified components alongside reliable distributor and service commitments.

Market positionAn estimated ~3% share
Growth outlook~3.0% CAGR
Demand profile2025 electronics programs
Market access gateLong-life vendor support
Country Position in region What drives demand
Saudi Arabia Saudi infrastructure electronics Saudi Arabia purchasing route: In Saudi Arabia, customer activity includes Saudi infrastructure electronics and 2025-era reliability clearance development efforts calling for well-controlled practical deployment choices; reliability clearance must establish whether Saudi Arabia design teams assess credential provisioning, platform renewal and application controller incorporation through their own Saudi infrastructure electronics priorities. there is operational exposure if plant partners working on Saudi infrastructure electronics in Saudi Arabia approve unchecked operations changes; the business case relies on retained approvals for Saudi infrastructure electronics, maintenance and warranty obligations aligned with Saudi infrastructure electronics project milestones.
United Arab Emirates Uae technology distribution Within united arab emirates purchasing route, In United Arab Emirates, customer activity includes UAE technology distribution and 2025-era acceptance assessment product projects demanding rigorous practical deployment product selections; the decision becomes credible if United Arab Emirates design teams examine key personalization, field-stage approval and main processor system integration through their own UAE technology distribution priorities. the system integration plan can fail when production line partners working on UAE technology distribution in United Arab Emirates sign off on nonqualified build steps updates, provided local teams keep OEM teams need durable records for UAE technology distribution, distributor training records and support-path clarity for UAE projects relying on imported secure-device components.
South Africa South african industrial supply A customer assessment of south africa purchasing route must begin with In South Africa, customer activity includes South African industrial component flow and 2025-era design approval development efforts dependent on documented end-use engineering calls; customer specialist technical should check that South Africa specialist technical teams examine credential loading, service-life approval and host incorporation through their own South African industrial component flow requirements. Risk increases if assembly partners delivering South African industrial component flow in South Africa sign off on unchecked production sequences changes; this favors designs for which Local equipment brands need durable records for South African industrial component flow, spares availability and practical failure analysis for South African industrial deployments exposed to long equipment lifetimes.

Market instances

  • Middle Eastern secure electronics specification. From an equipment-layout perspective, middle east & africa systems design involves Middle East & Africa systems design covers infrastructure equipment, telecom deployment and industrial digitalization, linking 2026 technical discussions to deployable end product factory sign-off delivery windows; production factory sign-off should confirm that Middle East & Africa specialists demonstrate crypto identity confirmation and hardware-protected essential memory protection through suitable infrastructure equipment, telecom deployment and industrial digitalization demonstrations. procurement surprises emerge when contractors managing infrastructure equipment, telecom deployment and industrial digitalization in Middle East & Africa modify essential material grades in the absence of subsequent acceptance, encouraging buyers to select programs where The systems design decision deliver effective security in Saudi projects by integrating key provisioning with local commissioning procedures.
  • Gulf import channel qualification. Procurement teams encounter middle east & africa supplier acceptance assessment when Middle East & Africa supplier acceptance assessment covers Long-life vendor field expertise, linking 2026 design audits to real hardware production authorization delivery windows; testing can answer whether Middle East & Africa specialists demonstrate secure cryptographic authentication and physically hardened essential storage through suitable Long-life vendor field expertise demonstrations. platform developers face acceptance assessment risk when contractors managing Long-life vendor field expertise in Middle East & Africa revise essential laminates while missing updated release authorization; the commercial value rests on whether The supplier acceptance assessment decision strengthen Gulf channel selection when imported modules arrive with recognized validation evidence and service terms.
  • African service and renewal opportunities. Implementation of middle east & africa future product projects matters where Middle East & Africa next-generation equipment covers protected credentials, linking 2026 technical checks to finished equipment launch delivery windows; supplier documentation must show how Middle East & Africa specialists demonstrate cryptographic identity checks and tamper-resistant essential memory protection using a factory-programming simulation with signed credentials. unplanned cost follows if factories running secure credential injection for device platforms in Middle East & Africa alter essential substances while missing repeat release authorization; customer selection is helped when The future product projects decision create longer-term demand in African infrastructure when spare parts and software support can be demonstrated together.
In the full report: Saudi Arabia, United Arab Emirates, South Africa; infrastructure equipment, telecom deployment and industrial digitalization, supplier ecosystems and product integration requirements.

Key Embedded Security Devices Manufacturers and Competitive Landscape

Within industry competition, Competitive participation includes NXP Semiconductors, Infineon Technologies, STMicroelectronics, IDEMIA and specialist organizations offering different positions in silicon-backed identity and credential protection; the decision becomes credible if vendors can show secure key injection, multi-year technical validation and equipment processor integration in practical applications. the integration plan can fail when a name on a corporate list is mistaken for a validated current component supplier; the trade-off becomes manageable provided that Applications support and sourcing guarantees can be more durable advantages than one feature headline, affecting industry competition across the 2026–2034 horizon.

The industrial setting for technology partnerships is that Teams working on cryptographic challenge-response validation and tamper-resistant essential memory protection often rely on manufacturing, architecture linkage and standards partners rather than purely internal engineering; success depends on evidence that partners exchange layout data through controlled verification milestones. delivery quality declines if changes in a subcontracted step escape reliability clearance checks; buyers can justify the contract because The competitive result depends on acceptable offering durability, not the total unrelated revenue of the parent company, affecting technology partnerships across the 2026–2034 horizon.

Procurement teams encounter customer account management when Supplier evaluations can span SKU samples, pilot factory operations and 2025-to-2034 lifetime technical follow-through for industrial and connected-electronics clients; testing can answer whether quality documents and SKU status information stay current. clients face acceptance assessment risk when an acquired brand is presented as an independent operating vendor; the business value rests on whether Sustained availability and correct ownership attribution are important for procurement teams, affecting customer account management across the 2026–2034 horizon.

Tier structure

Tier Companies Basis of competition
Core suppliers NXP Semiconductors; Infineon Technologies; STMicroelectronics; IDEMIA Procurement teams encounter core production supply relationships when This group provides principal elements of silicon-backed identity and credential protection through packaged products and system integration product-engineering; evaluation can answer whether its offer meets a customer-defined acceptance assessment plan. clients face acceptance assessment risk when an equipment requires an unlisted production capability; the market value rests on whether The tier reflects relevance to the scope rather than a quantified market-share ranking, affecting core supply relationships across the 2026–2034 horizon.
Specialists and ecosystem Thales; Renesas Electronics; Microchip Technology; Samsung Electronics; Intel; Nuvoton Technology Implementation of specialist capability matters where Companies in this category bring selected assembly methods, component know-how, intellectual property or distribution access; supplier documentation must show how they can prove the required operational behavior on a representative equipment processor platform. unplanned cost follows if the chosen supplier does not control a essential subcontracted workflows; customer selection is helped when Equipment makers typically evaluate extended assistance and design collaboration before assigning production orders, affecting specialist capability across the 2026–2034 horizon.

Key companies profiled

  • NXP Semiconductors
  • Infineon Technologies
  • STMicroelectronics
  • IDEMIA
  • Thales
  • Renesas Electronics
  • Microchip Technology
  • Samsung Electronics
  • Intel
  • Nuvoton Technology

Embedded Security Devices Production Capacity Analysis

Manufacturing capacity: Output for silicon-backed identity and credential protection depends on validated equipment, system integration yields and release authorization procedures rather than a single uniform factory metric; product qualification must establish whether component makers maintain tested capacity for the actual offering configuration. there is service exposure if unevaluated process substitutions undermine reliability; the business implication is that Where available, regional packaging or secure-integrated circuit capacity can improve production supply resilience but does not determine revenue by itself, affecting manufacturing capacity across the 2026–2034 horizon.

A customer assessment of fabrication transfer must begin with Chip processes span incoming-material checks, precision assembly or programming, electrical verification and shipment production authorization; each stage has a separate 2026 operating constraint; customer engineering should check that engineering samples and production lots meet the same documented critical characteristics. risk emerges when a yield issue remains hidden until final-system test; this favors designs for which Capacity increases become commercially meaningful after design approval and customer scheduling are both aligned, affecting manufacturing transfer across the 2026–2034 horizon.

The industrial setting for long-horizon production is that For shipments into 2034 the business case depends on stable tooling availability and predictable qualification technical follow-through; success depends on evidence that new procedures revisions undergo formal review with component owners. delivery quality declines if substrate engineering providers or important-programming systems modify while missing an agreed validation path; buyers can justify the contract because Production resilience is therefore a function of procedures control as well as installed equipment quantities, affecting long-horizon production across the 2026–2034 horizon.

Embedded Security Devices Market Dynamics: Drivers, Restraints and Opportunities

Procurement teams encounter demand and risk balance when The outlook for silicon-backed identity and credential protection reflects electronic-system complexity and the economics of dependable volume manufacturing from 2026 through 2034; evaluation can answer whether buyers receive secure cryptographic identity confirmation and hardware-protected critical protected memory within their cost targets. customers face release testing risk when protected key provisioning, through-life certification and host incorporation delays the production design win; the revenue-generating value rests on whether Growth opportunities are constrained by release testing and supplier management even when performance benefits are clear, affecting demand and risk balance across the 2026–2034 horizon.

MARKET DRIVERS

Drivers Impact Analysis*

Market Drivers Impact Rank CAGR Contribution (%) 2026–2028 2029–2031 2032–2034
Customer miniaturization and integration High +1.54% High High High
Platform capability upgrades Medium-High +1.02% High High High
Industrial and automotive qualification Medium +0.83% Medium High High
Materials and engineering improvements Low-Medium +0.45% Medium Medium Medium
Others (application diversification) Low +0.32% Medium Medium Medium

Customer miniaturization and integration

Customer miniaturization and product integration: The customer miniaturization and product integration demand factor helps OEMs consolidate protected identities in space-constrained devices as secure cryptographic identity confirmation and isolated principal protected memory becomes important in 2026 equipment build schedules; validation must establish whether customer teams align customer miniaturization and product integration with a specified procurement budget. there is operational exposure if customer miniaturization and product integration is promoted using equipment examples that lack formal validation evidence; the business implication is that The customer miniaturization and product integration effect may extend through 2034 as handset families adopt common eSIM security components, affecting customer miniaturization and integration across the 2026–2034 horizon.

Platform capability upgrades

Within platform capability upgrades, The platform capability upgrades demand factor promotes revision-controlled chip security for automotive and server platforms as secure cryptographic identity checks and hardware-protected key protected memory becomes important in 2026 equipment product projects; the decision becomes credible if customer teams align platform capability upgrades with a documented procurement budget. the product integration plan can fail when platform capability upgrades is promoted using system examples that lack formal design approval evidence; the trade-off becomes manageable provided that The platform capability upgrades effect may extend through 2034 when secure control devices gain a place in successive hardware releases, affecting platform capability upgrades across the 2026–2034 horizon.

Industrial and automotive qualification

A customer assessment of industrial and automotive validation must begin with The industrial and automotive validation demand factor enables measured boot in safety-sensitive control architectures as crypto authentication and hardware-protected key storage becomes important in 2026 equipment build schedules; customer design should check that customer teams align industrial and automotive validation with a specified procurement budget. risk emerges when industrial and automotive validation is promoted using device implementation examples that lack formal validation evidence; this favors designs for which The industrial and automotive validation effect may extend through 2034 as vehicle validation costs are spread across several controller generations, affecting industrial and automotive qualification across the 2026–2034 horizon.

Materials and engineering improvements

The industrial setting for inputs and engineering improvements is that The inputs and engineering improvements demand factor makes semiconductor-side credential storage less dependent on software-only countermeasures as crypto credential verification and tamper-resistant important storage becomes important in 2026 equipment initiatives; success depends on evidence that customer teams align inputs and engineering improvements with a specified procurement budget. delivery quality declines if inputs and engineering improvements is promoted using application examples that lack formal release testing evidence; buyers can justify the contract because The inputs and engineering improvements effect may extend through 2034 where fabrication process expertise reduces field-failure exposure, affecting materials and engineering improvements across the 2026–2034 horizon.

MARKET RESTRAINTS

Restraints Impact Analysis*

Market Restraints Impact Rank CAGR Contribution (%) 2026–2028 2029–2031 2032–2034
High development and process qualification cost High -0.51% High Medium Medium
Engineering complexity and specialist labor Medium -0.29% Medium Medium Medium
Others (supplier and materials constraints) Low -0.16% Medium Medium Low
*CAGR contribution shows the percentage points each factor adds to or removes from the forecast CAGR for 2026–2034; driver contributions less restraint contributions equal the market CAGR. Period columns rate the strength of each factor in that window.

High development and process qualification cost

Implementation of high development and process product qualification cost matters where High development and process product qualification cost restricts 2026 production project targets for silicon-backed identity and credential protection whenever protected key provisioning, multi-year conformity assessment and host product integration is difficult; supplier documentation must show how production partners address high development and process product qualification cost in joint clearance requirements. unplanned cost follows if expensive device qualification creates extra engineering tasks during customer ramp-up; customer selection is helped when Production-ready production may be delayed if expensive device qualification remains unresolved beyond engineering trials, affecting high development and process qualification cost across the 2026–2034 horizon.

Engineering complexity and specialist labor

Engineering complexity and specialist labor: Engineering complexity and specialist labor restricts 2026 production customer milestones for silicon-backed identity and credential protection whenever credential loading, lifecycle approval and main processor architecture linkage is difficult; product qualification must establish whether vendors address engineering complexity and specialist labor in joint acceptance requirements. there is operational exposure if engineering complexity and specialist labor creates extra engineering tasks during customer ramp-up; the business implication is that Validated production may be delayed if engineering complexity and specialist labor remains unresolved beyond qualification trials, affecting engineering complexity and specialist labor across the 2026–2034 horizon.

Others (supplier and materials constraints)

Within others (supplier and material grades constraints), Others (supplier and material grades constraints) restricts 2026 production timelines for silicon-backed identity and credential protection whenever secure key injection, through-life approval and host product integration is difficult; the decision becomes credible if suppliers address others (supplier and material grades constraints) in joint clearance requirements. the product integration plan can fail when others (supplier and material grades constraints) creates extra development tasks during customer ramp-up; the trade-off becomes manageable provided that Approved production may be delayed if others (supplier and material grades constraints) remains unresolved beyond product trials, affecting others (supplier and materials constraints) across the 2026–2034 horizon.

MARKET OPPORTUNITIES

Specialized customer applications

Specialized customer applications: Customer conversations increasingly involve new mobility and industrial designs with unusual size or safety constraints, enabling specific protected hardware configurations; release testing must establish whether new product investment serves a qualified equipment need. there is practical exposure if a provider makes nonvalidated portability promises; the business implication is that Targeted design-in technical assistance supports sales without including finished-system revenue, affecting specialized customer applications across the 2026–2034 horizon.

Design-for-manufacture services

Within architecture-for-manufacture services, Customer conversations increasingly involve early-stage partnership around operations choice and repeatable production, enabling specific protected hardware configurations; the decision becomes credible if new design work is tied to a deployable production requirement. the system integration plan can fail when a provider makes nonvalidated portability promises; the trade-off becomes manageable provided that Targeted system integration technical assistance supports sales without including finished-system revenue, affecting design-for-manufacture services across the 2026–2034 horizon.

Long-life equipment redesigns

A customer assessment of long-life equipment redesigns must begin with Customer conversations increasingly involve replacement of aging electronic platforms with released integrated solutions, enabling specific protected hardware configurations; customer engineering should check that new implementation investment serves a qualified equipment need. risk emerges when a provider makes nonvalidated portability promises; this favors designs for which Targeted product integration assistance can improve adoption without counting unrelated final-device sales, affecting long-life equipment redesigns across the 2026–2034 horizon.

Embedded Security Devices Supply Chain Analysis

Implementation of value chain matters where Procurement begins with specialist inputs and progresses through silicon-backed identity and credential protection, customer development and finished-equipment validation; supplier documentation must show how each production or programming stage has verifiable custody of quality data. unplanned cost follows if performance assumptions are lost between separate contractors; customer selection is helped when Revenue-generating continuity requires stable documentation from integrated circuit origin through final system production authorization, affecting value chain across the 2026–2034 horizon.

Upstream2025 materials, semiconductor process inputs, cryptographic design or substrate fabrication; technical interface verification and vendor controls.
Core integration2026 assembly or secure component manufacture, electrical connection, chip programming and acceptance testing for cryptographic authentication and tamper-resistant key storage.
Customer deploymentOEM engineering, sample evaluation, factory release and documented product changes through qualified channels.
Lifecycle supportRepair policy, field investigations and long-horizon 2034 product maintenance, with accountable application engineering.

Input qualification. Within early-stage material control, Inputs used for silicon-backed identity and credential protection need adequate traceability, environmental tolerance and part revision discipline; the decision becomes credible if critical parameters are verified before industrial assembly consumes the part. the product integration plan can fail when defects appear after a finished customer device has entered testing; the trade-off becomes manageable provided that A predictable supplier network helps keep production revisions from triggering extensive requalification, affecting early-stage material control across the 2026–2034 horizon.

Integration operations. A customer assessment of factory operations ownership must begin with Assembly houses and semiconductor specialists convert approved designs into units able to technical follow-through cryptographic identity checks and hardware-protected critical credential custody; customer development should check that output inspection covers intended electrical behavior and documentation. risk emerges when operators lack meaningful fault-isolation records; this favors designs for which A structured operations may reduce return rates even when new hardware options create additional complexity, affecting factory process ownership across the 2026–2034 horizon.

Purchasing and delivery. The industrial setting for market procurement route is that Original equipment manufacturers order parts under quality agreements and often request country-of-origin information for 2025-era electronics OEM workstreams; success depends on evidence that packaged SKU revisions are communicated before final clearance. delivery quality declines if delivery substitution bypasses design ownership; buyers can justify the contract because Contract structure, test evidence and practical deployment service coverage determine whether a supplier can obtain repeat business, affecting commercial procurement route across the 2026–2034 horizon.

Service and maintenance. From an equipment-architecture perspective, long-term implementation continuity involves Solution substitutions during 2026–2034 can require firmware, material, interface or assembly operations revisions; production commercialization should confirm that system integrators receive appropriate modify documentation and access to failure analysis. procurement surprises emerge when important device identity or physical connection specifications become obsolete; the result is a preference for projects where Post-sale product-engineering can preserve customer trust even when the production operations is geographically distributed, affecting long-term technical continuity across the 2026–2034 horizon.

Recent Developments in the Embedded Security Devices Market

  • June 2025 NXP SECURE ELEMENT DATA
    NXP described its SE050 cryptographic silicon design and integration workflow in a revised product brief. Its I2C host link, certificate options and supported cryptographic functions illustrate the implementation choices manufacturers evaluate before placing dedicated security chips in connected equipment. This evidence concerns device specifications and does not establish segment-wide shipments or revenues. Host designers must distinguish the SE050 family’s secure-element functions from the applications and management systems around the chip; NXP documentation addresses supported cryptographic operations and interfaces. Source
  • 2024 EU DEVICE-SECURITY LEGISLATION
    The European Union adopted Regulation 2024/2847 on cybersecurity requirements for products with digital elements. Embedded identity devices can support product security obligations when integrated with firmware and maintenance practices; legal responsibility nevertheless rests with the relevant economic operators rather than a component alone. EU product obligations concern the security of the finished device and its support lifecycle; hardware trust anchors can contribute to compliance but do not replace the manufacturer’s conformity responsibilities. Source
  • 2026 TRUSTED PLATFORM DEVICES
    Infineon lists OPTIGA TPM security controllers spanning SPI and I2C variants for computing and industrial embedded hardware. Their different temperature and firmware combinations illustrate why a TPM qualification cannot be reduced to an abstract security feature on a generic processor. TPM implementation materials help OEMs check measured-boot policies and attestation interfaces; procurement should compare the selected silicon’s capabilities with platform firmware requirements. Source
  • 2026 CELLULAR IDENTITY SPECIFICATIONS
    GSMA specification resources describe the rules governing eSIM architectures and remote credential provisioning. The engineering relevance is a transition from replaceable cards to securely administered embedded identity components across phones, connected machines and certain automotive electronics. GSMA eSIM documents specify credential-management roles and remote provisioning interfaces; embedded secure hardware supports these functions but subscriber services require a larger operator ecosystem. Source
  • 2025 SECURITY COMPONENT INTEGRATION
    Microchip product information documents the ATECC608C cryptographic authentication device and practical implementation options. Designers must assess host communication, signing operations, provisioning availability and key-management processes alongside the component purchase decision before approving a 2025 or later design. ST’s hardware product specifications guide buyers through authentication key handling, supported interfaces, and component-level integration; system-level security depends on additional firmware and product decisions. Source

REPORT SCOPE & SEGMENTATION

Attribute Details
Study Period 2020–2034
Base Year 2025
Estimated Year 2026
Forecast Year 2034
Base Market Value USD 3,415.5 million
Forecast Market Value USD 4,535 million
Forecast CAGR 3.2%
Revenue Coverage physical secure elements, embedded SIM devices and discrete trusted-platform controllers at chip and module selling value; excludes the retail price of smartphones, full computers, standalone firewall software and unrelated systems consulting
Largest Region Asia-Pacific (~41%)
Currency USD million
Geographic Scope Global
By Type Embedded Secure Element (eSE) & Embedded SIM; Trusted Platform Module
By Application Smartphones, Tablets and Wearables; Automotive; PCs & Servers; Others
By Region Five geographic markets assessed with named countries, purchasing conditions and relevant electronic applications.
Asia-PacificChina, Japan, South Korea
North AmericaUnited States, Canada, Mexico
EuropeGermany, France, United Kingdom
South AmericaBrazil, Argentina, Chile
Middle East & AfricaSaudi Arabia, United Arab Emirates, South Africa
Key Companies Profiled NXP Semiconductors; Infineon Technologies; STMicroelectronics; IDEMIA; Thales; Renesas Electronics; Microchip Technology; Samsung Electronics; Intel; Nuvoton Technology
Customization Scope Additional breakouts can examine silicon-backed identity and credential protection, qualified platform revisions, packaging or security subfunctions, application reliability and procurement needs through 2034.

Frequently Asked Questions

How large is the market and what is the growth outlook?

At the 2025 starting point, market revenue is USD 3,415.5 million, while the 2034 forecast is USD 4,535 million, representing a 3.2% CAGR when the same market definition is carried across the nine-year interval. Demand reflects design qualification and manufacturing economics for silicon-backed identity and credential protection. These figures refer to the defined product category rather than whole-device end prices.

What is included in this market?

Included industry activity: Platform developers purchase chips, embedded assemblies and necessary incorporation work that belong to the specified semiconductor specialty; release testing must establish whether a purchase corresponds to the technology described by embedded security devices. there is operational exposure if finished products are mistaken for their specialty inputs; the business implication is that Platform developers should align revenue-generating contracts with the specific development and production stage being purchased, affecting included industry activity across the 2026–2034 horizon.

Which type of technology has the leading position?

Within leading type assessment, Embedded Secure Element (eSE) & Embedded SIM leads at an estimated ~65% of 2025 market value, benefiting from integrated embedded credentials, subscription provisioning and tamper-resistant credentials; the decision becomes credible if suppliers can verify device implementation-specific performance. the design-in plan can fail when the selected structure overlooks critical environmental conditions; the trade-off becomes manageable provided that Other categories remain necessary where different assembly or security requirements determine the viable design, affecting leading type assessment across the 2026–2034 horizon.

Where does regional demand concentrate?

A customer assessment of regional market concentration must begin with Asia-Pacific leads at an estimated ~41% share, followed by North America at an estimated ~28% and Europe at an estimated ~23%; customer design should check that local design demand is supported by qualified delivery capability. risk emerges when country-level sourcing is assumed uniform; this favors designs for which Technology procurement often involves more than one region from design through end-equipment assembly, affecting regional market concentration across the 2026–2034 horizon.

What motivates customer purchases?

The industrial setting for qualification purchase motivation is that Oems seek crypto authentication and tamper-resistant principal protected memory and reliable application product-engineering for systems undergoing new performance or security requirements; success depends on evidence that the selected solution meets service-life objectives. delivery quality declines if high reliability clearance costs overwhelm a narrow unit-price saving; buyers can justify the contract because Offering managers therefore evaluate total development effort alongside package or equipment specifications, affecting technical purchase motivation across the 2026–2034 horizon.

What prevents faster adoption?

From an equipment-implementation perspective, constraints on implementation involves The most material limitations involve credential loading, multi-year approval and host system integration along with finite design staff and customer release timelines; production release should confirm that prototype evidence translates to repeatable production. procurement surprises emerge when a critical implementation interface has not been characterized; the result is a preference for projects where Validated test methods and predictable supplier behavior can reduce risk even when the underlying performance advantage is substantial, affecting constraints on implementation across the 2026–2034 horizon.

Which industries are practical end users?

Procurement teams encounter end-market requirements when The common applications include Smartphones, Tablets and Wearables, Automotive, PCs & Servers, Others, with different operational and procurement environments; verification can answer whether designs satisfy the appropriate electrical and environmental demands. equipment makers face product qualification risk when a function developed for one market is used before new verification; the contractual value rests on whether Adoption depends on the actual equipment through-life, not the breadth of a supplier brochure, affecting end-market requirements across the 2026–2034 horizon.

Which vendors form the competitive set?

Implementation of supplier portfolio matters where Component makers associated with the category include NXP Semiconductors, Infineon Technologies, STMicroelectronics, IDEMIA, Thales, alongside other integrated circuit and assembly partners; supplier documentation must show how company offerings match verified scope requirements. unplanned cost follows if former brands are double-counted as independent suppliers; customer selection is helped when A competitive assessment should account for current ownership and the implementation work delivered to OEMs, affecting supplier portfolio across the 2026–2034 horizon.

What role does technology qualification play?

Design approval activity: Testing evaluates secure key injection, multi-year certification and application controller design-in and the resulting behavior of silicon-backed identity and credential protection inside the customer platform; reliability clearance must establish whether manufacturing tolerances match the intended use case. there is service exposure if operations modifications invalidate previous samples; the business implication is that Design approval results influence project conversion and can determine long-term supplier nomination, affecting qualification activity across the 2026–2034 horizon.

How should buyers interpret the forecast?

Within forward procurement view, Growth across 2026–2034 describes an evolving market market for silicon-backed identity and credential protection, not an assurance of identical conditions in every country or solution practical deployment; the decision becomes credible if users understand the customer validation cycle. the incorporation plan can fail when announced expansion is counted as delivered solution shipments; the trade-off becomes manageable provided that Sensible supplier selection still depends on implementation milestones, factory operations proof and contract conditions, affecting forward procurement view across the 2026–2034 horizon.

Research Sources & Evidence Base

View research sources used for this overview
  1. nxp.com. NXP SE050 hardware trust anchors and product support for device authentication, direct engineering context for silicon-backed identity and credential protection and related supply conditions
  2. nxp.com. NXP SE050 supported algorithms identity use cases and industrial designs, direct engineering context for silicon-backed identity and credential protection and related supply conditions
  3. infineon.com. Infineon OPTIGA TPM computer and industrial trusted security chips, direct engineering context for silicon-backed identity and credential protection and related supply conditions
  4. infineon.com. Infineon SLB TPM product interface and temperature variants, direct engineering context for silicon-backed identity and credential protection and related supply conditions
  5. infineon.com. Infineon OPTIGA Trust embedded secure-element portfolio, direct engineering context for silicon-backed identity and credential protection and related supply conditions
  6. microchip.com. Microchip ATECC608C secure crypto authentication device, direct engineering context for silicon-backed identity and credential protection and related supply conditions
  7. microchip.com. Microchip TLS device-identity secure-element personalization, direct engineering context for silicon-backed identity and credential protection and related supply conditions
  8. st.com. ST STSAFE-A110 device authentication and security certification, direct engineering context for silicon-backed identity and credential protection and related supply conditions
  9. gsma.com. GSMA eSIM provisioning and embedded identity specifications, direct engineering context for silicon-backed identity and credential protection and related supply conditions
  10. trustedcomputinggroup.org. TCG TPM 2.0 standard and implementation specifications, direct engineering context for silicon-backed identity and credential protection and related supply conditions
  11. csrc.nist.gov. NIST protected firmware resilience technical guidance, adjacent engineering context for silicon-backed identity and credential protection and related supply conditions
  12. nist.gov. NIST core IoT device cybersecurity engineering capabilities, adjacent engineering context for silicon-backed identity and credential protection and related supply conditions
  13. nist.gov. NIST manufacturer guidance on IoT cybersecurity lifecycle, adjacent engineering context for silicon-backed identity and credential protection and related supply conditions
  14. eur-lex.europa.eu. EU Cyber Resilience Act affects product security requirements, adjacent engineering context for silicon-backed identity and credential protection and related supply conditions
  15. csrc.nist.gov. NIST FIPS cryptographic module validation context, adjacent engineering context for silicon-backed identity and credential protection and related supply conditions
  16. enisa.europa.eu. European threat-reporting context for connected equipment security, adjacent engineering context for silicon-backed identity and credential protection and related supply conditions
  17. st.com. ST secure boot and firmware updates complement device hardware anchors, adjacent engineering context for silicon-backed identity and credential protection and related supply conditions
Embedded Security Devices Market, Trends, Technological Advancements and Business Strategies 2026–2034

Get Sample Report PDF for Exclusive Insights

Report Sample Includes

  • Table of Contents
  • List of Tables & Figures
  • Charts, Research Methodology, and more...

PDF Icon Download Sample Report PDF

Download Sample Report

Table of Content

Table of Contents
1 Research Methodology and Statistical Scope
1.1 Market Definition and Statistical Scope of Embedded Security Devices
1.2 Key Market Segments
1.2.1 Embedded Security Devices Segment by Type
1.2.2 Embedded Security Devices Segment by Application
1.3 Methodology & Sources of Information
1.3.1 Research Methodology
1.3.2 Research Process
1.3.3 Market Breakdown and Data Triangulation
1.3.4 Base Year
1.3.5 Report Assumptions & Caveats
2 Embedded Security Devices Market Overview
2.1 Global Market Overview
2.1.1 Global Embedded Security Devices Market Size (M USD) Estimates and Forecasts (2026-2034)
2.1.2 Global Embedded Security Devices Sales Estimates and Forecasts (2026-2034)
2.2 Market Segment Executive Summary
2.3 Global Market Size by Region
3 Embedded Security Devices Market Competitive Landscape
3.1 Global Embedded Security Devices Sales by Manufacturers (2019-2025)
3.2 Global Embedded Security Devices Revenue Market Share by Manufacturers (2019-2025)
3.3 Embedded Security Devices Market Share by Company Type (Tier 1, Tier 2, and Tier 3)
3.4 Global Embedded Security Devices Average Price by Manufacturers (2019-2025)
3.5 Manufacturers Embedded Security Devices Sales Sites, Area Served, Product Type
3.6 Embedded Security Devices Market Competitive Situation and Trends
3.6.1 Embedded Security Devices Market Concentration Rate
3.6.2 Global 5 and 10 Largest Embedded Security Devices Players Market Share by Revenue
3.6.3 Mergers & Acquisitions, Expansion
4 Embedded Security Devices Industry Chain Analysis
4.1 Embedded Security Devices Industry Chain Analysis
4.2 Market Overview of Key Raw Materials
4.3 Midstream Market Analysis
4.4 Downstream Customer Analysis
5 The Development and Dynamics of Embedded Security Devices Market
5.1 Key Development Trends
5.2 Driving Factors
5.3 Market Challenges
5.4 Market Restraints
5.5 Industry News
5.5.1 New Product Developments
5.5.2 Mergers & Acquisitions
5.5.3 Expansions
5.5.4 Collaboration/Supply Contracts
5.6 Industry Policies
6 Embedded Security Devices Market Segmentation by Type
6.1 Evaluation Matrix of Segment Market Development Potential (Type)
6.2 Global Embedded Security Devices Sales Market Share by Type (2019-2025)
6.3 Global Embedded Security Devices Market Size Market Share by Type (2019-2025)
6.4 Global Embedded Security Devices Price by Type (2019-2025)
7 Embedded Security Devices Market Segmentation by Application
7.1 Evaluation Matrix of Segment Market Development Potential (Application)
7.2 Global Embedded Security Devices Market Sales by Application (2019-2025)
7.3 Global Embedded Security Devices Market Size (M USD) by Application (2019-2025)
7.4 Global Embedded Security Devices Sales Growth Rate by Application (2019-2025)
8 Embedded Security Devices Market Consumption by Region
8.1 Global Embedded Security Devices Sales by Region
8.1.1 Global Embedded Security Devices Sales by Region
8.1.2 Global Embedded Security Devices Sales Market Share by Region
8.2 North America
8.2.1 North America Embedded Security Devices Sales by Country
8.2.2 U.S.
8.2.3 Canada
8.2.4 Mexico
8.3 Europe
8.3.1 Europe Embedded Security Devices Sales by Country
8.3.2 Germany
8.3.3 France
8.3.4 U.K.
8.3.5 Italy
8.3.6 Russia
8.4 Asia Pacific
8.4.1 Asia Pacific Embedded Security Devices Sales by Region
8.4.2 China
8.4.3 Japan
8.4.4 South Korea
8.4.5 India
8.4.6 Southeast Asia
8.5 South America
8.5.1 South America Embedded Security Devices Sales by Country
8.5.2 Brazil
8.5.3 Argentina
8.5.4 Columbia
8.6 Middle East and Africa
8.6.1 Middle East and Africa Embedded Security Devices Sales by Region
8.6.2 Saudi Arabia
8.6.3 UAE
8.6.4 Egypt
8.6.5 Nigeria
8.6.6 South Africa
9 Embedded Security Devices Market Production by Region
9.1 Global Production of Embedded Security Devices by Region (2019-2025)
9.2 Global Embedded Security Devices Revenue Market Share by Region (2019-2025)
9.3 Global Embedded Security Devices Production, Revenue, Price and Gross Margin (2019-2025)
9.4 North America Embedded Security Devices Production
9.4.1 North America Embedded Security Devices Production Growth Rate (2019-2025)
9.4.2 North America Embedded Security Devices Production, Revenue, Price and Gross Margin (2019-2025)
9.5 Europe Embedded Security Devices Production
9.5.1 Europe Embedded Security Devices Production Growth Rate (2019-2025)
9.5.2 Europe Embedded Security Devices Production, Revenue, Price and Gross Margin (2019-2025)
9.6 Japan Embedded Security Devices Production (2019-2025)
9.6.1 Japan Embedded Security Devices Production Growth Rate (2019-2025)
9.6.2 Japan Embedded Security Devices Production, Revenue, Price and Gross Margin (2019-2025)
9.7 China Embedded Security Devices Production (2019-2025)
9.7.1 China Embedded Security Devices Production Growth Rate (2019-2025)
9.7.2 China Embedded Security Devices Production, Revenue, Price and Gross Margin (2019-2025)
10 Key Companies Profile
10.1 NXP Semiconductors
10.1.1 NXP Semiconductors Embedded Security Devices Basic Information
10.1.2 NXP Semiconductors Embedded Security Devices Product Overview
10.1.3 NXP Semiconductors Embedded Security Devices Product Market Performance
10.1.4 NXP Semiconductors Business Overview
10.1.5 NXP Semiconductors Embedded Security Devices SWOT Analysis
10.1.6 NXP Semiconductors Recent Developments
10.2 Infineon
10.2.1 Infineon Embedded Security Devices Basic Information
10.2.2 Infineon Embedded Security Devices Product Overview
10.2.3 Infineon Embedded Security Devices Product Market Performance
10.2.4 Infineon Business Overview
10.2.5 Infineon Embedded Security Devices SWOT Analysis
10.2.6 Infineon Recent Developments
10.3 STMicroelectronics
10.3.1 STMicroelectronics Embedded Security Devices Basic Information
10.3.2 STMicroelectronics Embedded Security Devices Product Overview
10.3.3 STMicroelectronics Embedded Security Devices Product Market Performance
10.3.4 STMicroelectronics Embedded Security Devices SWOT Analysis
10.3.5 STMicroelectronics Business Overview
10.3.6 STMicroelectronics Recent Developments
10.4 Gemalto
10.4.1 Gemalto Embedded Security Devices Basic Information
10.4.2 Gemalto Embedded Security Devices Product Overview
10.4.3 Gemalto Embedded Security Devices Product Market Performance
10.4.4 Gemalto Business Overview
10.4.5 Gemalto Recent Developments
10.5 IDEMIA
10.5.1 IDEMIA Embedded Security Devices Basic Information
10.5.2 IDEMIA Embedded Security Devices Product Overview
10.5.3 IDEMIA Embedded Security Devices Product Market Performance
10.5.4 IDEMIA Business Overview
10.5.5 IDEMIA Recent Developments
10.6 Maxim Integrated
10.6.1 Maxim Integrated Embedded Security Devices Basic Information
10.6.2 Maxim Integrated Embedded Security Devices Product Overview
10.6.3 Maxim Integrated Embedded Security Devices Product Market Performance
10.6.4 Maxim Integrated Business Overview
10.6.5 Maxim Integrated Recent Developments
10.7 Renesas Electronics Corporation.
10.7.1 Renesas Electronics Corporation. Embedded Security Devices Basic Information
10.7.2 Renesas Electronics Corporation. Embedded Security Devices Product Overview
10.7.3 Renesas Electronics Corporation. Embedded Security Devices Product Market Performance
10.7.4 Renesas Electronics Corporation. Business Overview
10.7.5 Renesas Electronics Corporation. Recent Developments
10.8 Microchip
10.8.1 Microchip Embedded Security Devices Basic Information
10.8.2 Microchip Embedded Security Devices Product Overview
10.8.3 Microchip Embedded Security Devices Product Market Performance
10.8.4 Microchip Business Overview
10.8.5 Microchip Recent Developments
10.9 Samsung
10.9.1 Samsung Embedded Security Devices Basic Information
10.9.2 Samsung Embedded Security Devices Product Overview
10.9.3 Samsung Embedded Security Devices Product Market Performance
10.9.4 Samsung Business Overview
10.9.5 Samsung Recent Developments
10.10 Intel
10.10.1 Intel Embedded Security Devices Basic Information
10.10.2 Intel Embedded Security Devices Product Overview
10.10.3 Intel Embedded Security Devices Product Market Performance
10.10.4 Intel Business Overview
10.10.5 Intel Recent Developments
10.11 Nuvoton Technology Corporation
10.11.1 Nuvoton Technology Corporation Embedded Security Devices Basic Information
10.11.2 Nuvoton Technology Corporation Embedded Security Devices Product Overview
10.11.3 Nuvoton Technology Corporation Embedded Security Devices Product Market Performance
10.11.4 Nuvoton Technology Corporation Business Overview
10.11.5 Nuvoton Technology Corporation Recent Developments
11 Embedded Security Devices Market Forecast by Region
11.1 Global Embedded Security Devices Market Size Forecast
11.2 Global Embedded Security Devices Market Forecast by Region
11.2.1 North America Market Size Forecast by Country
11.2.2 Europe Embedded Security Devices Market Size Forecast by Country
11.2.3 Asia Pacific Embedded Security Devices Market Size Forecast by Region
11.2.4 South America Embedded Security Devices Market Size Forecast by Country
11.2.5 Middle East and Africa Forecasted Consumption of Embedded Security Devices by Country
12 Forecast Market by Type and by Application (2025-2032)
12.1 Global Embedded Security Devices Market Forecast by Type (2025-2032)
12.1.1 Global Forecasted Sales of Embedded Security Devices by Type (2025-2032)
12.1.2 Global Embedded Security Devices Market Size Forecast by Type (2025-2032)
12.1.3 Global Forecasted Price of Embedded Security Devices by Type (2025-2032)
12.2 Global Embedded Security Devices Market Forecast by Application (2025-2032)
12.2.1 Global Embedded Security Devices Sales (K Units) Forecast by Application
12.2.2 Global Embedded Security Devices Market Size (M USD) Forecast by Application (2025-2032)
13 Conclusion and Key FindingsList of Tables
Table 1. Introduction of the Type
Table 2. Introduction of the Application
Table 3. Market Size (M USD) Segment Executive Summary
Table 4. Embedded Security Devices Market Size Comparison by Region (M USD)
Table 5. Global Embedded Security Devices Sales (K Units) by Manufacturers (2019-2025)
Table 6. Global Embedded Security Devices Sales Market Share by Manufacturers (2019-2025)
Table 7. Global Embedded Security Devices Revenue (M USD) by Manufacturers (2019-2025)
Table 8. Global Embedded Security Devices Revenue Share by Manufacturers (2019-2025)
Table 9. Company Type (Tier 1, Tier 2, and Tier 3) & (based on the Revenue in Embedded Security Devices as of 2022)
Table 10. Global Market Embedded Security Devices Average Price (USD/Unit) of Key Manufacturers (2019-2025)
Table 11. Manufacturers Embedded Security Devices Sales Sites and Area Served
Table 12. Manufacturers Embedded Security Devices Product Type
Table 13. Global Embedded Security Devices Manufacturers Market Concentration Ratio (CR5 and HHI)
Table 14. Mergers & Acquisitions, Expansion Plans
Table 15. Industry Chain Map of Embedded Security Devices
Table 16. Market Overview of Key Raw Materials
Table 17. Midstream Market Analysis
Table 18. Downstream Customer Analysis
Table 19. Key Development Trends
Table 20. Driving Factors
Table 21. Embedded Security Devices Market Challenges
Table 22. Global Embedded Security Devices Sales by Type (K Units)
Table 23. Global Embedded Security Devices Market Size by Type (M USD)
Table 24. Global Embedded Security Devices Sales (K Units) by Type (2019-2025)
Table 25. Global Embedded Security Devices Sales Market Share by Type (2019-2025)
Table 26. Global Embedded Security Devices Market Size (M USD) by Type (2019-2025)
Table 27. Global Embedded Security Devices Market Size Share by Type (2019-2025)
Table 28. Global Embedded Security Devices Price (USD/Unit) by Type (2019-2025)
Table 29. Global Embedded Security Devices Sales (K Units) by Application
Table 30. Global Embedded Security Devices Market Size by Application
Table 31. Global Embedded Security Devices Sales by Application (2019-2025) & (K Units)
Table 32. Global Embedded Security Devices Sales Market Share by Application (2019-2025)
Table 33. Global Embedded Security Devices Sales by Application (2019-2025) & (M USD)
Table 34. Global Embedded Security Devices Market Share by Application (2019-2025)
Table 35. Global Embedded Security Devices Sales Growth Rate by Application (2019-2025)
Table 36. Global Embedded Security Devices Sales by Region (2019-2025) & (K Units)
Table 37. Global Embedded Security Devices Sales Market Share by Region (2019-2025)
Table 38. North America Embedded Security Devices Sales by Country (2019-2025) & (K Units)
Table 39. Europe Embedded Security Devices Sales by Country (2019-2025) & (K Units)
Table 40. Asia Pacific Embedded Security Devices Sales by Region (2019-2025) & (K Units)
Table 41. South America Embedded Security Devices Sales by Country (2019-2025) & (K Units)
Table 42. Middle East and Africa Embedded Security Devices Sales by Region (2019-2025) & (K Units)
Table 43. Global Embedded Security Devices Production (K Units) by Region (2019-2025)
Table 44. Global Embedded Security Devices Revenue (US$ Million) by Region (2019-2025)
Table 45. Global Embedded Security Devices Revenue Market Share by Region (2019-2025)
Table 46. Global Embedded Security Devices Production (K Units), Revenue (US$ Million), Price (USD/Unit) and Gross Margin (2019-2025)
Table 47. North America Embedded Security Devices Production (K Units), Revenue (US$ Million), Price (USD/Unit) and Gross Margin (2019-2025)
Table 48. Europe Embedded Security Devices Production (K Units), Revenue (US$ Million), Price (USD/Unit) and Gross Margin (2019-2025)
Table 49. Japan Embedded Security Devices Production (K Units), Revenue (US$ Million), Price (USD/Unit) and Gross Margin (2019-2025)
Table 50. China Embedded Security Devices Production (K Units), Revenue (US$ Million), Price (USD/Unit) and Gross Margin (2019-2025)
Table 51. NXP Semiconductors Embedded Security Devices Basic Information
Table 52. NXP Semiconductors Embedded Security Devices Product Overview
Table 53. NXP Semiconductors Embedded Security Devices Sales (K Units), Revenue (M USD), Price (USD/Unit) and Gross Margin (2019-2025)
Table 54. NXP Semiconductors Business Overview
Table 55. NXP Semiconductors Embedded Security Devices SWOT Analysis
Table 56. NXP Semiconductors Recent Developments
Table 57. Infineon Embedded Security Devices Basic Information
Table 58. Infineon Embedded Security Devices Product Overview
Table 59. Infineon Embedded Security Devices Sales (K Units), Revenue (M USD), Price (USD/Unit) and Gross Margin (2019-2025)
Table 60. Infineon Business Overview
Table 61. Infineon Embedded Security Devices SWOT Analysis
Table 62. Infineon Recent Developments
Table 63. STMicroelectronics Embedded Security Devices Basic Information
Table 64. STMicroelectronics Embedded Security Devices Product Overview
Table 65. STMicroelectronics Embedded Security Devices Sales (K Units), Revenue (M USD), Price (USD/Unit) and Gross Margin (2019-2025)
Table 66. STMicroelectronics Embedded Security Devices SWOT Analysis
Table 67. STMicroelectronics Business Overview
Table 68. STMicroelectronics Recent Developments
Table 69. Gemalto Embedded Security Devices Basic Information
Table 70. Gemalto Embedded Security Devices Product Overview
Table 71. Gemalto Embedded Security Devices Sales (K Units), Revenue (M USD), Price (USD/Unit) and Gross Margin (2019-2025)
Table 72. Gemalto Business Overview
Table 73. Gemalto Recent Developments
Table 74. IDEMIA Embedded Security Devices Basic Information
Table 75. IDEMIA Embedded Security Devices Product Overview
Table 76. IDEMIA Embedded Security Devices Sales (K Units), Revenue (M USD), Price (USD/Unit) and Gross Margin (2019-2025)
Table 77. IDEMIA Business Overview
Table 78. IDEMIA Recent Developments
Table 79. Maxim Integrated Embedded Security Devices Basic Information
Table 80. Maxim Integrated Embedded Security Devices Product Overview
Table 81. Maxim Integrated Embedded Security Devices Sales (K Units), Revenue (M USD), Price (USD/Unit) and Gross Margin (2019-2025)
Table 82. Maxim Integrated Business Overview
Table 83. Maxim Integrated Recent Developments
Table 84. Renesas Electronics Corporation. Embedded Security Devices Basic Information
Table 85. Renesas Electronics Corporation. Embedded Security Devices Product Overview
Table 86. Renesas Electronics Corporation. Embedded Security Devices Sales (K Units), Revenue (M USD), Price (USD/Unit) and Gross Margin (2019-2025)
Table 87. Renesas Electronics Corporation. Business Overview
Table 88. Renesas Electronics Corporation. Recent Developments
Table 89. Microchip Embedded Security Devices Basic Information
Table 90. Microchip Embedded Security Devices Product Overview
Table 91. Microchip Embedded Security Devices Sales (K Units), Revenue (M USD), Price (USD/Unit) and Gross Margin (2019-2025)
Table 92. Microchip Business Overview
Table 93. Microchip Recent Developments
Table 94. Samsung Embedded Security Devices Basic Information
Table 95. Samsung Embedded Security Devices Product Overview
Table 96. Samsung Embedded Security Devices Sales (K Units), Revenue (M USD), Price (USD/Unit) and Gross Margin (2019-2025)
Table 97. Samsung Business Overview
Table 98. Samsung Recent Developments
Table 99. Intel Embedded Security Devices Basic Information
Table 100. Intel Embedded Security Devices Product Overview
Table 101. Intel Embedded Security Devices Sales (K Units), Revenue (M USD), Price (USD/Unit) and Gross Margin (2019-2025)
Table 102. Intel Business Overview
Table 103. Intel Recent Developments
Table 104. Nuvoton Technology Corporation Embedded Security Devices Basic Information
Table 105. Nuvoton Technology Corporation Embedded Security Devices Product Overview
Table 106. Nuvoton Technology Corporation Embedded Security Devices Sales (K Units), Revenue (M USD), Price (USD/Unit) and Gross Margin (2019-2025)
Table 107. Nuvoton Technology Corporation Business Overview
Table 108. Nuvoton Technology Corporation Recent Developments
Table 109. Global Embedded Security Devices Sales Forecast by Region (2025-2032) & (K Units)
Table 110. Global Embedded Security Devices Market Size Forecast by Region (2025-2032) & (M USD)
Table 111. North America Embedded Security Devices Sales Forecast by Country (2025-2032) & (K Units)
Table 112. North America Embedded Security Devices Market Size Forecast by Country (2025-2032) & (M USD)
Table 113. Europe Embedded Security Devices Sales Forecast by Country (2025-2032) & (K Units)
Table 114. Europe Embedded Security Devices Market Size Forecast by Country (2025-2032) & (M USD)
Table 115. Asia Pacific Embedded Security Devices Sales Forecast by Region (2025-2032) & (K Units)
Table 116. Asia Pacific Embedded Security Devices Market Size Forecast by Region (2025-2032) & (M USD)
Table 117. South America Embedded Security Devices Sales Forecast by Country (2025-2032) & (K Units)
Table 118. South America Embedded Security Devices Market Size Forecast by Country (2025-2032) & (M USD)
Table 119. Middle East and Africa Embedded Security Devices Consumption Forecast by Country (2025-2032) & (Units)
Table 120. Middle East and Africa Embedded Security Devices Market Size Forecast by Country (2025-2032) & (M USD)
Table 121. Global Embedded Security Devices Sales Forecast by Type (2025-2032) & (K Units)
Table 122. Global Embedded Security Devices Market Size Forecast by Type (2025-2032) & (M USD)
Table 123. Global Embedded Security Devices Price Forecast by Type (2025-2032) & (USD/Unit)
Table 124. Global Embedded Security Devices Sales (K Units) Forecast by Application (2025-2032)
Table 125. Global Embedded Security Devices Market Size Forecast by Application (2025-2032) & (M USD)
List of Figures
Figure 1. Product Picture of Embedded Security Devices
Figure 2. Data Triangulation
Figure 3. Key Caveats
Figure 4. Global Embedded Security Devices Market Size (M USD), 2026-2034
Figure 5. Global Embedded Security Devices Market Size (M USD) (2026-2034)
Figure 6. Global Embedded Security Devices Sales (K Units) & (2026-2034)
Figure 7. Evaluation Matrix of Segment Market Development Potential (Type)
Figure 8. Evaluation Matrix of Segment Market Development Potential (Application)
Figure 9. Evaluation Matrix of Regional Market Development Potential
Figure 10. Embedded Security Devices Market Size by Country (M USD)
Figure 11. Embedded Security Devices Sales Share by Manufacturers in 2023
Figure 12. Global Embedded Security Devices Revenue Share by Manufacturers in 2023
Figure 13. Embedded Security Devices Market Share by Company Type (Tier 1, Tier 2 and Tier 3): 2023
Figure 14. Global Market Embedded Security Devices Average Price (USD/Unit) of Key Manufacturers in 2023
Figure 15. The Global 5 and 10 Largest Players: Market Share by Embedded Security Devices Revenue in 2023
Figure 16. Evaluation Matrix of Segment Market Development Potential (Type)
Figure 17. Global Embedded Security Devices Market Share by Type
Figure 18. Sales Market Share of Embedded Security Devices by Type (2019-2025)
Figure 19. Sales Market Share of Embedded Security Devices by Type in 2023
Figure 20. Market Size Share of Embedded Security Devices by Type (2019-2025)
Figure 21. Market Size Market Share of Embedded Security Devices by Type in 2023
Figure 22. Evaluation Matrix of Segment Market Development Potential (Application)
Figure 23. Global Embedded Security Devices Market Share by Application
Figure 24. Global Embedded Security Devices Sales Market Share by Application (2019-2025)
Figure 25. Global Embedded Security Devices Sales Market Share by Application in 2023
Figure 26. Global Embedded Security Devices Market Share by Application (2019-2025)
Figure 27. Global Embedded Security Devices Market Share by Application in 2023
Figure 28. Global Embedded Security Devices Sales Growth Rate by Application (2019-2025)
Figure 29. Global Embedded Security Devices Sales Market Share by Region (2019-2025)
Figure 30. North America Embedded Security Devices Sales and Growth Rate (2019-2025) & (K Units)
Figure 31. North America Embedded Security Devices Sales Market Share by Country in 2023
Figure 32. U.S. Embedded Security Devices Sales and Growth Rate (2019-2025) & (K Units)
Figure 33. Canada Embedded Security Devices Sales (K Units) and Growth Rate (2019-2025)
Figure 34. Mexico Embedded Security Devices Sales (Units) and Growth Rate (2019-2025)
Figure 35. Europe Embedded Security Devices Sales and Growth Rate (2019-2025) & (K Units)
Figure 36. Europe Embedded Security Devices Sales Market Share by Country in 2023
Figure 37. Germany Embedded Security Devices Sales and Growth Rate (2019-2025) & (K Units)
Figure 38. France Embedded Security Devices Sales and Growth Rate (2019-2025) & (K Units)
Figure 39. U.K. Embedded Security Devices Sales and Growth Rate (2019-2025) & (K Units)
Figure 40. Italy Embedded Security Devices Sales and Growth Rate (2019-2025) & (K Units)
Figure 41. Russia Embedded Security Devices Sales and Growth Rate (2019-2025) & (K Units)
Figure 42. Asia Pacific Embedded Security Devices Sales and Growth Rate (K Units)
Figure 43. Asia Pacific Embedded Security Devices Sales Market Share by Region in 2023
Figure 44. China Embedded Security Devices Sales and Growth Rate (2019-2025) & (K Units)
Figure 45. Japan Embedded Security Devices Sales and Growth Rate (2019-2025) & (K Units)
Figure 46. South Korea Embedded Security Devices Sales and Growth Rate (2019-2025) & (K Units)
Figure 47. India Embedded Security Devices Sales and Growth Rate (2019-2025) & (K Units)
Figure 48. Southeast Asia Embedded Security Devices Sales and Growth Rate (2019-2025) & (K Units)
Figure 49. South America Embedded Security Devices Sales and Growth Rate (K Units)
Figure 50. South America Embedded Security Devices Sales Market Share by Country in 2023
Figure 51. Brazil Embedded Security Devices Sales and Growth Rate (2019-2025) & (K Units)
Figure 52. Argentina Embedded Security Devices Sales and Growth Rate (2019-2025) & (K Units)
Figure 53. Columbia Embedded Security Devices Sales and Growth Rate (2019-2025) & (K Units)
Figure 54. Middle East and Africa Embedded Security Devices Sales and Growth Rate (K Units)
Figure 55. Middle East and Africa Embedded Security Devices Sales Market Share by Region in 2023
Figure 56. Saudi Arabia Embedded Security Devices Sales and Growth Rate (2019-2025) & (K Units)
Figure 57. UAE Embedded Security Devices Sales and Growth Rate (2019-2025) & (K Units)
Figure 58. Egypt Embedded Security Devices Sales and Growth Rate (2019-2025) & (K Units)
Figure 59. Nigeria Embedded Security Devices Sales and Growth Rate (2019-2025) & (K Units)
Figure 60. South Africa Embedded Security Devices Sales and Growth Rate (2019-2025) & (K Units)
Figure 61. Global Embedded Security Devices Production Market Share by Region (2019-2025)
Figure 62. North America Embedded Security Devices Production (K Units) Growth Rate (2019-2025)
Figure 63. Europe Embedded Security Devices Production (K Units) Growth Rate (2019-2025)
Figure 64. Japan Embedded Security Devices Production (K Units) Growth Rate (2019-2025)
Figure 65. China Embedded Security Devices Production (K Units) Growth Rate (2019-2025)
Figure 66. Global Embedded Security Devices Sales Forecast by Volume (2026-2034) & (K Units)
Figure 67. Global Embedded Security Devices Market Size Forecast by Value (2026-2034) & (M USD)
Figure 68. Global Embedded Security Devices Sales Market Share Forecast by Type (2025-2032)
Figure 69. Global Embedded Security Devices Market Share Forecast by Type (2025-2032)
Figure 70. Global Embedded Security Devices Sales Forecast by Application (2025-2032)
Figure 71. Global Embedded Security Devices Market Share Forecast by Application (2025-2032)