
Key Statistics
Key Takeaways
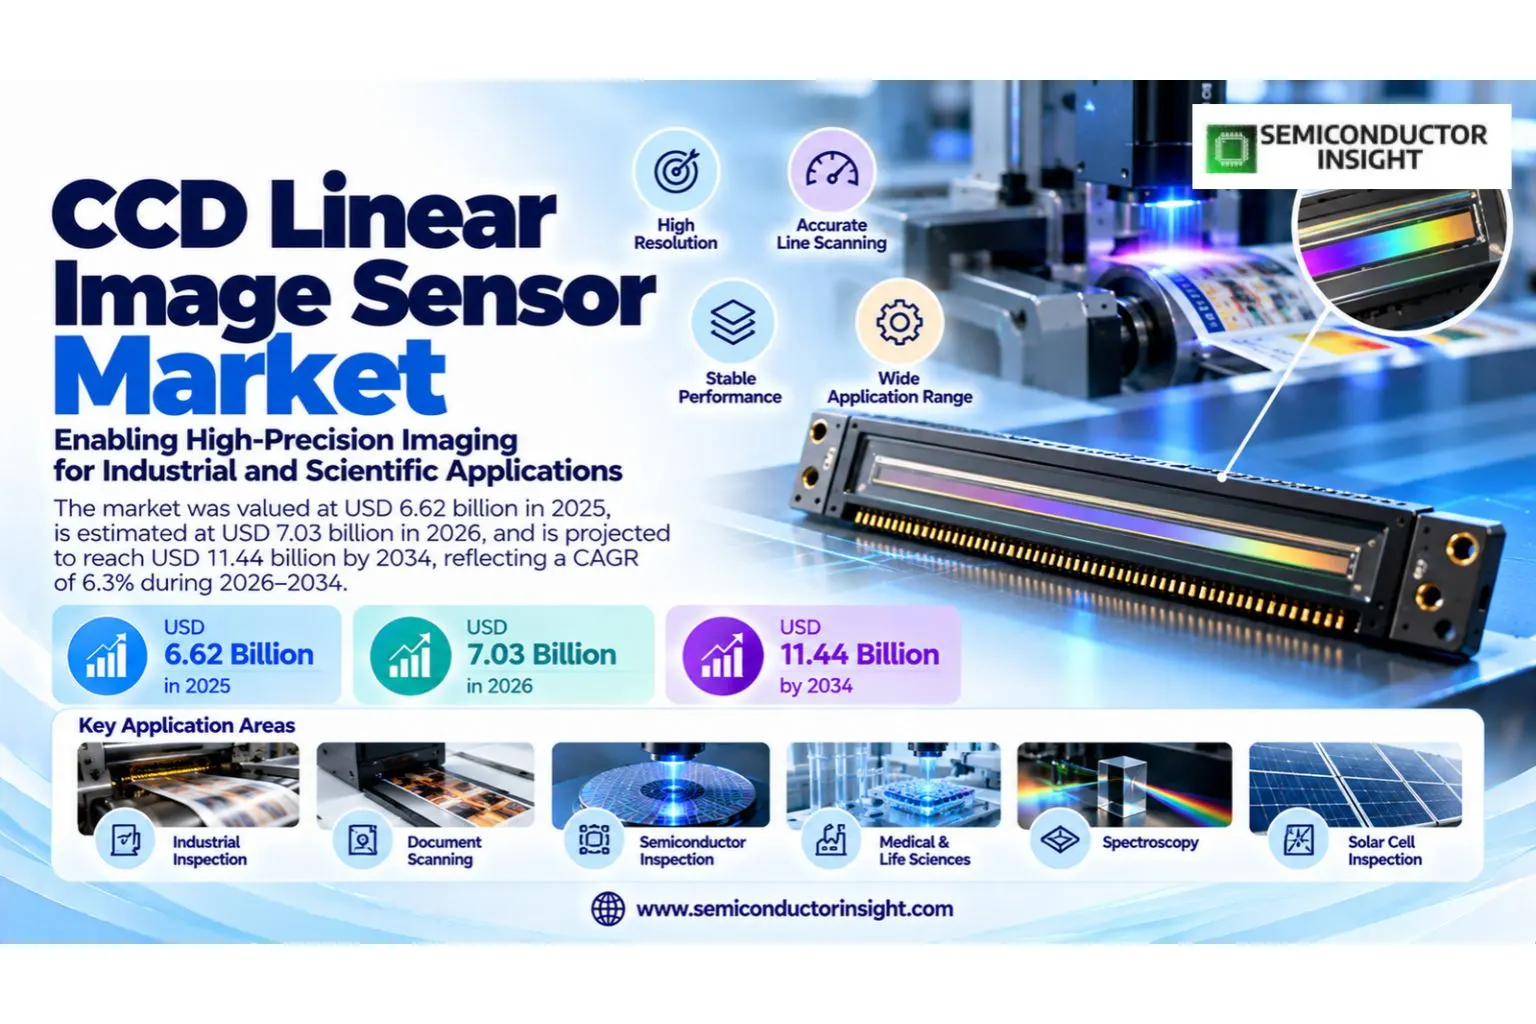
- The market is valued at USD 6.62 billion in 2025 and is projected to reach USD 11.44 billion by 2034, representing a 6.3% CAGR over 2026–2034.
- Back-Thinned CCD is a major product segment, while adjacent technology variants are expanding as performance, integration and cost requirements evolve.
- Industrial Inspection is a leading application area, supported by rising deployment across Spectroscopy & Analytical Instruments, Document Scanning.
- Asia Pacific is the largest market in 2025, reflecting the current concentration of demand, manufacturing capacity and ecosystem maturity.
CCD Linear Image Sensor Market Overview
CCD Linear Image Sensor devices use a one-dimensional array of light-sensitive pixels to capture a line of an image and transfer accumulated charge sequentially to an output amplifier. When either the object or sensor moves, repeated line captures build a two-dimensional image with precise spatial sampling, making the technology well suited to inspection, scanning and spectroscopy.
Although CMOS line sensors continue to gain share because they integrate more electronics and can operate at lower power, CCD remains relevant where low noise, charge-transfer uniformity, broad spectral response or established instrument designs are important. Suppliers therefore focus on high sensitivity, stable calibration, electronic shutter functions and specialized back-thinned structures.
Segment Analysis: By Type
Front-illuminated CCDs remain important in industrial line-scan systems because they provide proven sensitivity and mature readout architectures, while back-thinned devices command premium value in spectroscopy and low-light scientific applications. This segmentation increasingly reflects distinct cost-performance tradeoffs, so customers compare not only specifications but also integration effort, reliability evidence and expected product lifecycle before selecting a platform.
| Type | Market relevance |
|---|---|
| Back-Thinned CCD | Premium sensitivity for spectroscopy and low-light use. |
| Front-Illuminated CCD | Commercial workhorse for industrial line scanning. |
Segment Analysis: By Application
Industrial inspection is the largest application because line sensors are well suited to continuous webs, sorting, dimensional measurement and high-speed quality control. Spectroscopy creates smaller but higher-value demand for broad spectral response and low noise. Application requirements differ materially in duty cycle, environmental conditions and qualification burden, which makes customer-specific engineering support an important part of supplier competitiveness.
| Application | Market relevance |
|---|---|
| Industrial Inspection | Largest installed market in machine vision. |
| Spectroscopy & Analytical Instruments | High-value analytical and scientific use. |
| Document Scanning | Mature office and archival imaging. |
| Scientific Imaging | Research and measurement applications. |
| Others | Specialty OEM systems. |
Segment Analysis: By Pixel Count
2K–4K devices balance field of view, optical complexity and line rate for many industrial systems, while above-4K products target finer inspection and large-web applications. Higher pixel count can improve spatial resolution but also raises readout, optics and data-processing requirements, making system-level optimization essential.
| Pixel Count | Market relevance |
|---|---|
| Below 2K | Compact and lower-cost instruments. |
| 2K–4K | Mainstream industrial resolution. |
| Above 4K | Fine inspection and wide-web imaging. |
Segment Analysis: By Spectral Range
VIS-NIR supports broad industrial imaging, while UV-VIS is important in spectroscopy and materials analysis. Specialty sensors extend response into application-specific bands and scientific measurement. Spectral choice is driven by the target material or signal, optical source and detector sensitivity, so application-specific performance matters more than a single universal specification.
| Spectral Range | Market relevance |
|---|---|
| UV-VIS | Spectroscopy and UV-sensitive measurement. |
| VIS-NIR | Industrial inspection and machine vision. |
| Specialty | Application-specific optical sensing. |
Regional Analysis
Asia Pacific leads through industrial automation, electronics manufacturing and Japanese imaging-sensor expertise, while North America and Europe provide substantial scientific, analytical and high-end machine-vision demand. Regional leadership also reflects the density of qualified suppliers, engineering support, local manufacturing investment and the speed at which new CCD Linear Image Sensor designs can move from evaluation into repeat production.
| Region | 2025 Position | Growth Outlook | Demand Profile |
|---|---|---|---|
| Asia Pacific | Largest | Strong | Industrial inspection and sensor manufacturing led |
| North America | High-value specialist market | Moderate-strong | Scientific, industrial and analytical led |
| Europe | Strong industrial market | Moderate | Machine vision and instrumentation led |
| South America | Emerging | Selective | Industrial inspection and research led |
| Middle East & Africa | Developing | Selective | Research and industrial led |
Detailed Regional Blocks
Why is Asia Pacific important to this market?
Asia Pacific leads because China, Japan and South Korea combine high-volume industrial manufacturing with strong sensor and optical-instrument ecosystems. Japan remains particularly important in CCD technology and precision photonics. In Asia Pacific, procurement decisions also depend on service coverage, qualification resources, logistics and long-term availability, which can materially affect adoption even when underlying technology performance is similar.
| Country / Subregion | Role | Market Context |
|---|---|---|
| Japan | Technology and supplier hub | Hamamatsu and other imaging specialists support industrial and scientific CCD demand. |
| China | Automation and scanning market | Factory inspection and document imaging create volume. |
| South Korea | Electronics manufacturing | Display and semiconductor inspection support high-resolution sensors. |
- Hamamatsu’s S12551-2048 is a front-illuminated 2048-pixel CCD line sensor with 40MHz maximum readout frequency and industrial sorting applications.
- Hamamatsu maintains a broad catalog of CCD, CMOS and NMOS line sensors for industrial and spectroscopic use.
- Asian manufacturing lines generate recurring demand for line-scan imaging in web inspection, sorting and dimensional measurement.
Why is North America important to this market?
North America is a high-value market for spectroscopy, scientific instruments and machine vision. CCD devices remain attractive where mature instrument calibration and optical performance matter more than the newest sensor architecture. In North America, procurement decisions also depend on service coverage, qualification resources, logistics and long-term availability, which can materially affect adoption even when underlying technology performance is similar.
| Country / Subregion | Role | Market Context |
|---|---|---|
| United States | Largest regional demand | Industrial inspection and analytical instrumentation support CCD line sensors. |
| Canada | Scientific imaging niche | Research and optical systems create specialized demand. |
| Mexico | Manufacturing inspection | Factory automation creates downstream line-scan demand. |
- Back-thinned CCD architectures remain valuable in analytical instruments because they can provide broad spectral response and strong quantum efficiency.
- Industrial customers often retain qualified CCD platforms for many years because changing a sensor can require optics and calibration redesign.
- Machine-vision systems increasingly compare CCD against high-speed CMOS alternatives based on total system performance rather than sensor cost alone.
Why is Europe important to this market?
Europe has a strong industrial-automation and scientific-instrument base, especially in Germany and Switzerland. Demand concentrates on precise inspection, spectroscopy and measurement applications. In Europe, procurement decisions also depend on service coverage, qualification resources, logistics and long-term availability, which can materially affect adoption even when underlying technology performance is similar.
| Country / Subregion | Role | Market Context |
|---|---|---|
| Germany | Machine-vision hub | Automation and quality control support line sensors. |
| Switzerland | Precision instrumentation | Analytical systems create high-value demand. |
| United Kingdom | Scientific imaging | Research and spectroscopy support specialty CCDs. |
- European machine builders value long product lifecycles and stable calibration for industrial sensors.
- Spectrophotometers use line sensors because a dispersed spectrum can be captured along one dimension.
- CMOS competition is strongest in high-speed inspection, while CCD retains niches requiring proven low-noise behavior.
Why is South America important to this market?
South America is a smaller market centered on manufacturing inspection and university or laboratory instrumentation. Brazil provides the largest installed base. In South America, procurement decisions also depend on service coverage, qualification resources, logistics and long-term availability, which can materially affect adoption even when underlying technology performance is similar.
| Country / Subregion | Role | Market Context |
|---|---|---|
| Brazil | Largest regional market | Factory automation and research support line-sensor use. |
| Argentina | Research niche | Analytical instruments create small demand. |
| Chile | Industrial inspection | Mining and manufacturing create selected applications. |
- Most CCD line sensors are imported inside cameras or instruments.
- Industrial users prioritize replacement availability for long-lived systems.
- Local market growth follows capital spending on automation and analytical equipment.
Why is Middle East & Africa important to this market?
Middle East and Africa demand is developing through laboratories, industrial inspection and scientific instrumentation, with relatively limited direct sensor integration. In Middle East & Africa, procurement decisions also depend on service coverage, qualification resources, logistics and long-term availability, which can materially affect adoption even when underlying technology performance is similar.
| Country / Subregion | Role | Market Context |
|---|---|---|
| Israel | Imaging and research | Photonics and machine vision create specialized demand. |
| United Arab Emirates | Industrial and research niche | Advanced manufacturing projects support selected systems. |
| South Africa | Research and industry | Laboratories and mining inspection create demand. |
- Scientific instruments often use imported sensor modules rather than locally integrated bare devices.
- Industrial sorting and inspection create recurring line-scan use cases.
- The market remains dependent on global sensor suppliers and specialist camera vendors.
Competitive Landscape
Hamamatsu, Toshiba, Sony and specialist imaging vendors compete across CCD and adjacent CMOS line-sensor markets. Competitive differentiation centers on spectral response, pixel geometry, charge-transfer efficiency, line rate, noise, shutter functions and long-term supply for instrument OEMs.
| Company | Position | Relevant capability |
|---|---|---|
| Hamamatsu Photonics | Key participant | Broad CCD/CMOS/NMOS line-sensor portfolio for industrial, spectroscopic and scientific applications. |
| Toshiba | Key participant | Competes through product breadth, integration capability, qualification and customer support. |
| Sony Semiconductor Solutions | Key participant | Image-sensor technology supplier with strong industrial and scientific imaging capabilities. |
| Teledyne DALSA | Key participant | Major line-scan imaging supplier, increasingly centered on advanced CMOS sensors and cameras. |
| Canon | Key participant | Competes through product breadth, integration capability, qualification and customer support. |
| Samsung Electronics | Key participant | Competes through product breadth, integration capability, qualification and customer support. |
| OmniVision | Key participant | Competes through product breadth, integration capability, qualification and customer support. |
Production Capacity Analysis
CCD line-sensor capacity relies on specialized image-sensor wafer processes, charge-transfer structures, low-noise output stages and packaging with optically controlled windows. Volumes are much lower than smartphone CIS, so long-term process continuity matters. Scaling output without degrading consistency requires disciplined process control, robust incoming-material specifications and final test coverage that detects drift before product reaches high-value customer systems.
Japan retains important specialist production, while broader industrial camera manufacturing is global. Effective supply can tighten when mature CCD processes are discontinued because OEMs may face costly optical and electronics redesigns. As demand expands, second-source planning and regional service capability become increasingly important because customers want supply continuity without repeating lengthy qualification work for every production change.
Market Dynamics
The main market tension is CCD versus CMOS. CMOS line sensors continue improving in speed, integration and power efficiency, while CCD retains niches where charge-transfer uniformity, mature low-noise performance or legacy instrument calibration provide meaningful value. This is changing competitive behavior because vendors increasingly sell a complete performance and integration proposition rather than a single component or software feature in isolation.
Industrial customers often optimize total inspection performance rather than sensor architecture. A well-qualified CCD can remain in production for years if it meets line rate, noise and spectral requirements, creating stable replacement demand even as new platforms move toward CMOS. Buyers are consequently evaluating total ownership cost, qualification effort and roadmap stability over the life of a program rather than relying on a single benchmark or initial purchase price.
Market Drivers
| Factor | Analyst Interpretation |
|---|---|
| Industrial automation | Web inspection, sorting and quality control use one-dimensional imaging extensively. |
| Analytical instrumentation | Spectroscopy benefits from broad spectral response and stable line arrays. |
| Long instrument lifecycles | Qualified CCD designs can remain in production for many years. |
| Scientific measurement | Low-noise and back-thinned CCD variants support research applications. |
Market Restraints
| Factor | Analyst Interpretation |
|---|---|
| CMOS substitution | Modern CMOS line sensors offer higher integration and often lower power. |
| Mature process dependence | CCD production relies on specialized older processes that can face lifecycle risk. |
| Lower unit volumes | Specialist markets limit scale economics compared with mainstream area sensors. |
| Readout electronics | CCD architectures typically require more external clocking and analogue support than integrated CMOS. |
Market Opportunities
| Factor | Analyst Interpretation |
|---|---|
| UV and spectroscopy CCDs | Back-thinned structures retain advantages in specialized spectral measurement. |
| Legacy-system replacement | Industrial OEMs need compatible sensors for long-lived installed equipment. |
| High-dynamic-range inspection | Improved charge handling can extend CCD use in demanding measurement. |
| Hybrid camera platforms | Vendors can offer both CCD and CMOS options around common optical/mechanical systems. |
Supply Chain Analysis
The supply chain spans sensor wafer fabrication, optically controlled packaging, camera electronics and system integration. For scientific and industrial customers, calibration and long-term component availability are often as important as raw sensor specification. Traceability and coordination between upstream material or component suppliers, integrators and final OEMs are critical because failures found late in the chain can be far more expensive than the underlying part itself.
| Supply Chain Stage | Role in the Market |
|---|---|
| CCD wafer fabrication | Pixel arrays, transfer registers and output amplifiers are manufactured on specialist processes. |
| Optical packaging | Sensors receive ceramic or specialty packages and controlled optical windows. |
| Camera and instrument electronics | Clocking, analogue front ends and ADCs convert CCD output into digital data. |
| Industrial and scientific integration | Sensors enter line-scan cameras, spectrometers, scanners and measurement systems. |
Recent Developments
| Date | Development | Source |
|---|---|---|
| 2026 | Hamamatsu continues active support for the S12551-2048 front-illuminated CCD linear sensor, with 2048 pixels and up to 40MHz readout for industrial sorting. | Hamamatsu Photonics |
| 2026 | Hamamatsu's current image-sensor portfolio spans CCD, CMOS and NMOS line sensors for industry, spectroscopy and scientific measurement, illustrating ongoing coexistence of sensor architectures. | Hamamatsu Photonics |
| 2026 | Teledyne DALSA continues to advance CMOS line-scan cameras such as Linea, highlighting the competitive pressure CCD faces from high-speed CMOS technology. | Teledyne DALSA |
Report Scope & Segmentation
| Scope Item | Coverage |
|---|---|
| Base Year | 2025 |
| Estimated Year | 2026 |
| Forecast Period | 2026–2034 |
| 2025 Market Size | USD 6.62 billion |
| 2026 Estimated Size | USD 7.03 billion |
| 2034 Forecast Size | USD 11.44 billion |
| CAGR (2026–2034) | 6.3% |
| Largest Market in 2025 | Asia Pacific |
| Category | Imaging Sensors / CCD Line Sensors / Industrial Vision |
| By Type | Back-Thinned CCD, Front-Illuminated CCD |
| By Application | Industrial Inspection, Spectroscopy & Analytical Instruments, Document Scanning, Scientific Imaging, Others |
| By Pixel Count | Below 2K, 2K–4K, Above 4K |
| By Spectral Range | UV-VIS, VIS-NIR, Specialty |
Frequently Asked Questions
What is the 2025 market size of the CCD Linear Image Sensor market?
The market is valued at USD 6.62 billion in 2025.
What is the projected 2034 market size of the CCD Linear Image Sensor market?
The market is projected to reach USD 11.44 billion by 2034.
What is the CAGR of the CCD Linear Image Sensor market from 2026 to 2034?
The market is expected to expand at a CAGR of 6.3% during 2026–2034.
Which region leads the CCD Linear Image Sensor market?
Asia Pacific is the largest market in 2025 based on the current demand, manufacturing and deployment structure.
Which type segment is important in the CCD Linear Image Sensor market?
Back-Thinned CCD is a major segment, while adjacent product variants are gaining share as performance and integration requirements evolve.
What is the main application for CCD Linear Image Sensor products?
Industrial Inspection is a leading application, with additional growth coming from Spectroscopy & Analytical Instruments, Document Scanning.
What drives growth in the CCD Linear Image Sensor market?
Web inspection, sorting and quality control use one-dimensional imaging extensively.
What is a key restraint for the CCD Linear Image Sensor market?
Modern CMOS line sensors offer higher integration and often lower power.
Which companies participate in the CCD Linear Image Sensor market?
Key participants include Hamamatsu Photonics, Toshiba, Sony Semiconductor Solutions, Teledyne DALSA, Canon, alongside other specialized suppliers and system companies.
What technology trend is shaping the CCD Linear Image Sensor market?
Back-thinned structures retain advantages in specialized spectral measurement.
Research Sources & Evidence Base
View research sources used for this overview.
- Hamamatsu Photonics — S12551-2048 CCD Linear Image Sensor: Current 2048-pixel CCD specifications and industrial applications. Source
- Hamamatsu Photonics — CCD / CMOS / NMOS Image Sensors: Current product portfolio and line-sensor application categories. Source
- Teledyne DALSA — Linea Line Scan Cameras: Current CMOS line-scan technology illustrating competitive architecture trends. Source

Get Sample Report PDF for Exclusive Insights
Report Sample Includes
- Table of Contents
- List of Tables & Figures
- Charts, Research Methodology, and more...
 Download Sample Report PDF


