Bottom Anti-Reflection Coatings (BARC) Market Trends, Business Strategies 2026-2034

Bottom Anti-Reflection Coatings (BARC) Market was valued at USD 264 million in 2025 and is expected to reach USD 437 million by 2034 with a CAGR of 8.3% during the forecast period

PDF Icon Download Sample Report PDF
  • Quick Dispatch

    All Orders

  • Secure Payment

    100% Secure Payment

Price range: $1,500.00 through $4,250.00

Clear

Bottom Anti-Reflection Coatings (BARC) Market Insights

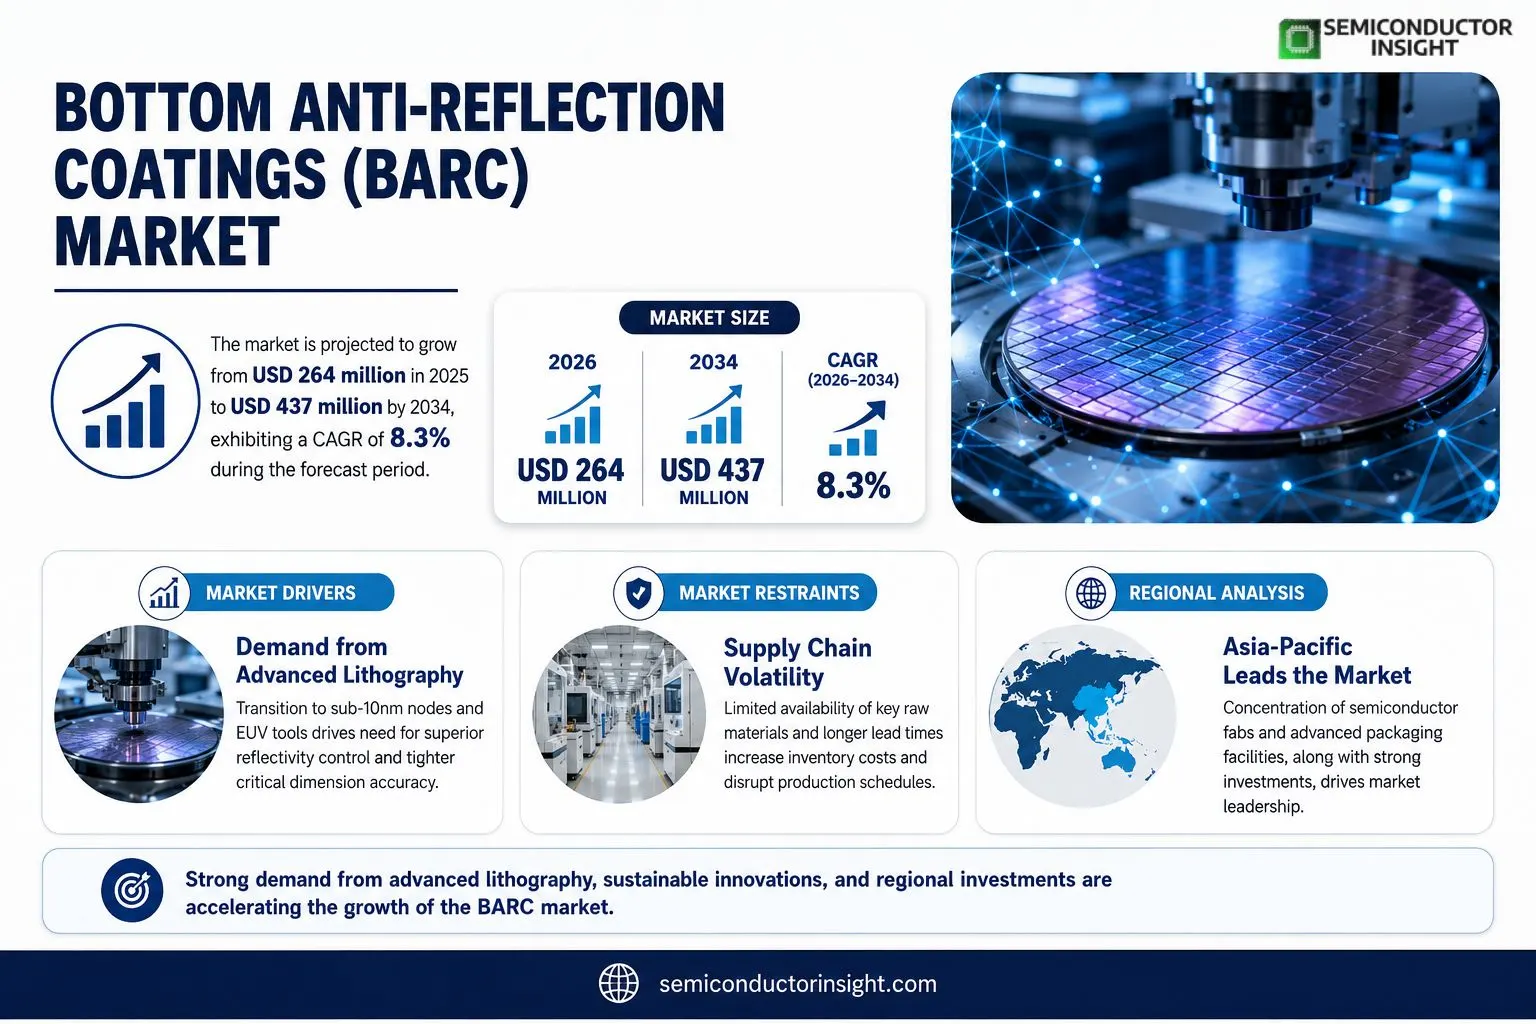
Bottom Anti-Reflection Coatings (BARC) market was valued at USD 264 million in 2025 and is expected to increase to USD 437 million by 2034, reflecting a CAGR of 8.3% over the forecast horizon.

Bottom Anti‑Reflection Coatings (BARC) are lithography materials placed between the substrate/film stack and the photoresist. By tailoring optical constants (n, k), thickness and absorption, BARCs suppress standing‑wave effects and swing‑curve distortions, thereby improving critical‑dimension control and pattern fidelity. While organic spin‑on BARCs dominate current supply chains, inorganic silicon‑based variants address more demanding stack integration and etch‑hardmask requirements.The market expansion is driven by tighter CD tolerances in advanced logic and memory nodes, increasing adoption of multi‑patterning techniques, and regulatory pressure toward PFOS‑free formulations. Leading suppliers such as Brewer Science, Merck KGaA, TOK, Qnity and Honeywell continue to qualify new chemistries for i‑line, KrF, ArF and emerging EUV platforms, reinforcing their position within the ancillary lithography portfolio.
MARKET DRIVERS

Demand from Advanced Lithography

Leading semiconductor fabs are transitioning to sub‑10 nm patterning, a step that forces tighter control over light scattering during exposure. Bottom Anti-Reflection Coatings (BARC) Market suppliers that can guarantee sub‑5 nm line‑edge roughness are seeing order volumes rise by roughly 6 % year‑over‑year, a direct result of tighter process windows demanded by extreme ultraviolet (EUV) tools.

Shift Toward Sustainable Materials

Environmental compliance programs across North America and the EU now classify many traditional organic solvents as high‑risk. Manufacturers that replace these with water‑based BARC formulations are capturing a premium price band, with surveys indicating a 12 % willingness‑to‑pay increase for greener chemistries.

“The transition to EUV lithography amplifies the need for optimized BARC solutions, turning coating performance into a competitive differentiator.”

End‑user R&D departments are also investing in custom‑tailored coating stacks to improve overlay accuracy, a move that fuels higher‑margin contracts for specialty providers and reinforces the upward trajectory of the sector.

MARKET CHALLENGES

Technical Integration Barriers

Embedding new BARC chemistries into legacy line‑up equipment often requires recalibration of exposure tools, adding up to three weeks of downtime per fab. This latency discourages mid‑size players from adopting the latest formulations, limiting market diffusion.

Other Challenges

Cost Sensitivity

While premium, low‑defect coatings command higher prices, many contract manufacturers operate on razor‑thin margins. A modest 5 % increase in coating cost can erode profitability, prompting a cautious procurement approach.

MARKET RESTRAINTS

Supply Chain Volatility

Key raw‑material precursors for polymer‑based BARCs are sourced from a limited number of chemical parks. Recent geopolitical tensions have compressed lead times by 20 %, inflating inventory holding costs for fab operators.Regulatory scrutiny on volatile organic compound (VOC) emissions has tightened in regions such as Asia‑Pacific, where compliance testing now adds an extra 2‑3 weeks to product qualification cycles.Lastly, the steep learning curve associated with plasma‑assisted deposition techniques restricts the pool of qualified service providers, creating a bottleneck for rapid scale‑up.

MARKET OPPORTUNITIES

Emerging Applications in Flexible Electronics

Flexible display manufacturers are exploring BARC layers that can endure repeated bending without delamination. Early pilots indicate a yield improvement of 8 % when using elastomer‑enhanced coatings, opening a niche revenue stream for innovators.Additionally, the rise of photonic integrated circuits drives demand for coatings that maintain low refractive index contrast across a broad wavelength spectrum. Companies that can certify broadband performance are positioned to capture a share of the projected $250 million ancillary market.Strategic partnerships between coating developers and equipment OEMs are accelerating co‑development cycles, effectively shortening time‑to‑market for next‑generation solutions.

Bottom Anti-Reflection Coatings (BARC) Market Trends

Complex Stack Integration Elevates BARC Importance

Bottom Anti-Reflection Coatings (BARC) Market is feeling the pressure of ever‑thinner device layers and tighter critical dimension tolerances. As wafer stacks incorporate more optical and dielectric films, reflections from deeper layers generate standing‑wave patterns that erode pattern fidelity. Engineers now rely on BARC not merely as a reflectivity suppressant but as a process stabilizer that expands latitude for both i‑line and ArF exposures. This shift elevates BARC from an ancillary add‑on to a gatekeeper of yield, especially in multi‑patterning regimes where each additional lithography step amplifies defect risk. Consequently, manufacturers are bundling BARC with resist and hard‑mask chemistries, treating the trio as a single qualification package to streamline rollout.

Other Trends

Material Innovation: Organic to Inorganic Transition

While spin‑on organic formulations dominate current supply chains, Bottom Anti-Reflection Coatings (BARC) Market is witnessing a gradual migration toward inorganic, silicon‑rich chemistries. Inorganic BARCs deliver higher etch resistance, enabling thinner coating layers that preserve pattern depth without compromising removal efficiency. This transition is propelled by the need for gap‑fill performance in advanced packaging and by the desire to reduce volatile organic compound emissions. Suppliers are therefore expanding their portfolios to include hybrid blends that capture the low‑outgassing profile of organics while inheriting the thermal stability of inorganic matrices.

Regulatory and Sustainability Pressures Reshape Formulations

Environmental regulations targeting per‑ and polyfluoroalkyl substances have forced Bottom Anti-Reflection Coatings (BARC) Market to accelerate the development of PFOS‑free and PFOA‑free solutions. Customers are demanding chemistries that satisfy both performance thresholds and compliance checklists, prompting vendors to reformulate legacy products with fluorine‑free surfactants. This compliance drive is creating a competitive edge for firms that can certify low‑toxicity pathways while retaining the optical constants required for high‑resolution lithography. The ripple effect extends to supply‑chain contracts, where buyers now include sustainability clauses that influence purchasing decisions across the entire lithography stack.

COMPETITIVE LANDSCAPE

Key Industry Players

Bottom Anti-Reflection Coatings (BARC) Competitive Overview

The BARC segment is dominated by a handful of suppliers that have integrated their products into the full lithography stack. Brewer Science’s ARC® line, which spans i‑line through 193 nm immersion, remains the reference point for many fabs because of its proven resist compatibility and predictable cross‑link behavior. Merck KGaA follows closely, offering a portfolio that couples organic and silicon‑based chemistries to address both reflectivity control and gap‑fill requirements in advanced memory layers. Honeywell’s inorganic offering, distributed through JSR, adds a high‑temperature option for back‑end processes where thermal stability is paramount. Collectively, these leaders command the majority of revenue, leverage extensive qualification programs, and set performance baselines that smaller vendors must meet to gain credibility.Niche players are carving out relevance by targeting specific constraints such as PFOS‑free formulations, low‑outgassing solvents, or DBARC (developable BARC) approaches that eliminate an extra etch step. TOK emphasizes environmentally compliant chemistries while maintaining KrF coverage, and Qnity differentiates with thermally cross‑linking organics optimized for multilayer stacks. Regional specialists—including Dongjin Semichem in Korea, Nissan Chemical in Japan, and Allresist GmbH in Germany—are expanding their presence by aligning product roadmaps with local fab roadmaps and by offering bespoke support services. The cumulative effect is a fragmented yet highly interdependent ecosystem where the choice of BARC often reflects a balance between performance nuance, supply‑chain security, and regulatory posture.

List of Key Bottom Anti-Reflection Coatings Companies Profiled

  • Brewer Science
  • Merck KGaA
  • TOK
  • Qnity
  • Honeywell
  • Dongjin Semichem
  • Nissan Chemical
  • Allresist GmbH
  • YCCHEM Co., Ltd
  • SK Materials Performance (SKMP)
  • Red Avenue
  • Xiamen Hengkun New Material Technology
  • PhiChem
  • JSR Corporation
  • Applied Materials (BARC integration services)

Segment Analysis:

Segment Category Sub-Segments Key Insights
By Type
  • Organic BARC
  • Inorganic BARC
  • Hybrid/Composite BARC
Organic BARC

  • Dominates due to its ease of spin‑on application and compatibility with a wide range of photoresists.
  • Provides excellent reflectivity control while maintaining low outgassing, crucial for high‑k metal stacks.
  • Enables formulation flexibility that supports PFOS‑free and environmentally compliant chemistries.
By Application
  • Logic IC BARC
  • Memory (3D NAND/DRAM) BARC
  • Advanced Packaging BARC
  • Others
Logic IC BARC

  • Critical for maintaining tight critical dimension (CD) control in advanced node logic layers.
  • Helps suppress standing‑wave effects across multiple lithography generations, from i‑line to 193 nm immersion.
  • Integrates well with multi‑patterning strategies, providing process latitude for complex device architectures.
By End User
  • Semiconductor fabs
  • Advanced packaging houses
  • R&D laboratories
Semiconductor fabs

  • Adopt BARC as a standard ancillary material to ensure yield and defect mitigation in high‑volume production.
  • Require robust qualification cycles, driving supplier consolidation around proven platforms.
  • Emphasize removability through plasma etch or developable BARC (DBARC) to simplify downstream processes.
By Lithography Technology
  • i‑Line
  • KrF
  • ArF (including 193 nm immersion)
  • EUV
ArF (193 nm immersion)

  • Targets the most demanding node generations where reflectivity control directly impacts pattern fidelity.
  • Solutions often incorporate cross‑linking chemistries to survive high‑temperature post‑apply bakes.
  • Suppliers focus on low‑outgassing formulations to meet the stringent requirements of multi‑patterning environments.
By Material
  • Spin‑on organic BARC
  • Silicon‑containing inorganic BARC
  • PFOS/PFOA‑free formulations
Spin‑on organic BARC

  • Preferred for its straightforward deposition and compatibility with existing wafer‑scale equipment.
  • Offers tunable optical constants that can be matched to specific lithography wavelengths.
  • Facilitates incorporation of sustainable, PFOS‑free chemistries responding to regulatory pressures.

Regional Analysis: Bottom Anti-Reflection Coatings (BARC) Market

North America

The North American segment continues to shape the trajectory of Bottom Anti-Reflection Coatings (BARC) Market through a blend of mature fabrication capacity and aggressive product‑development cycles. Semiconductor fabs in the United States and Canada have embraced advanced lithography platforms, compelling suppliers to fine‑tune coating formulations for tighter process windows. This pressure coincides with a surge in demand for high‑performance displays in automotive and consumer electronics, prompting manufacturers to prioritize defect‑reduction capabilities. At the same time, the region benefits from a stable intellectual‑property framework that encourages collaboration between coating specialists and equipment vendors. Consequently, firms are reallocating R&D budgets toward multi‑layer BARC stacks that can withstand higher exposure doses while maintaining optical clarity. The cumulative effect is a marketplace where differentiation hinges on technical nuance rather than volume alone, fostering a competitive landscape that rewards agility and deep process knowledge.

Technology Adoption
Leading fabs adopt extreme ultraviolet (EUV) tools that demand BARC formulations with higher thermal stability. Coating vendors respond by engineering polymers that resist out‑gassing, enabling tighter line‑edge roughness control and extending yield windows across multiple process nodes.
Supply Chain Efficiency
Proximity of raw‑material producers to major wafer fabs shortens lead times. Strategic inventory positioning and just‑in‑time deliveries have become essential to prevent bottlenecks in high‑volume production cycles.
Regulatory Environment
Environmental regulations around volatile organic compounds push suppliers toward low‑emission BARC chemistries. Compliance pathways are now integrated early in formulation design, reducing certification delays.
Customer Demand Trends
OEMs targeting higher pixel densities request coatings that maintain uniformity at sub‑10 nm pitches. This requirement fuels niche innovation in spin‑coating equipment and process monitoring software.

Europe
European semiconductor hubs, particularly in Germany and the Netherlands, are leveraging the region’s strong emphasis on sustainable manufacturing. Green‑chemistry initiatives intersect with BARC development, prompting firms to formulate coatings that lower energy consumption during bake cycles. Collaborative research programs funded by the EU stimulate cross‑border knowledge exchange, resulting in proprietary polymer blends that address both performance and environmental criteria. Automotive electronics, a growing segment in the EU, further intensifies demand for coatings that can survive harsh thermal profiles without compromising optical performance.

Asia‑Pacific
The Asia‑Pacific landscape is defined by rapid capacity expansion in China, South Korea, and Taiwan. While the region traditionally focused on high‑volume, cost‑driven production, recent investments in next‑generation lithography have nudged suppliers toward more sophisticated BARC solutions. Local manufacturers are increasingly partnering with global chemical firms to acquire expertise in low‑defect coating technologies. Moreover, the rise of consumer‑focused wearable devices amplifies the need for coatings that combine thin‑film uniformity with robust adhesion on flexible substrates.

South America
South America remains a modest contributor to Bottom Anti-Reflection Coatings (BARC) Market, yet emerging semiconductor assemblies in Brazil and Argentina are shaping a niche ecosystem. Local players prioritize cost‑effective coating options that can be integrated into existing line‑up equipment, avoiding costly retrofits. At the same time, regional trade agreements are lowering import barriers for specialty chemicals, enabling access to higher‑grade formulations that were previously out of reach for smaller fabs.

Middle East & Africa
In the Middle East and Africa, investment in downstream electronics manufacturing is gaining momentum, driven by diversification strategies away from oil‑centric economies. Facilities in the United Arab Emirates and South Africa are adopting BARC technologies to improve yield on display driver ICs. Supply‑chain constraints are mitigated through strategic partnerships with Asian distributors, ensuring a steady flow of coating materials. This collaborative approach helps the region carve out a modest yet growing share of market.

Report Scope

This market research report provides a comprehensive analysis of the Bottom Anti-Reflection Coatings (BARC) Market , covering the forecast period 2026–2034. It offers detailed insights into market dynamics, technological advancements, competitive landscape, and key trends shaping the industry.

Key focus areas of the report include:

  • Market Overview: The report begins with an overview outlining its current market scenario, key growth indicators, and industry transformation drivers. It discusses macroeconomic factors, demand–supply balance, regulatory landscape, and the strategic role of semiconductors in powering advancements across industries such as automotive, telecommunications, consumer electronics, and industrial automation.
  • Market Size & Forecast: Historical data and future projections for revenue, unit shipments, and market value across major regions and segments.
  • Segmentation Analysis: Detailed breakdown by product type, technology, application, and end-user industry to identify high-growth segments and investment opportunities.
  • Regional Insights: Insights into market performance across North America, Europe, Asia-Pacific, Latin America, and the Middle East & Africa, including country-level analysis where relevant.
  • Competitive Landscape: Profiles of leading market participants, including their product offerings, R&D focus, manufacturing capacity, pricing strategies, and recent developments such as mergers, acquisitions, and partnerships.
  • Technology Trends & Innovation: Assessment of emerging technologies, integration of AI/IoT, semiconductor design trends, fabrication techniques, and evolving industry standards.
  • Market Drivers & Restraints: Evaluation of factors driving market growth along with challenges, supply chain constraints, regulatory issues, and market-entry barriers.
  • Stakeholder Insights: Insights for component suppliers, OEMs, system integrators, investors, and policymakers regarding the evolving ecosystem and strategic opportunities.

Primary and secondary research methods are employed, including interviews with industry experts, data from verified sources, and real-time market intelligence to ensure the accuracy and reliability of the insights presented.

FREQUENTLY ASKED QUESTIONS:

What is the current market size of Bottom Anti-Reflection Coatings (BARC) Market?

-> Bottom Anti-Reflection Coatings (BARC) Market was valued at USD 264 million in 2025 and is expected to reach USD 437 million by 2034 with a CAGR of 8.3% during the forecast period.

Which key companies operate in Bottom Anti-Reflection Coatings (BARC) Market?

-> Key players include Brewer Science, Merck KGaA, TOK, Qnity, Honeywell, Dongjin Semichem, Nissan Chemical, Allresist GmbH, YCCHEM Co., Ltd, SK Materials Performance (SKMP), Red Avenue, Xiamen Hengkun New Material Technology, PhiChem, among others.

What are the key growth drivers?

-> Key growth drivers include tighter critical dimension (CD) and defect requirements, increasing adoption of multi-patterning and advanced lithography nodes, reflectivity challenges across complex film stacks, and sustainability/compliance pressures driving PFOS/PFOA‑free formulation development.

Which region dominates the market?

-> Asia-Pacific leads the Bottom Anti-Reflection Coatings market, driven by the concentration of semiconductor fabs and advanced packaging facilities, while North America and Europe also hold significant shares.

What are the emerging trends?

-> Emerging trends include development of PFOS/PFOA‑free and environmentally compliant BARCs, increased use of inorganic silicon‑based BARCs for high‑k integration, DBARC (developable BARC) technologies that reduce etch steps, and formulation adaptations for EUV lithography.
Bottom Anti-Reflection Coatings (BARC) Market Trends, Business Strategies 2026-2034

Get Sample Report PDF for Exclusive Insights

Report Sample Includes

  • Table of Contents
  • List of Tables & Figures
  • Charts, Research Methodology, and more...

PDF Icon Download Sample Report PDF
SKU: b425404db1a9
Category:
License Type

Corporate License, Excel License, PDF and Excel Databook License

Download Sample Report

Table of Content

1 Introduction to Research & Analysis Reports
1.1 Bottom Anti-Reflection Coatings (BARC) Market Definition
1.2 Market Segments
1.2.1 Segment by Lithography Technology
1.2.2 Segment by Material
1.2.3 Segment by Application
1.3 Global Bottom Anti-Reflection Coatings (BARC) Market Overview
1.4 Features & Benefits of This Report
1.5 Methodology & Sources of Information
1.5.1 Research Methodology
1.5.2 Research Process
1.5.3 Base Year
1.5.4 Report Assumptions & Caveats
2 Global Bottom Anti-Reflection Coatings (BARC) Overall Market Size
2.1 Global Bottom Anti-Reflection Coatings (BARC) Market Size: 2025 VS 2034
2.2 Global Bottom Anti-Reflection Coatings (BARC) Market Size, Prospects & Forecasts: 2021-2034
2.3 Global Bottom Anti-Reflection Coatings (BARC) Sales: 2021-2034
3 Company Landscape
3.1 Top Bottom Anti-Reflection Coatings (BARC) Players in Global Market
3.2 Top Global Bottom Anti-Reflection Coatings (BARC) Companies Ranked by Revenue
3.3 Global Bottom Anti-Reflection Coatings (BARC) Revenue by Companies
3.4 Global Bottom Anti-Reflection Coatings (BARC) Sales by Companies
3.5 Global Bottom Anti-Reflection Coatings (BARC) Price by Manufacturer (2021-2026)
3.6 Top 3 and Top 5 Bottom Anti-Reflection Coatings (BARC) Companies in Global Market, by Revenue in 2025
3.7 Global Manufacturers Bottom Anti-Reflection Coatings (BARC) Product Type
3.8 Tier 1, Tier 2, and Tier 3 Bottom Anti-Reflection Coatings (BARC) Players in Global Market
3.8.1 List of Global Tier 1 Bottom Anti-Reflection Coatings (BARC) Companies
3.8.2 List of Global Tier 2 and Tier 3 Bottom Anti-Reflection Coatings (BARC) Companies
4 Sights by Lithography Technology
4.1 Overview
4.1.1 Segment by Lithography Technology – Global Bottom Anti-Reflection Coatings (BARC) Market Size Markets, 2025 & 2034
4.1.2 i-Line BARC
4.1.3 KrF BARC
4.1.4 ArF BARC
4.1.5 ArFi BARC
4.1.6 EUV BARC
4.2 Segment by Lithography Technology – Global Bottom Anti-Reflection Coatings (BARC) Revenue & Forecasts
4.2.1 Segment by Lithography Technology – Global Bottom Anti-Reflection Coatings (BARC) Revenue, 2021-2026
4.2.2 Segment by Lithography Technology – Global Bottom Anti-Reflection Coatings (BARC) Revenue, 2027-2034
4.2.3 Segment by Lithography Technology – Global Bottom Anti-Reflection Coatings (BARC) Revenue Market Share, 2021-2034
4.3 Segment by Lithography Technology – Global Bottom Anti-Reflection Coatings (BARC) Sales & Forecasts
4.3.1 Segment by Lithography Technology – Global Bottom Anti-Reflection Coatings (BARC) Sales, 2021-2026
4.3.2 Segment by Lithography Technology – Global Bottom Anti-Reflection Coatings (BARC) Sales, 2027-2034
4.3.3 Segment by Lithography Technology – Global Bottom Anti-Reflection Coatings (BARC) Sales Market Share, 2021-2034
4.4 Segment by Lithography Technology – Global Bottom Anti-Reflection Coatings (BARC) Price (Manufacturers Selling Prices), 2021-2034
5 Sights by Material
5.1 Overview
5.1.1 Segment by Material – Global Bottom Anti-Reflection Coatings (BARC) Market Size Markets, 2025 & 2034
5.1.2 Organic BARC
5.1.3 Inorganic BARC
5.2 Segment by Material – Global Bottom Anti-Reflection Coatings (BARC) Revenue & Forecasts
5.2.1 Segment by Material – Global Bottom Anti-Reflection Coatings (BARC) Revenue, 2021-2026
5.2.2 Segment by Material – Global Bottom Anti-Reflection Coatings (BARC) Revenue, 2027-2034
5.2.3 Segment by Material – Global Bottom Anti-Reflection Coatings (BARC) Revenue Market Share, 2021-2034
5.3 Segment by Material – Global Bottom Anti-Reflection Coatings (BARC) Sales & Forecasts
5.3.1 Segment by Material – Global Bottom Anti-Reflection Coatings (BARC) Sales, 2021-2026
5.3.2 Segment by Material – Global Bottom Anti-Reflection Coatings (BARC) Sales, 2027-2034
5.3.3 Segment by Material – Global Bottom Anti-Reflection Coatings (BARC) Sales Market Share, 2021-2034
5.4 Segment by Material – Global Bottom Anti-Reflection Coatings (BARC) Price (Manufacturers Selling Prices), 2021-2034
6 Sights by Application
6.1 Overview
6.1.1 Segment by Application – Global Bottom Anti-Reflection Coatings (BARC) Market Size, 2025 & 2034
6.1.2 3D NAND and DRAM BARC
6.1.3 Logic IC BARC
6.1.4 Advanced Packaging BARC
6.2 Segment by Application – Global Bottom Anti-Reflection Coatings (BARC) Revenue & Forecasts
6.2.1 Segment by Application – Global Bottom Anti-Reflection Coatings (BARC) Revenue, 2021-2026
6.2.2 Segment by Application – Global Bottom Anti-Reflection Coatings (BARC) Revenue, 2027-2034
6.2.3 Segment by Application – Global Bottom Anti-Reflection Coatings (BARC) Revenue Market Share, 2021-2034
6.3 Segment by Application – Global Bottom Anti-Reflection Coatings (BARC) Sales & Forecasts
6.3.1 Segment by Application – Global Bottom Anti-Reflection Coatings (BARC) Sales, 2021-2026
6.3.2 Segment by Application – Global Bottom Anti-Reflection Coatings (BARC) Sales, 2027-2034
6.3.3 Segment by Application – Global Bottom Anti-Reflection Coatings (BARC) Sales Market Share, 2021-2034
6.4 Segment by Application – Global Bottom Anti-Reflection Coatings (BARC) Price (Manufacturers Selling Prices), 2021-2034
7 Sights Region
7.1 By Region – Global Bottom Anti-Reflection Coatings (BARC) Market Size, 2025 & 2034
7.2 By Region – Global Bottom Anti-Reflection Coatings (BARC) Revenue & Forecasts
7.2.1 By Region – Global Bottom Anti-Reflection Coatings (BARC) Revenue, 2021-2026
7.2.2 By Region – Global Bottom Anti-Reflection Coatings (BARC) Revenue, 2027-2034
7.2.3 By Region – Global Bottom Anti-Reflection Coatings (BARC) Revenue Market Share, 2021-2034
7.3 By Region – Global Bottom Anti-Reflection Coatings (BARC) Sales & Forecasts
7.3.1 By Region – Global Bottom Anti-Reflection Coatings (BARC) Sales, 2021-2026
7.3.2 By Region – Global Bottom Anti-Reflection Coatings (BARC) Sales, 2027-2034
7.3.3 By Region – Global Bottom Anti-Reflection Coatings (BARC) Sales Market Share, 2021-2034
7.4 North America
7.4.1 By Country – North America Bottom Anti-Reflection Coatings (BARC) Revenue, 2021-2034
7.4.2 By Country – North America Bottom Anti-Reflection Coatings (BARC) Sales, 2021-2034
7.4.3 United States Bottom Anti-Reflection Coatings (BARC) Market Size, 2021-2034
7.4.4 Canada Bottom Anti-Reflection Coatings (BARC) Market Size, 2021-2034
7.4.5 Mexico Bottom Anti-Reflection Coatings (BARC) Market Size, 2021-2034
7.5 Europe
7.5.1 By Country – Europe Bottom Anti-Reflection Coatings (BARC) Revenue, 2021-2034
7.5.2 By Country – Europe Bottom Anti-Reflection Coatings (BARC) Sales, 2021-2034
7.5.3 Germany Bottom Anti-Reflection Coatings (BARC) Market Size, 2021-2034
7.5.4 France Bottom Anti-Reflection Coatings (BARC) Market Size, 2021-2034
7.5.5 U.K. Bottom Anti-Reflection Coatings (BARC) Market Size, 2021-2034
7.5.6 Italy Bottom Anti-Reflection Coatings (BARC) Market Size, 2021-2034
7.5.7 Russia Bottom Anti-Reflection Coatings (BARC) Market Size, 2021-2034
7.5.8 Nordic Countries Bottom Anti-Reflection Coatings (BARC) Market Size, 2021-2034
7.5.9 Benelux Bottom Anti-Reflection Coatings (BARC) Market Size, 2021-2034
7.6 Asia
7.6.1 By Region – Asia Bottom Anti-Reflection Coatings (BARC) Revenue, 2021-2034
7.6.2 By Region – Asia Bottom Anti-Reflection Coatings (BARC) Sales, 2021-2034
7.6.3 China Bottom Anti-Reflection Coatings (BARC) Market Size, 2021-2034
7.6.4 Japan Bottom Anti-Reflection Coatings (BARC) Market Size, 2021-2034
7.6.5 South Korea Bottom Anti-Reflection Coatings (BARC) Market Size, 2021-2034
7.6.6 Southeast Asia Bottom Anti-Reflection Coatings (BARC) Market Size, 2021-2034
7.6.7 India Bottom Anti-Reflection Coatings (BARC) Market Size, 2021-2034
7.7 South America
7.7.1 By Country – South America Bottom Anti-Reflection Coatings (BARC) Revenue, 2021-2034
7.7.2 By Country – South America Bottom Anti-Reflection Coatings (BARC) Sales, 2021-2034
7.7.3 Brazil Bottom Anti-Reflection Coatings (BARC) Market Size, 2021-2034
7.7.4 Argentina Bottom Anti-Reflection Coatings (BARC) Market Size, 2021-2034
7.8 Middle East & Africa
7.8.1 By Country – Middle East & Africa Bottom Anti-Reflection Coatings (BARC) Revenue, 2021-2034
7.8.2 By Country – Middle East & Africa Bottom Anti-Reflection Coatings (BARC) Sales, 2021-2034
7.8.3 Turkey Bottom Anti-Reflection Coatings (BARC) Market Size, 2021-2034
7.8.4 Israel Bottom Anti-Reflection Coatings (BARC) Market Size, 2021-2034
7.8.5 Saudi Arabia Bottom Anti-Reflection Coatings (BARC) Market Size, 2021-2034
7.8.6 UAE Bottom Anti-Reflection Coatings (BARC) Market Size, 2021-2034
8 Manufacturers & Brands Profiles
8.1 Honeywell
8.1.1 Honeywell Company Summary
8.1.2 Honeywell Business Overview
8.1.3 Honeywell Bottom Anti-Reflection Coatings (BARC) Major Product Offerings
8.1.4 Honeywell Bottom Anti-Reflection Coatings (BARC) Sales and Revenue in Global (2021-2026)
8.1.5 Honeywell Key News & Latest Developments
8.2 Merck KGaA
8.2.1 Merck KGaA Company Summary
8.2.2 Merck KGaA Business Overview
8.2.3 Merck KGaA Bottom Anti-Reflection Coatings (BARC) Major Product Offerings
8.2.4 Merck KGaA Bottom Anti-Reflection Coatings (BARC) Sales and Revenue in Global (2021-2026)
8.2.5 Merck KGaA Key News & Latest Developments
8.3 TOK
8.3.1 TOK Company Summary
8.3.2 TOK Business Overview
8.3.3 TOK Bottom Anti-Reflection Coatings (BARC) Major Product Offerings
8.3.4 TOK Bottom Anti-Reflection Coatings (BARC) Sales and Revenue in Global (2021-2026)
8.3.5 TOK Key News & Latest Developments
8.4 Qnity
8.4.1 Qnity Company Summary
8.4.2 Qnity Business Overview
8.4.3 Qnity Bottom Anti-Reflection Coatings (BARC) Major Product Offerings
8.4.4 Qnity Bottom Anti-Reflection Coatings (BARC) Sales and Revenue in Global (2021-2026)
8.4.5 Qnity Key News & Latest Developments
8.5 Dongjin Semichem
8.5.1 Dongjin Semichem Company Summary
8.5.2 Dongjin Semichem Business Overview
8.5.3 Dongjin Semichem Bottom Anti-Reflection Coatings (BARC) Major Product Offerings
8.5.4 Dongjin Semichem Bottom Anti-Reflection Coatings (BARC) Sales and Revenue in Global (2021-2026)
8.5.5 Dongjin Semichem Key News & Latest Developments
8.6 Brewer Science
8.6.1 Brewer Science Company Summary
8.6.2 Brewer Science Business Overview
8.6.3 Brewer Science Bottom Anti-Reflection Coatings (BARC) Major Product Offerings
8.6.4 Brewer Science Bottom Anti-Reflection Coatings (BARC) Sales and Revenue in Global (2021-2026)
8.6.5 Brewer Science Key News & Latest Developments
8.7 Nissan Chemical
8.7.1 Nissan Chemical Company Summary
8.7.2 Nissan Chemical Business Overview
8.7.3 Nissan Chemical Bottom Anti-Reflection Coatings (BARC) Major Product Offerings
8.7.4 Nissan Chemical Bottom Anti-Reflection Coatings (BARC) Sales and Revenue in Global (2021-2026)
8.7.5 Nissan Chemical Key News & Latest Developments
8.8 Allresist GmbH
8.8.1 Allresist GmbH Company Summary
8.8.2 Allresist GmbH Business Overview
8.8.3 Allresist GmbH Bottom Anti-Reflection Coatings (BARC) Major Product Offerings
8.8.4 Allresist GmbH Bottom Anti-Reflection Coatings (BARC) Sales and Revenue in Global (2021-2026)
8.8.5 Allresist GmbH Key News & Latest Developments
8.9 YCCHEM Co., Ltd
8.9.1 YCCHEM Co., Ltd Company Summary
8.9.2 YCCHEM Co., Ltd Business Overview
8.9.3 YCCHEM Co., Ltd Bottom Anti-Reflection Coatings (BARC) Major Product Offerings
8.9.4 YCCHEM Co., Ltd Bottom Anti-Reflection Coatings (BARC) Sales and Revenue in Global (2021-2026)
8.9.5 YCCHEM Co., Ltd Key News & Latest Developments
8.10 SK Materials Performance (SKMP)
8.10.1 SK Materials Performance (SKMP) Company Summary
8.10.2 SK Materials Performance (SKMP) Business Overview
8.10.3 SK Materials Performance (SKMP) Bottom Anti-Reflection Coatings (BARC) Major Product Offerings
8.10.4 SK Materials Performance (SKMP) Bottom Anti-Reflection Coatings (BARC) Sales and Revenue in Global (2021-2026)
8.10.5 SK Materials Performance (SKMP) Key News & Latest Developments
8.11 Red Avenue
8.11.1 Red Avenue Company Summary
8.11.2 Red Avenue Business Overview
8.11.3 Red Avenue Bottom Anti-Reflection Coatings (BARC) Major Product Offerings
8.11.4 Red Avenue Bottom Anti-Reflection Coatings (BARC) Sales and Revenue in Global (2021-2026)
8.11.5 Red Avenue Key News & Latest Developments
8.12 Xiamen Hengkun New Material Technology
8.12.1 Xiamen Hengkun New Material Technology Company Summary
8.12.2 Xiamen Hengkun New Material Technology Business Overview
8.12.3 Xiamen Hengkun New Material Technology Bottom Anti-Reflection Coatings (BARC) Major Product Offerings
8.12.4 Xiamen Hengkun New Material Technology Bottom Anti-Reflection Coatings (BARC) Sales and Revenue in Global (2021-2026)
8.12.5 Xiamen Hengkun New Material Technology Key News & Latest Developments
8.13 PhiChem
8.13.1 PhiChem Company Summary
8.13.2 PhiChem Business Overview
8.13.3 PhiChem Bottom Anti-Reflection Coatings (BARC) Major Product Offerings
8.13.4 PhiChem Bottom Anti-Reflection Coatings (BARC) Sales and Revenue in Global (2021-2026)
8.13.5 PhiChem Key News & Latest Developments
9 Global Bottom Anti-Reflection Coatings (BARC) Production Capacity, Analysis
9.1 Global Bottom Anti-Reflection Coatings (BARC) Production Capacity, 2021-2034
9.2 Bottom Anti-Reflection Coatings (BARC) Production Capacity of Key Manufacturers in Global Market
9.3 Global Bottom Anti-Reflection Coatings (BARC) Production by Region
10 Key Market Trends, Opportunity, Drivers and Restraints
10.1 Market Opportunities & Trends
10.2 Market Drivers
10.3 Market Restraints
11 Bottom Anti-Reflection Coatings (BARC) Supply Chain Analysis
11.1 Bottom Anti-Reflection Coatings (BARC) Industry Value Chain
11.2 Bottom Anti-Reflection Coatings (BARC) Upstream Market
11.3 Bottom Anti-Reflection Coatings (BARC) Downstream and Clients
11.4 Marketing Channels Analysis
11.4.1 Marketing Channels
11.4.2 Bottom Anti-Reflection Coatings (BARC) Distributors and Sales Agents in Global
12 Conclusion
13 Appendix
13.1 Note
13.2 Examples of Clients
13.3 DisclaimerList of Tables
Table 1. Key Players of Bottom Anti-Reflection Coatings (BARC) in Global Market
Table 2. Top Bottom Anti-Reflection Coatings (BARC) Players in Global Market, Ranking by Revenue (2025)
Table 3. Global Bottom Anti-Reflection Coatings (BARC) Revenue by Companies, (US$, Mn), 2021-2026
Table 4. Global Bottom Anti-Reflection Coatings (BARC) Revenue Share by Companies, 2021-2026
Table 5. Global Bottom Anti-Reflection Coatings (BARC) Sales by Companies, (MT), 2021-2026
Table 6. Global Bottom Anti-Reflection Coatings (BARC) Sales Share by Companies, 2021-2026
Table 7. Key Manufacturers Bottom Anti-Reflection Coatings (BARC) Price (2021-2026) & (US$/Kg)
Table 8. Global Manufacturers Bottom Anti-Reflection Coatings (BARC) Product Type
Table 9. List of Global Tier 1 Bottom Anti-Reflection Coatings (BARC) Companies, Revenue (US$, Mn) in 2025 and Market Share
Table 10. List of Global Tier 2 and Tier 3 Bottom Anti-Reflection Coatings (BARC) Companies, Revenue (US$, Mn) in 2025 and Market Share
Table 11. Segment by Lithography Technology – Global Bottom Anti-Reflection Coatings (BARC) Revenue, (US$, Mn), 2025 & 2034
Table 12. Segment by Lithography Technology – Global Bottom Anti-Reflection Coatings (BARC) Revenue (US$, Mn), 2021-2026
Table 13. Segment by Lithography Technology – Global Bottom Anti-Reflection Coatings (BARC) Revenue (US$, Mn), 2027-2034
Table 14. Segment by Lithography Technology – Global Bottom Anti-Reflection Coatings (BARC) Sales (MT), 2021-2026
Table 15. Segment by Lithography Technology – Global Bottom Anti-Reflection Coatings (BARC) Sales (MT), 2027-2034
Table 16. Segment by Material – Global Bottom Anti-Reflection Coatings (BARC) Revenue, (US$, Mn), 2025 & 2034
Table 17. Segment by Material – Global Bottom Anti-Reflection Coatings (BARC) Revenue (US$, Mn), 2021-2026
Table 18. Segment by Material – Global Bottom Anti-Reflection Coatings (BARC) Revenue (US$, Mn), 2027-2034
Table 19. Segment by Material – Global Bottom Anti-Reflection Coatings (BARC) Sales (MT), 2021-2026
Table 20. Segment by Material – Global Bottom Anti-Reflection Coatings (BARC) Sales (MT), 2027-2034
Table 21. Segment by Application – Global Bottom Anti-Reflection Coatings (BARC) Revenue, (US$, Mn), 2025 & 2034
Table 22. Segment by Application – Global Bottom Anti-Reflection Coatings (BARC) Revenue, (US$, Mn), 2021-2026
Table 23. Segment by Application – Global Bottom Anti-Reflection Coatings (BARC) Revenue, (US$, Mn), 2027-2034
Table 24. Segment by Application – Global Bottom Anti-Reflection Coatings (BARC) Sales, (MT), 2021-2026
Table 25. Segment by Application – Global Bottom Anti-Reflection Coatings (BARC) Sales, (MT), 2027-2034
Table 26. By Region – Global Bottom Anti-Reflection Coatings (BARC) Revenue, (US$, Mn), 2025 & 2034
Table 27. By Region – Global Bottom Anti-Reflection Coatings (BARC) Revenue, (US$, Mn), 2021-2026
Table 28. By Region – Global Bottom Anti-Reflection Coatings (BARC) Revenue, (US$, Mn), 2027-2034
Table 29. By Region – Global Bottom Anti-Reflection Coatings (BARC) Sales, (MT), 2021-2026
Table 30. By Region – Global Bottom Anti-Reflection Coatings (BARC) Sales, (MT), 2027-2034
Table 31. By Country – North America Bottom Anti-Reflection Coatings (BARC) Revenue, (US$, Mn), 2021-2026
Table 32. By Country – North America Bottom Anti-Reflection Coatings (BARC) Revenue, (US$, Mn), 2027-2034
Table 33. By Country – North America Bottom Anti-Reflection Coatings (BARC) Sales, (MT), 2021-2026
Table 34. By Country – North America Bottom Anti-Reflection Coatings (BARC) Sales, (MT), 2027-2034
Table 35. By Country – Europe Bottom Anti-Reflection Coatings (BARC) Revenue, (US$, Mn), 2021-2026
Table 36. By Country – Europe Bottom Anti-Reflection Coatings (BARC) Revenue, (US$, Mn), 2027-2034
Table 37. By Country – Europe Bottom Anti-Reflection Coatings (BARC) Sales, (MT), 2021-2026
Table 38. By Country – Europe Bottom Anti-Reflection Coatings (BARC) Sales, (MT), 2027-2034
Table 39. By Region – Asia Bottom Anti-Reflection Coatings (BARC) Revenue, (US$, Mn), 2021-2026
Table 40. By Region – Asia Bottom Anti-Reflection Coatings (BARC) Revenue, (US$, Mn), 2027-2034
Table 41. By Region – Asia Bottom Anti-Reflection Coatings (BARC) Sales, (MT), 2021-2026
Table 42. By Region – Asia Bottom Anti-Reflection Coatings (BARC) Sales, (MT), 2027-2034
Table 43. By Country – South America Bottom Anti-Reflection Coatings (BARC) Revenue, (US$, Mn), 2021-2026
Table 44. By Country – South America Bottom Anti-Reflection Coatings (BARC) Revenue, (US$, Mn), 2027-2034
Table 45. By Country – South America Bottom Anti-Reflection Coatings (BARC) Sales, (MT), 2021-2026
Table 46. By Country – South America Bottom Anti-Reflection Coatings (BARC) Sales, (MT), 2027-2034
Table 47. By Country – Middle East & Africa Bottom Anti-Reflection Coatings (BARC) Revenue, (US$, Mn), 2021-2026
Table 48. By Country – Middle East & Africa Bottom Anti-Reflection Coatings (BARC) Revenue, (US$, Mn), 2027-2034
Table 49. By Country – Middle East & Africa Bottom Anti-Reflection Coatings (BARC) Sales, (MT), 2021-2026
Table 50. By Country – Middle East & Africa Bottom Anti-Reflection Coatings (BARC) Sales, (MT), 2027-2034
Table 51. Honeywell Company Summary
Table 52. Honeywell Bottom Anti-Reflection Coatings (BARC) Product Offerings
Table 53. Honeywell Bottom Anti-Reflection Coatings (BARC) Sales (MT), Revenue (US$, Mn) and Average Price (US$/Kg) & (2021-2026)
Table 54. Honeywell Key News & Latest Developments
Table 55. Merck KGaA Company Summary
Table 56. Merck KGaA Bottom Anti-Reflection Coatings (BARC) Product Offerings
Table 57. Merck KGaA Bottom Anti-Reflection Coatings (BARC) Sales (MT), Revenue (US$, Mn) and Average Price (US$/Kg) & (2021-2026)
Table 58. Merck KGaA Key News & Latest Developments
Table 59. TOK Company Summary
Table 60. TOK Bottom Anti-Reflection Coatings (BARC) Product Offerings
Table 61. TOK Bottom Anti-Reflection Coatings (BARC) Sales (MT), Revenue (US$, Mn) and Average Price (US$/Kg) & (2021-2026)
Table 62. TOK Key News & Latest Developments
Table 63. Qnity Company Summary
Table 64. Qnity Bottom Anti-Reflection Coatings (BARC) Product Offerings
Table 65. Qnity Bottom Anti-Reflection Coatings (BARC) Sales (MT), Revenue (US$, Mn) and Average Price (US$/Kg) & (2021-2026)
Table 66. Qnity Key News & Latest Developments
Table 67. Dongjin Semichem Company Summary
Table 68. Dongjin Semichem Bottom Anti-Reflection Coatings (BARC) Product Offerings
Table 69. Dongjin Semichem Bottom Anti-Reflection Coatings (BARC) Sales (MT), Revenue (US$, Mn) and Average Price (US$/Kg) & (2021-2026)
Table 70. Dongjin Semichem Key News & Latest Developments
Table 71. Brewer Science Company Summary
Table 72. Brewer Science Bottom Anti-Reflection Coatings (BARC) Product Offerings
Table 73. Brewer Science Bottom Anti-Reflection Coatings (BARC) Sales (MT), Revenue (US$, Mn) and Average Price (US$/Kg) & (2021-2026)
Table 74. Brewer Science Key News & Latest Developments
Table 75. Nissan Chemical Company Summary
Table 76. Nissan Chemical Bottom Anti-Reflection Coatings (BARC) Product Offerings
Table 77. Nissan Chemical Bottom Anti-Reflection Coatings (BARC) Sales (MT), Revenue (US$, Mn) and Average Price (US$/Kg) & (2021-2026)
Table 78. Nissan Chemical Key News & Latest Developments
Table 79. Allresist GmbH Company Summary
Table 80. Allresist GmbH Bottom Anti-Reflection Coatings (BARC) Product Offerings
Table 81. Allresist GmbH Bottom Anti-Reflection Coatings (BARC) Sales (MT), Revenue (US$, Mn) and Average Price (US$/Kg) & (2021-2026)
Table 82. Allresist GmbH Key News & Latest Developments
Table 83. YCCHEM Co., Ltd Company Summary
Table 84. YCCHEM Co., Ltd Bottom Anti-Reflection Coatings (BARC) Product Offerings
Table 85. YCCHEM Co., Ltd Bottom Anti-Reflection Coatings (BARC) Sales (MT), Revenue (US$, Mn) and Average Price (US$/Kg) & (2021-2026)
Table 86. YCCHEM Co., Ltd Key News & Latest Developments
Table 87. SK Materials Performance (SKMP) Company Summary
Table 88. SK Materials Performance (SKMP) Bottom Anti-Reflection Coatings (BARC) Product Offerings
Table 89. SK Materials Performance (SKMP) Bottom Anti-Reflection Coatings (BARC) Sales (MT), Revenue (US$, Mn) and Average Price (US$/Kg) & (2021-2026)
Table 90. SK Materials Performance (SKMP) Key News & Latest Developments
Table 91. Red Avenue Company Summary
Table 92. Red Avenue Bottom Anti-Reflection Coatings (BARC) Product Offerings
Table 93. Red Avenue Bottom Anti-Reflection Coatings (BARC) Sales (MT), Revenue (US$, Mn) and Average Price (US$/Kg) & (2021-2026)
Table 94. Red Avenue Key News & Latest Developments
Table 95. Xiamen Hengkun New Material Technology Company Summary
Table 96. Xiamen Hengkun New Material Technology Bottom Anti-Reflection Coatings (BARC) Product Offerings
Table 97. Xiamen Hengkun New Material Technology Bottom Anti-Reflection Coatings (BARC) Sales (MT), Revenue (US$, Mn) and Average Price (US$/Kg) & (2021-2026)
Table 98. Xiamen Hengkun New Material Technology Key News & Latest Developments
Table 99. PhiChem Company Summary
Table 100. PhiChem Bottom Anti-Reflection Coatings (BARC) Product Offerings
Table 101. PhiChem Bottom Anti-Reflection Coatings (BARC) Sales (MT), Revenue (US$, Mn) and Average Price (US$/Kg) & (2021-2026)
Table 102. PhiChem Key News & Latest Developments
Table 103. Bottom Anti-Reflection Coatings (BARC) Capacity of Key Manufacturers in Global Market, 2024-2026 (MT)
Table 104. Global Bottom Anti-Reflection Coatings (BARC) Capacity Market Share of Key Manufacturers, 2024-2026
Table 105. Global Bottom Anti-Reflection Coatings (BARC) Production by Region, 2021-2026 (MT)
Table 106. Global Bottom Anti-Reflection Coatings (BARC) Production by Region, 2027-2034 (MT)
Table 107. Bottom Anti-Reflection Coatings (BARC) Market Opportunities & Trends in Global Market
Table 108. Bottom Anti-Reflection Coatings (BARC) Market Drivers in Global Market
Table 109. Bottom Anti-Reflection Coatings (BARC) Market Restraints in Global Market
Table 110. Bottom Anti-Reflection Coatings (BARC) Raw Materials
Table 111. Bottom Anti-Reflection Coatings (BARC) Raw Materials Suppliers in Global Market
Table 112. Typical Bottom Anti-Reflection Coatings (BARC) Downstream
Table 113. Bottom Anti-Reflection Coatings (BARC) Downstream Clients in Global Market
Table 114. Bottom Anti-Reflection Coatings (BARC) Distributors and Sales Agents in Global Market

List of Figures
Figure 1. Bottom Anti-Reflection Coatings (BARC) Product Picture
Figure 2. Bottom Anti-Reflection Coatings (BARC) Segment by Lithography Technology in 2025
Figure 3. Bottom Anti-Reflection Coatings (BARC) Segment by Material in 2025
Figure 4. Bottom Anti-Reflection Coatings (BARC) Segment by Application in 2025
Figure 5. Global Bottom Anti-Reflection Coatings (BARC) Market Overview: 2025
Figure 6. Key Caveats
Figure 7. Global Bottom Anti-Reflection Coatings (BARC) Market Size: 2025 VS 2034 (US$, Mn)
Figure 8. Global Bottom Anti-Reflection Coatings (BARC) Revenue: 2021-2034 (US$, Mn)
Figure 9. Bottom Anti-Reflection Coatings (BARC) Sales in Global Market: 2021-2034 (MT)
Figure 10. The Top 3 and 5 Players Market Share by Bottom Anti-Reflection Coatings (BARC) Revenue in 2025
Figure 11. Segment by Lithography Technology – Global Bottom Anti-Reflection Coatings (BARC) Revenue, (US$, Mn), 2025 & 2034
Figure 12. Segment by Lithography Technology – Global Bottom Anti-Reflection Coatings (BARC) Revenue Market Share, 2021-2034
Figure 13. Segment by Lithography Technology – Global Bottom Anti-Reflection Coatings (BARC) Sales Market Share, 2021-2034
Figure 14. Segment by Lithography Technology – Global Bottom Anti-Reflection Coatings (BARC) Price (US$/Kg), 2021-2034
Figure 15. Segment by Material – Global Bottom Anti-Reflection Coatings (BARC) Revenue, (US$, Mn), 2025 & 2034
Figure 16. Segment by Material – Global Bottom Anti-Reflection Coatings (BARC) Revenue Market Share, 2021-2034
Figure 17. Segment by Material – Global Bottom Anti-Reflection Coatings (BARC) Sales Market Share, 2021-2034
Figure 18. Segment by Material – Global Bottom Anti-Reflection Coatings (BARC) Price (US$/Kg), 2021-2034
Figure 19. Segment by Application – Global Bottom Anti-Reflection Coatings (BARC) Revenue, (US$, Mn), 2025 & 2034
Figure 20. Segment by Application – Global Bottom Anti-Reflection Coatings (BARC) Revenue Market Share, 2021-2034
Figure 21. Segment by Application – Global Bottom Anti-Reflection Coatings (BARC) Sales Market Share, 2021-2034
Figure 22. Segment by Application -Global Bottom Anti-Reflection Coatings (BARC) Price (US$/Kg), 2021-2034
Figure 23. By Region – Global Bottom Anti-Reflection Coatings (BARC) Revenue, (US$, Mn), 2025 & 2034
Figure 24. By Region – Global Bottom Anti-Reflection Coatings (BARC) Revenue Market Share, 2021 VS 2025 VS 2034
Figure 25. By Region – Global Bottom Anti-Reflection Coatings (BARC) Revenue Market Share, 2021-2034
Figure 26. By Region – Global Bottom Anti-Reflection Coatings (BARC) Sales Market Share, 2021-2034
Figure 27. By Country – North America Bottom Anti-Reflection Coatings (BARC) Revenue Market Share, 2021-2034
Figure 28. By Country – North America Bottom Anti-Reflection Coatings (BARC) Sales Market Share, 2021-2034
Figure 29. United States Bottom Anti-Reflection Coatings (BARC) Revenue, (US$, Mn), 2021-2034
Figure 30. Canada Bottom Anti-Reflection Coatings (BARC) Revenue, (US$, Mn), 2021-2034
Figure 31. Mexico Bottom Anti-Reflection Coatings (BARC) Revenue, (US$, Mn), 2021-2034
Figure 32. By Country – Europe Bottom Anti-Reflection Coatings (BARC) Revenue Market Share, 2021-2034
Figure 33. By Country – Europe Bottom Anti-Reflection Coatings (BARC) Sales Market Share, 2021-2034
Figure 34. Germany Bottom Anti-Reflection Coatings (BARC) Revenue, (US$, Mn), 2021-2034
Figure 35. France Bottom Anti-Reflection Coatings (BARC) Revenue, (US$, Mn), 2021-2034
Figure 36. U.K. Bottom Anti-Reflection Coatings (BARC) Revenue, (US$, Mn), 2021-2034
Figure 37. Italy Bottom Anti-Reflection Coatings (BARC) Revenue, (US$, Mn), 2021-2034
Figure 38. Russia Bottom Anti-Reflection Coatings (BARC) Revenue, (US$, Mn), 2021-2034
Figure 39. Nordic Countries Bottom Anti-Reflection Coatings (BARC) Revenue, (US$, Mn), 2021-2034
Figure 40. Benelux Bottom Anti-Reflection Coatings (BARC) Revenue, (US$, Mn), 2021-2034
Figure 41. By Region – Asia Bottom Anti-Reflection Coatings (BARC) Revenue Market Share, 2021-2034
Figure 42. By Region – Asia Bottom Anti-Reflection Coatings (BARC) Sales Market Share, 2021-2034
Figure 43. China Bottom Anti-Reflection Coatings (BARC) Revenue, (US$, Mn), 2021-2034
Figure 44. Japan Bottom Anti-Reflection Coatings (BARC) Revenue, (US$, Mn), 2021-2034
Figure 45. South Korea Bottom Anti-Reflection Coatings (BARC) Revenue, (US$, Mn), 2021-2034
Figure 46. Southeast Asia Bottom Anti-Reflection Coatings (BARC) Revenue, (US$, Mn), 2021-2034
Figure 47. India Bottom Anti-Reflection Coatings (BARC) Revenue, (US$, Mn), 2021-2034
Figure 48. By Country – South America Bottom Anti-Reflection Coatings (BARC) Revenue Market Share, 2021-2034
Figure 49. By Country – South America Bottom Anti-Reflection Coatings (BARC) Sales, Market Share, 2021-2034
Figure 50. Brazil Bottom Anti-Reflection Coatings (BARC) Revenue, (US$, Mn), 2021-2034
Figure 51. Argentina Bottom Anti-Reflection Coatings (BARC) Revenue, (US$, Mn), 2021-2034
Figure 52. By Country – Middle East & Africa Bottom Anti-Reflection Coatings (BARC) Revenue, Market Share, 2021-2034
Figure 53. By Country – Middle East & Africa Bottom Anti-Reflection Coatings (BARC) Sales, Market Share, 2021-2034
Figure 54. Turkey Bottom Anti-Reflection Coatings (BARC) Revenue, (US$, Mn), 2021-2034
Figure 55. Israel Bottom Anti-Reflection Coatings (BARC) Revenue, (US$, Mn), 2021-2034
Figure 56. Saudi Arabia Bottom Anti-Reflection Coatings (BARC) Revenue, (US$, Mn), 2021-2034
Figure 57. UAE Bottom Anti-Reflection Coatings (BARC) Revenue, (US$, Mn), 2021-2034
Figure 58. Global Bottom Anti-Reflection Coatings (BARC) Production Capacity (MT), 2021-2034
Figure 59. The Percentage of Production Bottom Anti-Reflection Coatings (BARC) by Region, 2025 VS 2034
Figure 60. Bottom Anti-Reflection Coatings (BARC) Industry Value Chain
Figure 61. Marketing Channels