Key Statistics
Key Takeaways
- 12-inch wafers lead the type mix because the source page identifies them as the preferred format for high-volume 28nm production and better die economics.
- Smartphones are the leading application, using the 28nm node’s established balance of power, density, design maturity and cost for high-volume mobile devices.
- Asia Pacific is the largest region, supported by dense foundry capacity, electronics manufacturing and customer ecosystems across Taiwan, China, South Korea, Japan and Southeast Asia.
- Specialty process extensions keep 28nm relevant: major foundries support RF, embedded memory, high-voltage and automotive-oriented technologies on the node.
- Capacity expansion remains visible, with UMC’s Singapore 22/28nm facility adding a planned 30,000 wafers per month in its first phase.
- Capital intensity and qualification protect established foundries because customers cannot shift qualified products between fabs without engineering, validation and supply-chain consequences.
28nm Wafer Foundry Market Overview
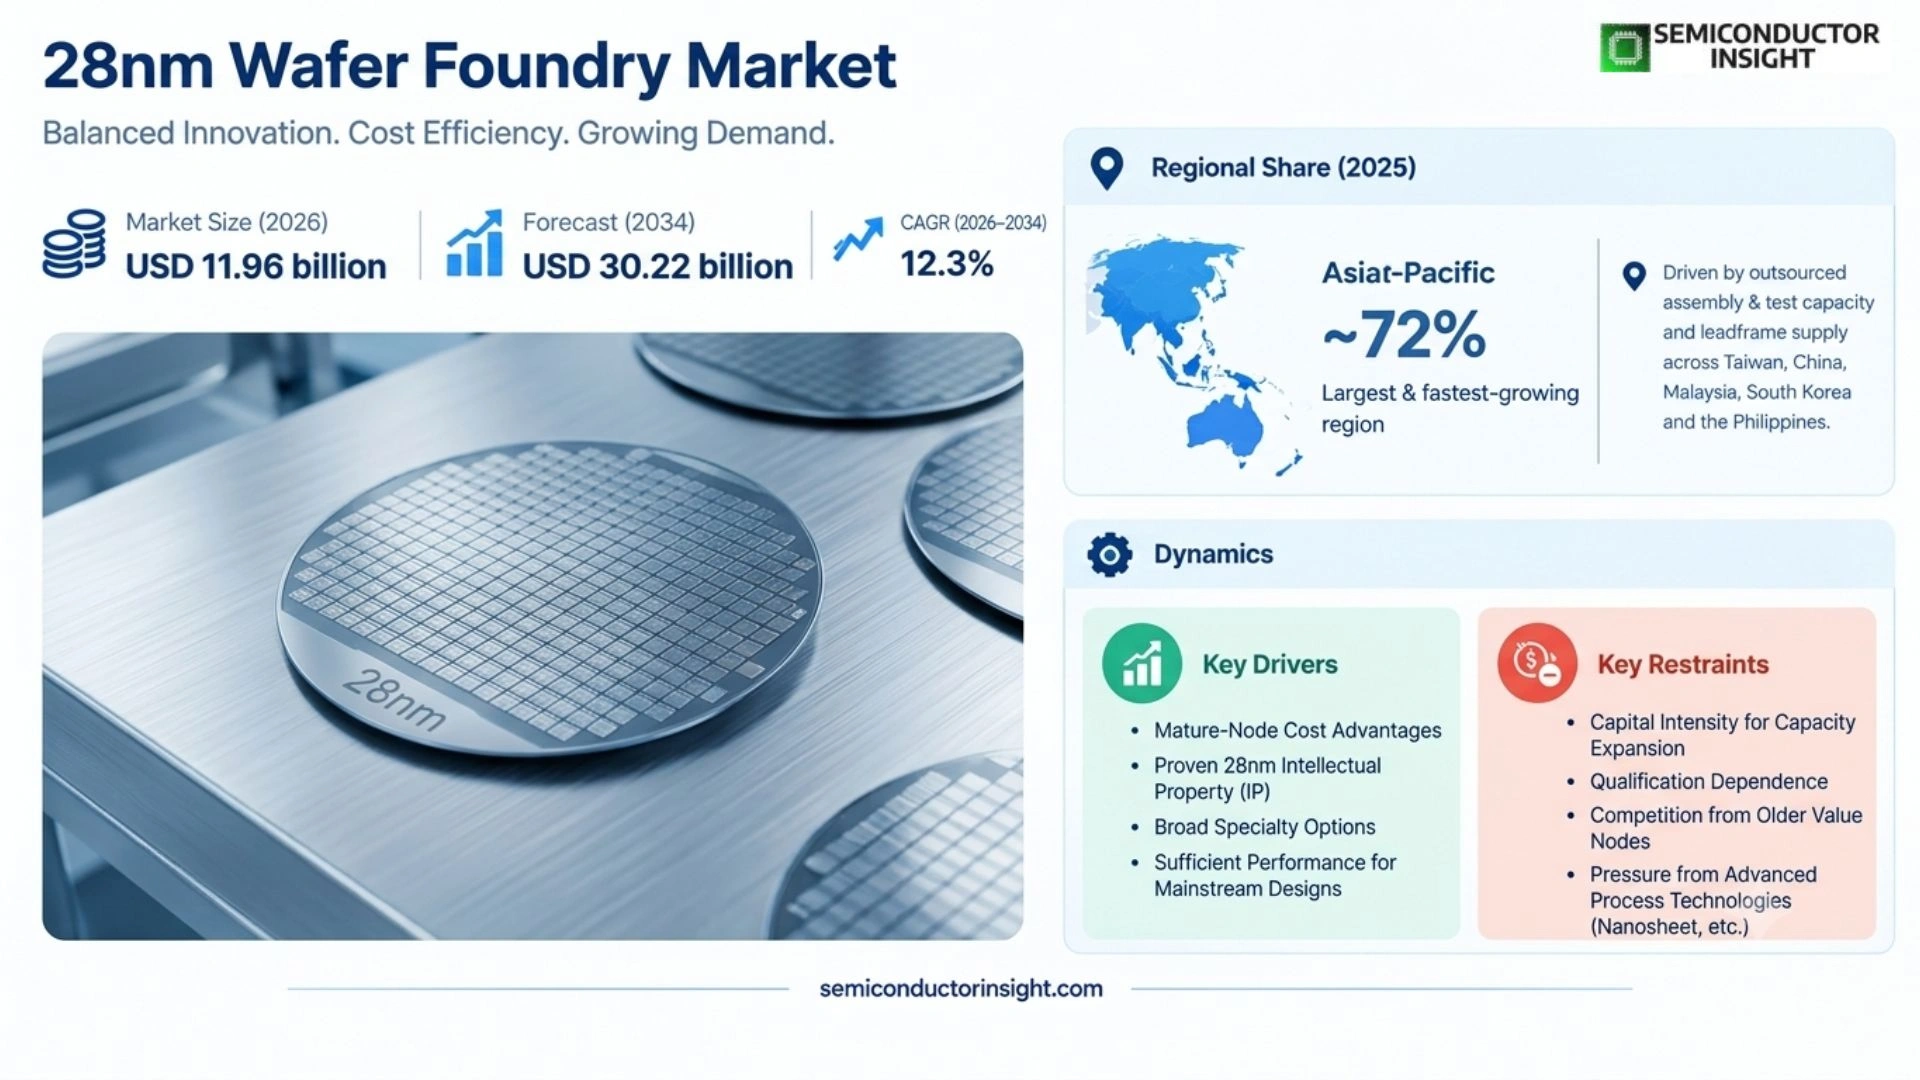
28nm Wafer Foundry Market was valued at USD 10.65 billion in 2025 and is projected to reach USD 30.22 billion by 2034, representing a 12.3% CAGR during 2026–2034. The 2026 estimated market size is USD 11.96 billion. Asia Pacific is the largest regional market, reflecting the concentration of 28nm wafer manufacturing and electronics supply chains.
A 28nm wafer foundry manufactures integrated circuits using a mature planar or specialty process generation that sits between older high-volume nodes and more advanced FinFET processes. The node remains commercially useful because designers can access established process design kits, analog and RF options, embedded memory and proven yield while avoiding the cost and design complexity associated with migrating every product to a leading-edge geometry.
The source scope covers 8-inch and 12-inch wafer production, with applications spanning smartphones, computers, IoT, automotive electronics and industrial control. That breadth matters because 28nm demand is not tied to one device cycle. A slowdown in one consumer category can be offset by connectivity, display driver, embedded-control or automotive programs that value mature IP and long product lifetimes.
TSMC describes 28nm as supporting smartphone 5G RF transceivers, mmWave and automotive radar, consumer products and IoT, while Samsung Foundry publishes 28nm specialty options for high-voltage display drivers, eFlash, RF and eMRAM. These portfolios show why the node continues to attract design activity: suppliers extend the platform through specialized device modules instead of competing only on raw transistor scaling.
Segment Analysis: By Type
By type, the source page segments the market into 8 Inch Wafer and 12 Inch Wafer services. It identifies 12 Inch Wafer as the leading segment because larger wafers provide more usable die area per wafer and better economics for high-volume fabrication, while 8-inch manufacturing remains relevant for selected specialty and legacy process flows where installed equipment and product architecture favor the smaller format.
| Type | Technical / purchasing role | Market position |
|---|---|---|
| 8 Inch Wafer | 8-inch 28nm production can remain relevant in specialty lines or facilities where existing tool sets, product volumes and device structures justify continued use of smaller wafers rather than a full migration to 300 mm manufacturing. For the 28nm wafer foundry, this mechanism matters commercially because customer qualification, integration effort, supply continuity, lifecycle support and total system economics influence purchasing decisions alongside unit price. Suppliers that address those constraints early can hold specification positions through multiple product cycles, while vendors that compete only on headline performance face greater substitution risk when programs move from engineering samples into volume deployment. | This is the smaller segment in the source positioning. Its commercial role is niche and capacity-specific, with customers valuing qualified process continuity and specialized manufacturing capability when retooling or redesigning for 12-inch production would not generate enough economic benefit. For the 28nm wafer foundry, this mechanism matters commercially because customer qualification, integration effort, supply continuity, lifecycle support and total system economics influence purchasing decisions alongside unit price. Suppliers that address those constraints early can hold specification positions through multiple product cycles, while vendors that compete only on headline performance face greater substitution risk when programs move from engineering samples into volume deployment. |
| 12 Inch Wafer | 12-inch wafers are the standard high-volume platform for major 28nm foundries. The greater wafer area supports more die per run, allows production on modern 300 mm fab infrastructure and spreads fixed processing steps across a larger number of chips, improving economics when utilization and yield are high. For the 28nm wafer foundry, this mechanism matters commercially because customer qualification, integration effort, supply continuity, lifecycle support and total system economics influence purchasing decisions alongside unit price. Suppliers that address those constraints early can hold specification positions through multiple product cycles, while vendors that compete only on headline performance face greater substitution risk when programs move from engineering samples into volume deployment. | The source page identifies 12 Inch Wafer as the leading type. Its advantage is strongest in smartphones, IoT, display and other volume applications where customers need mature yields and predictable per-die cost, and where large foundries can keep 300 mm lines well utilized across multiple process variants. For the 28nm wafer foundry, this mechanism matters commercially because customer qualification, integration effort, supply continuity, lifecycle support and total system economics influence purchasing decisions alongside unit price. Suppliers that address those constraints early can hold specification positions through multiple product cycles, while vendors that compete only on headline performance face greater substitution risk when programs move from engineering samples into volume deployment. |
Technology and platform mix
The source page also segments 28nm services by technology into 28nm HPC, 28nm HPL and 28nm LP, and by platform into handsets, computing devices, networking equipment and automotive systems. This secondary segmentation is commercially important because the same nominal geometry can serve very different power, performance, voltage and reliability requirements, so foundry differentiation depends on process modules, IP availability and qualification depth rather than node label alone.
Segment Analysis: By Application
By application, the source page lists Smartphone, Computer, IoT, Automotive Electronics, Industrial Control and Others, and identifies Smartphone as the leading application. Mobile programs value 28nm because it combines mature logic density, power management and broad IP with high-volume foundry availability, while the other applications extend demand into longer-lifecycle products that reduce dependence on any single consumer refresh cycle.
| Application | Demand characteristics |
|---|---|
| Smartphone | Smartphones are the leading application in the source scope. The 28nm node is used where mobile designers need a proven balance of cost, low power and integration without paying for leading-edge logic, including connectivity, display and supporting SoC functions. Seasonal volume ramps also reward foundries with stable yields and substantial qualified 300 mm capacity. For the 28nm wafer foundry, this mechanism matters commercially because customer qualification, integration effort, supply continuity, lifecycle support and total system economics influence purchasing decisions alongside unit price. Suppliers that address those constraints early can hold specification positions through multiple product cycles, while vendors that compete only on headline performance face greater substitution risk when programs move from engineering samples into volume deployment. |
| Computer | Computer-related 28nm demand includes controllers, interfaces, connectivity and supporting logic that do not require the newest CPU or GPU process node. These products can remain on mature processes for multiple platform generations, making long-term wafer availability, broad IP libraries and stable electrical characteristics more important than maximum transistor density. For the 28nm wafer foundry, this mechanism matters commercially because customer qualification, integration effort, supply continuity, lifecycle support and total system economics influence purchasing decisions alongside unit price. Suppliers that address those constraints early can hold specification positions through multiple product cycles, while vendors that compete only on headline performance face greater substitution risk when programs move from engineering samples into volume deployment. |
| IoT | IoT devices often combine low-power processing, radios, security and interface functions under strict cost and battery-life limits. TSMC publicly positions 28nm ultra-low-power technology for battery-powered SoCs, illustrating how mature-node optimization can support connected sensors and edge devices while allowing customers to reuse qualified IP and software ecosystems. For the 28nm wafer foundry, this mechanism matters commercially because customer qualification, integration effort, supply continuity, lifecycle support and total system economics influence purchasing decisions alongside unit price. Suppliers that address those constraints early can hold specification positions through multiple product cycles, while vendors that compete only on headline performance face greater substitution risk when programs move from engineering samples into volume deployment. |
| Automotive Electronics | Automotive electronics create durable 28nm demand for connectivity, radar-related functions, controllers and embedded-memory products that need long qualification cycles. Automotive customers value traceability, low defectivity and multi-year process stability, so foundries with qualified specialty technology and disciplined change management can hold design wins well beyond consumer product cycles. For the 28nm wafer foundry, this mechanism matters commercially because customer qualification, integration effort, supply continuity, lifecycle support and total system economics influence purchasing decisions alongside unit price. Suppliers that address those constraints early can hold specification positions through multiple product cycles, while vendors that compete only on headline performance face greater substitution risk when programs move from engineering samples into volume deployment. |
| Industrial Control | Industrial controls, factory automation and infrastructure equipment use mature-node processors and interface devices where reliability and long availability outweigh the value of aggressive scaling. 28nm can provide adequate computing performance while supporting analog, memory and communications functions, making it a practical platform for equipment expected to remain serviceable for many years. For the 28nm wafer foundry, this mechanism matters commercially because customer qualification, integration effort, supply continuity, lifecycle support and total system economics influence purchasing decisions alongside unit price. Suppliers that address those constraints early can hold specification positions through multiple product cycles, while vendors that compete only on headline performance face greater substitution risk when programs move from engineering samples into volume deployment. |
| Others | Other applications include display, communications and specialized embedded products that benefit from 28nm specialty modules. The category is commercially meaningful because foundries can keep mature fabs utilized by serving diverse low- and mid-volume programs whose requirements differ enough that one optimized process cannot address every customer without tailored device options and IP. For the 28nm wafer foundry, this mechanism matters commercially because customer qualification, integration effort, supply continuity, lifecycle support and total system economics influence purchasing decisions alongside unit price. Suppliers that address those constraints early can hold specification positions through multiple product cycles, while vendors that compete only on headline performance face greater substitution risk when programs move from engineering samples into volume deployment. |
Regional Analysis
Asia Pacific is the largest 28nm wafer foundry region and has the strongest growth profile because the region contains most of the high-volume wafer capacity and a dense network of semiconductor design, packaging, materials and electronics manufacturing partners. North America and Europe are important design and end-market centers, while South America and the Middle East & Africa participate chiefly through downstream electronics demand.
How does the commercial role of each region differ in the 28nm wafer foundry market?
Regional demand is not simply a ranking of wafer revenue. Asia Pacific combines manufacturing and consumption, North America contributes a large fabless design base and long-lifecycle electronics demand, Europe is weighted toward automotive and industrial qualification, and the remaining regions consume 28nm content through imported devices and infrastructure. Foundries therefore compete on a different mix of capacity, engineering support, supply assurance and customer access in each region.
| Region | Position | Growth outlook | Demand profile | What decides supplier selection |
|---|---|---|---|---|
| Asia Pacific | Largest | Strongest | Foundry capacity and electronics manufacturing led | Supplier selection is shaped by qualified 300 mm capacity, process breadth, yield, local engineering support and proximity to packaging and electronics ecosystems. Customers also consider geopolitical resilience and the ability to support multiple specialty variants without disrupting high-volume production. For the 28nm wafer foundry, this mechanism matters commercially because customer qualification, integration effort, supply continuity, lifecycle support and total system economics influence purchasing decisions alongside unit price. Suppliers that address those constraints early can hold specification positions through multiple product cycles, while vendors that compete only on headline performance face greater substitution risk when programs move from engineering samples into volume deployment. |
| North America | Major demand market | Steady | Fabless design and long-lifecycle systems led | Customers prioritize process design kits, IP, automotive or industrial qualification, long product support and capacity assurance. Geographic diversification matters because many North American designs rely on offshore wafer production while serving customers that expect stable supply over multi-year product lifetimes. For the 28nm wafer foundry, this mechanism matters commercially because customer qualification, integration effort, supply continuity, lifecycle support and total system economics influence purchasing decisions alongside unit price. Suppliers that address those constraints early can hold specification positions through multiple product cycles, while vendors that compete only on headline performance face greater substitution risk when programs move from engineering samples into volume deployment. |
| Europe | Established demand market | Steady | Automotive and industrial led | Supplier selection emphasizes lifecycle support, traceability, functional-safety requirements, specialty process availability and change control. Foundries that can maintain qualified 28nm platforms for long periods are better positioned for vehicle and industrial programs than suppliers focused only on short consumer cycles. For the 28nm wafer foundry, this mechanism matters commercially because customer qualification, integration effort, supply continuity, lifecycle support and total system economics influence purchasing decisions alongside unit price. Suppliers that address those constraints early can hold specification positions through multiple product cycles, while vendors that compete only on headline performance face greater substitution risk when programs move from engineering samples into volume deployment. |
| South America | Emerging | Selective | Downstream electronics led | The region buys 28nm content mainly inside imported or locally assembled electronics, so foundry demand is mediated through global semiconductor suppliers. Landed component cost, distribution and multinational supply continuity influence market access more directly than local wafer-manufacturing capability. For the 28nm wafer foundry, this mechanism matters commercially because customer qualification, integration effort, supply continuity, lifecycle support and total system economics influence purchasing decisions alongside unit price. Suppliers that address those constraints early can hold specification positions through multiple product cycles, while vendors that compete only on headline performance face greater substitution risk when programs move from engineering samples into volume deployment. |
| Middle East & Africa | Emerging | Selective | Infrastructure and imported electronics led | Procurement flows through communications, data, industrial and consumer systems supplied by multinational vendors. Foundries benefit indirectly when those platforms use 28nm controllers or connectivity devices, with supply continuity and system qualification more important than local wafer fabrication. For the 28nm wafer foundry, this mechanism matters commercially because customer qualification, integration effort, supply continuity, lifecycle support and total system economics influence purchasing decisions alongside unit price. Suppliers that address those constraints early can hold specification positions through multiple product cycles, while vendors that compete only on headline performance face greater substitution risk when programs move from engineering samples into volume deployment. |
Competitive Landscape
Competition in 28nm foundry services is concentrated among a limited group of companies with qualified process technology, high-utilization wafer fabs, mature design ecosystems and the capital to maintain equipment and process controls over long product lifetimes. The source page names TSMC, Samsung Foundry, GlobalFoundries, SMIC and UMC among the leading participants, with additional specialty and regional foundries serving differentiated customer requirements.
TSMC competes with the breadth of its 28nm platform, including high-performance compact, ultra-low-power, RF and automotive-grade specialty technologies. That breadth lowers switching incentives for customers because a design team can move across application-specific process options while staying within a familiar foundry ecosystem, IP catalog and manufacturing relationship. For the 28nm wafer foundry, this mechanism matters commercially because customer qualification, integration effort, supply continuity, lifecycle support and total system economics influence purchasing decisions alongside unit price. Suppliers that address those constraints early can hold specification positions through multiple product cycles, while vendors that compete only on headline performance face greater substitution risk when programs move from engineering samples into volume deployment.
Samsung Foundry also differentiates 28nm through specialty extensions. Its public technology material describes 28nm eFlash, RF, eMRAM and high-voltage processes, including display-driver applications. This creates competition on functional integration rather than only wafer price, because a customer may choose a foundry based on access to a qualified embedded-memory or high-voltage module that avoids external components. For the 28nm wafer foundry, this mechanism matters commercially because customer qualification, integration effort, supply continuity, lifecycle support and total system economics influence purchasing decisions alongside unit price. Suppliers that address those constraints early can hold specification positions through multiple product cycles, while vendors that compete only on headline performance face greater substitution risk when programs move from engineering samples into volume deployment.
UMC’s Singapore expansion illustrates the role of capacity geography in competition. A planned first-phase 30,000 wafers per month for 22/28nm creates another qualified supply location for global customers. Multi-site capacity can influence design wins where semiconductor buyers want geographic diversification, while mature yields and customer-specific process support remain necessary to convert installed capacity into sustained revenue.
- European automotive electronics encourage foundries to keep mature process families active because vehicle platforms can remain in production for many years and process changes trigger expensive requalification. That dynamic supports 28nm variants with embedded memory, RF or low-leakage characteristics and rewards suppliers that publish stable design rules, maintain statistical process control and communicate manufacturing changes well in advance.
- Industrial control creates another durable demand pool because factory equipment, power conversion and infrastructure systems often value predictable long-term availability more than maximum transistor density. Designers can use 28nm to integrate control logic and interfaces while staying within a process generation that has mature libraries, established reliability data and broad packaging support. For the 28nm wafer foundry, this mechanism matters commercially because customer qualification, integration effort, supply continuity, lifecycle support and total system economics influence purchasing decisions alongside unit price. Suppliers that address those constraints early can hold specification positions through multiple product cycles, while vendors that compete only on headline performance face greater substitution risk when programs move from engineering samples into volume deployment.
- European semiconductor policy increasingly emphasizes resilient regional supply, but many 28nm designs will still rely on global foundries. This makes second-source planning, geographic diversification and long-term capacity agreements strategically relevant to European customers even when wafer fabrication is performed in Asia or North America, strengthening competition on continuity and risk management rather than price alone. For the 28nm wafer foundry, this mechanism matters commercially because customer qualification, integration effort, supply continuity, lifecycle support and total system economics influence purchasing decisions alongside unit price. Suppliers that address those constraints early can hold specification positions through multiple product cycles, while vendors that compete only on headline performance face greater substitution risk when programs move from engineering samples into volume deployment.
Competitive Landscape
Competition in 28nm foundry services is concentrated among a limited group of companies with qualified process technology, high-utilization wafer fabs, mature design ecosystems and the capital to maintain equipment and process controls over long product lifetimes. The source page names TSMC, Samsung Foundry, GlobalFoundries, SMIC and UMC among the leading participants, with additional specialty and regional foundries serving differentiated customer requirements.
TSMC competes with the breadth of its 28nm platform, including high-performance compact, ultra-low-power, RF and automotive-grade specialty technologies. That breadth lowers switching incentives for customers because a design team can move across application-specific process options while staying within a familiar foundry ecosystem, IP catalog and manufacturing relationship. For the 28nm wafer foundry, this mechanism matters commercially because customer qualification, integration effort, supply continuity, lifecycle support and total system economics influence purchasing decisions alongside unit price. Suppliers that address those constraints early can hold specification positions through multiple product cycles, while vendors that compete only on headline performance face greater substitution risk when programs move from engineering samples into volume deployment.
Samsung Foundry also differentiates 28nm through specialty extensions. Its public technology material describes 28nm eFlash, RF, eMRAM and high-voltage processes, including display-driver applications. This creates competition on functional integration rather than only wafer price, because a customer may choose a foundry based on access to a qualified embedded-memory or high-voltage module that avoids external components. For the 28nm wafer foundry, this mechanism matters commercially because customer qualification, integration effort, supply continuity, lifecycle support and total system economics influence purchasing decisions alongside unit price. Suppliers that address those constraints early can hold specification positions through multiple product cycles, while vendors that compete only on headline performance face greater substitution risk when programs move from engineering samples into volume deployment.
UMC’s Singapore expansion illustrates the role of capacity geography in competition. A planned first-phase 30,000 wafers per month for 22/28nm creates another qualified supply location for global customers. Multi-site capacity can influence design wins where semiconductor buyers want geographic diversification, while mature yields and customer-specific process support remain necessary to convert installed capacity into sustained revenue.
Smaller foundries compete selectively rather than matching the largest suppliers across every process variant. They can win analog, mixed-signal, power-management, display or regional programs where customer volumes fit available capacity and where specialized engineering support matters. This tiered structure supports several defensible niches even though scale leaders hold the broadest 28nm portfolios. For the 28nm wafer foundry, this mechanism matters commercially because customer qualification, integration effort, supply continuity, lifecycle support and total system economics influence purchasing decisions alongside unit price. Suppliers that address those constraints early can hold specification positions through multiple product cycles, while vendors that compete only on headline performance face greater substitution risk when programs move from engineering samples into volume deployment.
Tier structure
| Competitive tier | Representative participants | How suppliers compete |
|---|---|---|
| Global scale leaders | TSMC; Samsung Foundry; GlobalFoundries; SMIC; UMC | These suppliers compete through 300 mm scale, mature yield learning, broad process design kits, specialty extensions and large customer portfolios. Their advantage is strongest when programs require high volume, multiple qualified process options and the confidence that capacity and technical support will remain available across long product cycles. For the 28nm wafer foundry, this mechanism matters commercially because customer qualification, integration effort, supply continuity, lifecycle support and total system economics influence purchasing decisions alongside unit price. Suppliers that address those constraints early can hold specification positions through multiple product cycles, while vendors that compete only on headline performance face greater substitution risk when programs move from engineering samples into volume deployment. |
| Regional and specialty foundries | Shanghai Huahong; PSMC; VIS; Tower Semiconductor; DB HiTek | These companies compete by focusing on selected geographies, analog or mixed-signal requirements, specialty process modules and customer programs whose volume or technical needs do not demand the full breadth of a global scale leader. Close engineering engagement can offset smaller absolute capacity in carefully chosen niches. For the 28nm wafer foundry, this mechanism matters commercially because customer qualification, integration effort, supply continuity, lifecycle support and total system economics influence purchasing decisions alongside unit price. Suppliers that address those constraints early can hold specification positions through multiple product cycles, while vendors that compete only on headline performance face greater substitution risk when programs move from engineering samples into volume deployment. |
| Additional qualified participants | X-FAB; Silterra Malaysia; Grace/HHGrace; UMC affiliate facilities | These participants extend the available manufacturing base and can serve specialized, regional or customer-specific programs. Their commercial opportunity depends on matching process capability, wafer format, reliability and capacity commitments to the customer’s exact product roadmap rather than competing for every mainstream 28nm logic design. For the 28nm wafer foundry, this mechanism matters commercially because customer qualification, integration effort, supply continuity, lifecycle support and total system economics influence purchasing decisions alongside unit price. Suppliers that address those constraints early can hold specification positions through multiple product cycles, while vendors that compete only on headline performance face greater substitution risk when programs move from engineering samples into volume deployment. |
Key companies profiled
The source report profiles the following companies: TSMC; Samsung Foundry; GlobalFoundries; SMIC; UMC; Shanghai Huahong; PSMC; Vanguard International Semiconductor (VIS); Tower Semiconductor; DB HiTek; X-FAB; Silterra Malaysia; Grace Semiconductor Manufacturing (merged into HHGrace); United Microelectronics Corporation (UMC affiliate facilities). The list spans global scale foundries, specialty suppliers and regional manufacturing operations, so competitive analysis should distinguish broad 28nm platform leaders from companies that participate in narrower process or geographic roles rather than assuming every profiled organization competes for identical high-volume designs.
Production Capacity Analysis
28nm production capacity is concentrated in capital-intensive semiconductor fabs, with 12-inch infrastructure carrying the leading role in high-volume output. Capacity is valuable only when paired with qualified process recipes, stable yields, customer design kits and backend supply, so adding cleanroom space or equipment does not immediately create interchangeable foundry supply. Geographic diversification and specialty process modules are therefore as important as nominal wafer starts.
UMC’s Singapore Fab12i expansion provides a concrete capacity benchmark: the first phase is designed for up to 30,000 wafers per month and up to US$5 billion of investment, with 22nm and 28nm processes targeted at display, IoT memory and connectivity products. Customer-backed expansion shows how mature-node capacity can still attract major capital when demand is diversified across end markets.
Yield learning is a core constraint because mature-node economics depend on running large volumes with low defectivity and stable electrical performance. A foundry with existing 28nm process history can often offer a more predictable cost and schedule than a newly qualified line, which means installed experience has economic value even when several suppliers own nominally similar lithography capability.
Process capacity is also segmented by specialty modules. A line qualified for standard logic is not automatically interchangeable with one supporting embedded flash, RF, high-voltage or automotive requirements. Customers must qualify device options, libraries, reliability and packaging interactions, so effective capacity is narrower than aggregate 28nm wafer-start figures would suggest. For the 28nm wafer foundry, this mechanism matters commercially because customer qualification, integration effort, supply continuity, lifecycle support and total system economics influence purchasing decisions alongside unit price. Suppliers that address those constraints early can hold specification positions through multiple product cycles, while vendors that compete only on headline performance face greater substitution risk when programs move from engineering samples into volume deployment.
28nm Wafer Foundry Market Dynamics: Drivers, Restraints and Opportunities
The 28nm wafer foundry market is shaped by a tension between mature-node cost advantages and continued functional innovation. Demand expands when designers decide that established 28nm performance is sufficient and value lower development cost, proven IP and broad specialty options. Growth is restrained by capital intensity, qualification dependence and competition from both older value nodes and newer processes that may absorb high-performance designs.
MARKET DRIVERS
Drivers Impact Analysis*
| Factor | Relative impact* | Commercial mechanism |
|---|---|---|
| Mature cost-performance sweet spot | High | 28nm offers a well-established compromise between logic density, power, performance, IP maturity and wafer cost, allowing customers to avoid leading-edge complexity for functions that do not require the smallest transistors. For the 28nm wafer foundry, this mechanism matters commercially because customer qualification, integration effort, supply continuity, lifecycle support and total system economics influence purchasing decisions alongside unit price. Suppliers that address those constraints early can hold specification positions through multiple product cycles, while vendors that compete only on headline performance face greater substitution risk when programs move from engineering samples into volume deployment. |
| IoT, automotive and connectivity demand | High | Multiple end markets use 28nm for controllers, radios, display and embedded functions, reducing reliance on one product cycle and supporting utilization across varied specialty process modules. For the 28nm wafer foundry, this mechanism matters commercially because customer qualification, integration effort, supply continuity, lifecycle support and total system economics influence purchasing decisions alongside unit price. Suppliers that address those constraints early can hold specification positions through multiple product cycles, while vendors that compete only on headline performance face greater substitution risk when programs move from engineering samples into volume deployment. |
| 12-inch capacity expansion | Medium | New or expanded 300 mm capacity can improve supply assurance and per-die economics, especially when customers sign long-term agreements or seek geographic diversification for mature-node products. For the 28nm wafer foundry, this mechanism matters commercially because customer qualification, integration effort, supply continuity, lifecycle support and total system economics influence purchasing decisions alongside unit price. Suppliers that address those constraints early can hold specification positions through multiple product cycles, while vendors that compete only on headline performance face greater substitution risk when programs move from engineering samples into volume deployment. |
| Specialty technology extensions | Medium | RF, eFlash, eMRAM, high-voltage and automotive-grade variants create new addressable designs on an established node, helping foundries defend pricing and differentiation beyond standard digital logic. For the 28nm wafer foundry, this mechanism matters commercially because customer qualification, integration effort, supply continuity, lifecycle support and total system economics influence purchasing decisions alongside unit price. Suppliers that address those constraints early can hold specification positions through multiple product cycles, while vendors that compete only on headline performance face greater substitution risk when programs move from engineering samples into volume deployment. |
Mature economics make 28nm a long-lived design platform
Many chips do not gain enough system value from migrating to 14nm, 7nm or more advanced processes to justify higher mask, design and qualification costs. 28nm can provide sufficient compute density and low power with mature yield and extensive IP, allowing semiconductor companies to focus engineering resources on architecture, software and system integration rather than transistor scaling. For the 28nm wafer foundry, this mechanism matters commercially because customer qualification, integration effort, supply continuity, lifecycle support and total system economics influence purchasing decisions alongside unit price. Suppliers that address those constraints early can hold specification positions through multiple product cycles, while vendors that compete only on headline performance face greater substitution risk when programs move from engineering samples into volume deployment.
IoT and automotive broaden demand beyond smartphones
The source page highlights IoT and automotive electronics alongside smartphones and computers. These markets need low-power processing, connectivity and long-lived control functions, creating a different demand profile from fast consumer refreshes. Automotive and industrial programs also reward stable process availability, which can extend the economic life of a 28nm fab long after initial mobile adoption. For the 28nm wafer foundry, this mechanism matters commercially because customer qualification, integration effort, supply continuity, lifecycle support and total system economics influence purchasing decisions alongside unit price. Suppliers that address those constraints early can hold specification positions through multiple product cycles, while vendors that compete only on headline performance face greater substitution risk when programs move from engineering samples into volume deployment.
Specialty 28nm processes increase functional value
Major foundries continue to publish specialized 28nm technologies rather than treating the node as frozen. Samsung lists eFlash, RF, eMRAM and high-voltage options, while TSMC lists ultra-low-power and automotive specialty technologies. These extensions let customers integrate functions that might otherwise require separate chips and help foundries differentiate services without moving the design to a smaller node. For the 28nm wafer foundry, this mechanism matters commercially because customer qualification, integration effort, supply continuity, lifecycle support and total system economics influence purchasing decisions alongside unit price. Suppliers that address those constraints early can hold specification positions through multiple product cycles, while vendors that compete only on headline performance face greater substitution risk when programs move from engineering samples into volume deployment.
Geographic capacity diversification supports supply resilience
UMC’s Singapore investment adds another 22/28nm manufacturing location outside the largest North Asian hubs. Customers concerned with concentration risk can value a qualified alternative site, especially when mature-node chips are used in high-volume products with long lifecycles. Capacity geography therefore becomes part of the commercial offer alongside wafer price, process performance and yield. For the 28nm wafer foundry, this mechanism matters commercially because customer qualification, integration effort, supply continuity, lifecycle support and total system economics influence purchasing decisions alongside unit price. Suppliers that address those constraints early can hold specification positions through multiple product cycles, while vendors that compete only on headline performance face greater substitution risk when programs move from engineering samples into volume deployment.
MARKET RESTRAINTS
Restraints Impact Analysis*
| Factor | Relative impact* | Commercial mechanism |
|---|---|---|
| High capital and utilization requirements | High | A modern 300 mm foundry line requires substantial equipment, facilities and process-control investment, and economics deteriorate quickly when utilization falls, limiting the number of suppliers able to sustain broad 28nm capacity. For the 28nm wafer foundry, this mechanism matters commercially because customer qualification, integration effort, supply continuity, lifecycle support and total system economics influence purchasing decisions alongside unit price. Suppliers that address those constraints early can hold specification positions through multiple product cycles, while vendors that compete only on headline performance face greater substitution risk when programs move from engineering samples into volume deployment. |
| Customer qualification and switching cost | Medium | Moving a qualified IC between foundries can require physical redesign, new libraries, reliability testing and customer approval, slowing redistribution of demand even when another fab has nominal spare capacity. For the 28nm wafer foundry, this mechanism matters commercially because customer qualification, integration effort, supply continuity, lifecycle support and total system economics influence purchasing decisions alongside unit price. Suppliers that address those constraints early can hold specification positions through multiple product cycles, while vendors that compete only on headline performance face greater substitution risk when programs move from engineering samples into volume deployment. |
| Competition from adjacent nodes | Medium | Older nodes can win cost-sensitive analog or control functions, while advanced nodes take performance-intensive logic, placing 28nm in a middle position that must continuously justify its system-level economics. For the 28nm wafer foundry, this mechanism matters commercially because customer qualification, integration effort, supply continuity, lifecycle support and total system economics influence purchasing decisions alongside unit price. Suppliers that address those constraints early can hold specification positions through multiple product cycles, while vendors that compete only on headline performance face greater substitution risk when programs move from engineering samples into volume deployment. |
| Geopolitical and export constraints | Medium | Regional trade rules and supply-chain policy can limit equipment, technology or customer access and encourage localization, complicating long-term capacity planning for foundries serving globally distributed design companies. For the 28nm wafer foundry, this mechanism matters commercially because customer qualification, integration effort, supply continuity, lifecycle support and total system economics influence purchasing decisions alongside unit price. Suppliers that address those constraints early can hold specification positions through multiple product cycles, while vendors that compete only on headline performance face greater substitution risk when programs move from engineering samples into volume deployment. |
Capital intensity creates rigid supply economics
Foundries cannot add or remove 300 mm capacity as quickly as demand changes because fabs require multi-year investment, specialized equipment and process qualification. A downturn can create price pressure when fixed assets are underutilized, while a demand surge can create allocation risk. This rigidity favors scale leaders but can amplify cyclical swings in wafer pricing and customer lead times.
Qualification makes capacity less interchangeable than it appears
Two fabs offering 28nm are not automatically substitutes. Customers depend on process design kits, device models, memory compilers, analog IP, package interactions and reliability records specific to a foundry. Moving a product can require engineering changes and new end-customer approval, so nominal industry capacity overstates the amount of supply that can be switched quickly between programs. For the 28nm wafer foundry, this mechanism matters commercially because customer qualification, integration effort, supply continuity, lifecycle support and total system economics influence purchasing decisions alongside unit price. Suppliers that address those constraints early can hold specification positions through multiple product cycles, while vendors that compete only on headline performance face greater substitution risk when programs move from engineering samples into volume deployment.
Adjacent process nodes compete for new designs
A designer can choose older nodes when cost and analog integration dominate, or move to FinFET nodes when performance and density justify the premium. 28nm therefore has to win a system-level economic comparison rather than relying on historical volume. Foundries that keep specialty options current are better positioned than suppliers offering only generic mature logic. For the 28nm wafer foundry, this mechanism matters commercially because customer qualification, integration effort, supply continuity, lifecycle support and total system economics influence purchasing decisions alongside unit price. Suppliers that address those constraints early can hold specification positions through multiple product cycles, while vendors that compete only on headline performance face greater substitution risk when programs move from engineering samples into volume deployment.
MARKET OPPORTUNITIES
Automotive and industrial specialty platforms
Foundries can expand 28nm revenue by combining mature logic with embedded memory, RF, high-voltage or low-leakage options qualified for automotive and industrial use. These programs typically have longer lifecycles than smartphones, and successful qualification can create durable wafer demand if the supplier can maintain process stability and documentation across many years. For the 28nm wafer foundry, this mechanism matters commercially because customer qualification, integration effort, supply continuity, lifecycle support and total system economics influence purchasing decisions alongside unit price. Suppliers that address those constraints early can hold specification positions through multiple product cycles, while vendors that compete only on headline performance face greater substitution risk when programs move from engineering samples into volume deployment.
Regionalized 22/28nm capacity
New capacity in locations such as Singapore creates an opportunity to sell supply-chain diversification as part of the foundry service. Customers may accept a higher strategic value for qualified geographic alternatives when products are critical to automotive, communications or industrial systems, especially if the foundry can offer multi-site continuity and common engineering support. For the 28nm wafer foundry, this mechanism matters commercially because customer qualification, integration effort, supply continuity, lifecycle support and total system economics influence purchasing decisions alongside unit price. Suppliers that address those constraints early can hold specification positions through multiple product cycles, while vendors that compete only on headline performance face greater substitution risk when programs move from engineering samples into volume deployment.
IoT ultra-low-power integration
Battery-operated IoT devices need low leakage, embedded connectivity and mature design IP at cost points that often do not justify leading-edge nodes. Foundries with optimized 28nm low-power platforms can target sensors, wearables, controllers and edge devices while leveraging existing wafer infrastructure and broad third-party IP ecosystems. For the 28nm wafer foundry, this mechanism matters commercially because customer qualification, integration effort, supply continuity, lifecycle support and total system economics influence purchasing decisions alongside unit price. Suppliers that address those constraints early can hold specification positions through multiple product cycles, while vendors that compete only on headline performance face greater substitution risk when programs move from engineering samples into volume deployment.
Display, RF and embedded-memory extensions
Samsung’s public 28nm portfolio demonstrates that high-voltage display drivers, RF and embedded non-volatile memory can all extend the addressable market of a mature node. Other foundries can pursue similar specialty modules, turning process know-how into differentiated products that are less exposed to commodity logic pricing and more embedded in customer system architectures. For the 28nm wafer foundry, this mechanism matters commercially because customer qualification, integration effort, supply continuity, lifecycle support and total system economics influence purchasing decisions alongside unit price. Suppliers that address those constraints early can hold specification positions through multiple product cycles, while vendors that compete only on headline performance face greater substitution risk when programs move from engineering samples into volume deployment.
28nm Wafer Foundry Supply Chain Analysis
Materials & 300 mm substrates
Upstream suppliers provide the high-purity wafers, chemicals, gases and deposition materials required for stable 28nm processing. Mature-node production still depends on tight contamination control and qualified material changes, so foundries often maintain long supplier relationships and second-source plans. Disruption in specialty materials can affect yield or force requalification even when lithography equipment remains available. For the 28nm wafer foundry, this mechanism matters commercially because customer qualification, integration effort, supply continuity, lifecycle support and total system economics influence purchasing decisions alongside unit price. Suppliers that address those constraints early can hold specification positions through multiple product cycles, while vendors that compete only on headline performance face greater substitution risk when programs move from engineering samples into volume deployment.
Wafer fabrication
Foundries create most of the manufacturing value by combining equipment, recipes, statistical process control and yield learning into a repeatable qualified flow. The same 28nm label can hide meaningful differences in high-performance, low-power, RF, embedded-memory or high-voltage modules, which is why customer design kits and process-specific reliability data are critical commercial assets. For the 28nm wafer foundry, this mechanism matters commercially because customer qualification, integration effort, supply continuity, lifecycle support and total system economics influence purchasing decisions alongside unit price. Suppliers that address those constraints early can hold specification positions through multiple product cycles, while vendors that compete only on headline performance face greater substitution risk when programs move from engineering samples into volume deployment.
Assembly, test & packaging
Finished wafers move into backend assembly and test where die are packaged, screened and prepared for the customer’s system. 28nm products span low-cost packages through more specialized automotive and RF formats, so backend availability can constrain shipments even when wafer supply is adequate. Close coordination between foundry, OSAT and customer improves ramp predictability. For the 28nm wafer foundry, this mechanism matters commercially because customer qualification, integration effort, supply continuity, lifecycle support and total system economics influence purchasing decisions alongside unit price. Suppliers that address those constraints early can hold specification positions through multiple product cycles, while vendors that compete only on headline performance face greater substitution risk when programs move from engineering samples into volume deployment.
System integration & lifecycle support
Downstream customers validate the packaged IC inside a complete system and may keep the qualified design active for years. Software, firmware, certification and reliability work make late process changes expensive, which gives foundries an incentive to maintain stable 28nm technology and communicate material or equipment changes carefully throughout the product lifecycle. For the 28nm wafer foundry, this mechanism matters commercially because customer qualification, integration effort, supply continuity, lifecycle support and total system economics influence purchasing decisions alongside unit price. Suppliers that address those constraints early can hold specification positions through multiple product cycles, while vendors that compete only on headline performance face greater substitution risk when programs move from engineering samples into volume deployment.
Recent Developments in the 28nm Wafer Foundry Market
Recent official foundry announcements show that 28nm remains an actively managed platform. UMC is adding large-scale 22/28nm capacity in Singapore, while TSMC and Samsung continue to publish broad 28nm technology portfolios covering low-power, RF, automotive, high-voltage and embedded-memory functions. These developments reinforce the view that mature-node growth is driven by specialization and capacity resilience rather than transistor scaling alone.
UMC announced the opening of a new Singapore facility equipped for 22nm and 28nm production, with up to US$5 billion planned to bring the first phase to 30,000 wafers per month. The company linked the facility to smartphone display chips, IoT memory and connectivity products, directly expanding qualified mature-node capacity in Southeast Asia. For the 28nm wafer foundry, this mechanism matters commercially because customer qualification, integration effort, supply continuity, lifecycle support and total system economics influence purchasing decisions alongside unit price. Suppliers that address those constraints early can hold specification positions through multiple product cycles, while vendors that compete only on headline performance face greater substitution risk when programs move from engineering samples into volume deployment.
TSMC’s official 28nm technology page describes high-performance, high-performance compact and ultra-low-power logic options together with RF and automotive-oriented specialty capabilities. The continued portfolio breadth indicates that 28nm remains a platform for multiple active product categories rather than a single legacy logic flow, supporting long-tail foundry demand. For the 28nm wafer foundry, this mechanism matters commercially because customer qualification, integration effort, supply continuity, lifecycle support and total system economics influence purchasing decisions alongside unit price. Suppliers that address those constraints early can hold specification positions through multiple product cycles, while vendors that compete only on headline performance face greater substitution risk when programs move from engineering samples into volume deployment.
Samsung Foundry’s specialty technology material describes mass-produced 28nm high-voltage display-driver technology and 28nm options for embedded flash, RF and eMRAM. The mix shows how foundries can keep a mature node commercially relevant by adding specialized device modules that solve application-specific integration problems without requiring customers to migrate to a smaller geometry. For the 28nm wafer foundry, this mechanism matters commercially because customer qualification, integration effort, supply continuity, lifecycle support and total system economics influence purchasing decisions alongside unit price. Suppliers that address those constraints early can hold specification positions through multiple product cycles, while vendors that compete only on headline performance face greater substitution risk when programs move from engineering samples into volume deployment.
REPORT SCOPE & SEGMENTATION
The report scope preserves the source page’s 8 Inch Wafer and 12 Inch Wafer type segmentation and the listed smartphone, computer, IoT, automotive electronics, industrial control and other applications. It also records the source’s end-user, technology and platform axes while standardizing the financial series to a 2025 base, 2026 estimate and 2034 forecast using the published size anchors.
| Report attribute | Coverage |
|---|---|
| Market | 28nm Wafer Foundry |
| Base year | 2025 |
| Estimated year | 2026 |
| Forecast period | 2026–2034 |
| 2025 market size | USD 10.65 billion |
| 2034 forecast size | USD 30.22 billion |
| CAGR | 12.3% during 2026–2034 |
| Largest market in 2025 | Asia Pacific |
| By Type | 8 Inch Wafer; 12 Inch Wafer |
| By Application | Smartphone; Computer; IoT; Automotive Electronics; Industrial Control; Others |
| Additional segmentation | By End User: Consumer Electronics; Automotive; Industrial; Communications. By Technology: 28nm HPC; 28nm HPL; 28nm LP. By Platform: Handsets; Computing Devices; Networking Equipment; Automotive Systems. |
| Regions | North America; Europe; Asia Pacific; South America; Middle East & Africa |
| Companies profiled | TSMC; Samsung Foundry; GlobalFoundries; SMIC; UMC; Shanghai Huahong; PSMC; Vanguard International Semiconductor (VIS); Tower Semiconductor; DB HiTek; X-FAB; Silterra Malaysia; Grace Semiconductor Manufacturing (merged into HHGrace); United Microelectronics Corporation (UMC affiliate facilities) |
Frequently Asked Questions
What is the 28nm wafer foundry market size in 2025?
The global 28nm wafer foundry market is valued at USD 10.65 billion in 2025 in the standardized series used for this overview. For 28nm wafer foundry, the base-year figure anchors the segment, regional and competitive analysis and is carried unchanged wherever the 2025 value appears. The rebased series is particularly important here because the source page’s printed CAGR does not reconcile with its 2025 and 2034 market-size anchors.
What is the forecast size of the 28nm wafer foundry market by 2034?
The 28nm wafer foundry market is projected to reach USD 30.22 billion by 2034. For this 28nm wafer foundry forecast, the endpoint follows the annual growth path implied by the published size anchors, keeping the 2025 base, 2026 estimate and 2034 forecast aligned. The 2034 endpoint remains the source page’s published USD 30.22 billion figure, while only the annual rate and 2026 estimate are made internally consistent with the two size anchors.
What CAGR is expected for the 28nm wafer foundry market during 2026–2034?
The standardized 28nm wafer foundry outlook corresponds to a 12.3% CAGR during 2026–2034. The rate is the compound annual change implied by the market-size anchors used for this specific market series rather than a separate assumption. For 28nm foundry services, the anchor-implied rate is lower than the page label, so this overview uses the mathematically consistent rate throughout every section and workbook field.
Which region is the largest 28nm wafer foundry market in 2025?
Asia Pacific is identified as the largest 28nm wafer foundry market in 2025. Its position reflects the concentration of relevant manufacturing, infrastructure, customers or deployment activity in this product category. The region combines the largest concentration of foundry capacity with packaging, materials and electronics-manufacturing ecosystems across Taiwan, China, South Korea, Japan and Southeast Asia. For the 28nm wafer foundry, this mechanism matters commercially because customer qualification, integration effort, supply continuity, lifecycle support and total system economics influence purchasing decisions alongside unit price. Suppliers that address those constraints early can hold specification positions through multiple product cycles, while vendors that compete only on headline performance face greater substitution risk when programs move from engineering samples into volume deployment.
Which product type leads the 28nm wafer foundry market?
12 Inch Wafer is the leading type identified in the 28nm wafer foundry source segmentation. Its position reflects the breadth of qualified use cases, installed customer requirements and system architectures that already support the segment. The source identifies 12-inch wafers as leading because high-volume 300 mm production spreads fixed process steps across more die and supports the economics required by large customer ramps.
Which application is most important in the 28nm wafer foundry market?
Smartphone is the leading application identified in the 28nm wafer foundry source scope. Purchasing occurs when operators or equipment makers redesign platforms, add capacity or digitize workflows in ways that require the products covered by this market. Smartphone designs use 28nm when mature yield, low power, established IP and wafer cost create a better system trade-off than migrating every supporting chip to an advanced node.
Which region has the strongest growth outlook for the 28nm wafer foundry market?
Asia Pacific has the strongest growth profile in this 28nm wafer foundry overview. The growth mechanism is linked to the region’s specific investment, manufacturing and infrastructure pattern rather than replacement demand alone. Capacity investment such as UMC’s Singapore 22/28nm expansion reinforces Asia Pacific’s role as both the production center and the region with the deepest customer and supplier network.
What are the main growth drivers for the 28nm wafer foundry market?
The principal 28nm wafer foundry growth drivers are the mature node’s cost-performance balance, diversified demand from IoT and automotive, new 300 mm capacity and specialty extensions including RF, embedded memory and high-voltage functions. These forces translate technical adoption into sustained purchasing when customers move from evaluation into repeat deployment and require qualified suppliers, integration support and dependable lifecycle service.
What are the main restraints on the 28nm wafer foundry market?
The principal 28nm wafer foundry restraints are high fab capital intensity, customer switching costs, competition from adjacent nodes and geopolitical constraints that can limit technology, equipment or customer access. These factors can slow conversion of technical demand into revenue, especially for suppliers that lack established customer qualification, manufacturing scale, local service or access to the broader ecosystem needed for deployment.
Who are the key suppliers in the 28nm wafer foundry market?
The 28nm wafer foundry competitive landscape includes the companies listed in the source report scope together with ecosystem participants discussed in this overview. Major foundries differentiate through process libraries, specialty modules, yield, capacity geography and long-term qualification rather than by offering an undifferentiated wafer-processing service. Supplier advantage therefore depends on application-specific performance, manufacturability, reliability, engineering support and the ability to remain qualified through platform transitions.
Research Sources & Evidence Base
Get Sample Report PDF for Exclusive Insights
Report Sample Includes
- Table of Contents
- List of Tables & Figures
- Charts, Research Methodology, and more...