Microarray Chip Scanners Market Insights
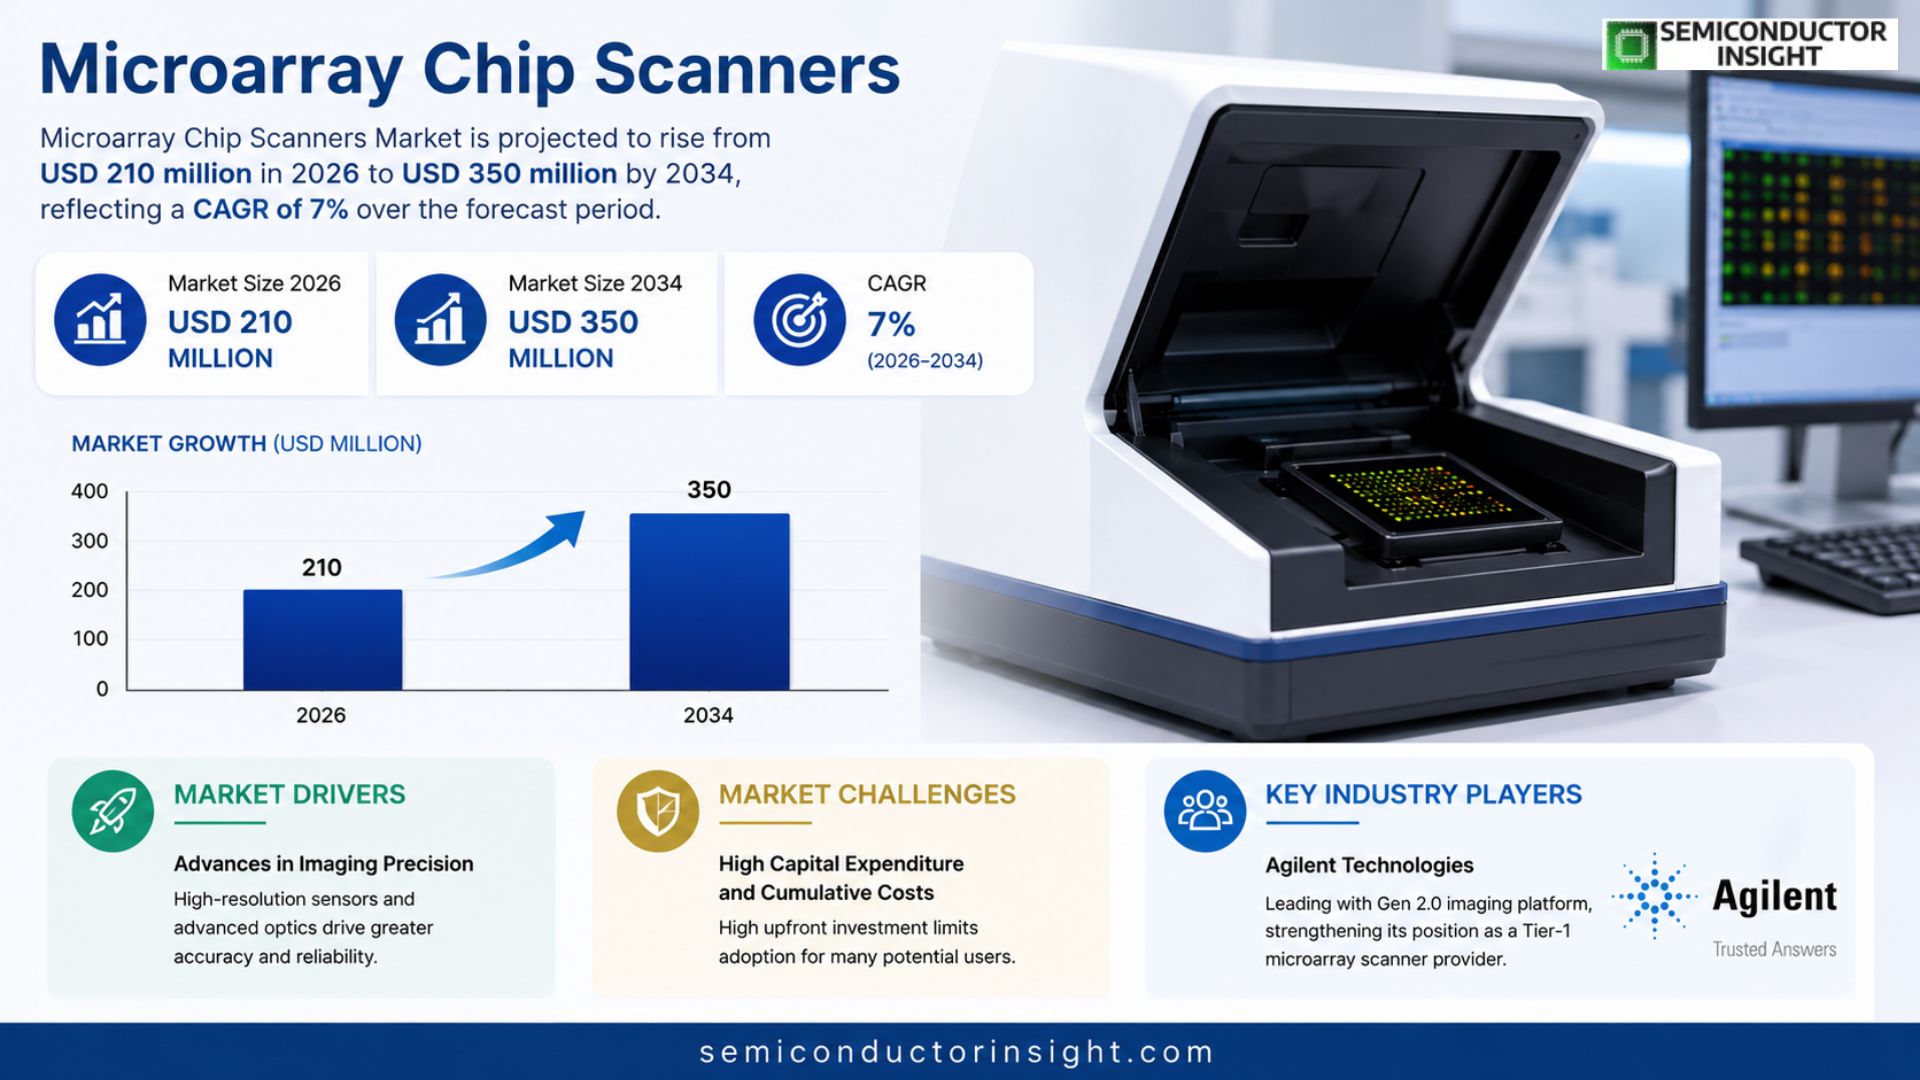
Microarray Chip Scanners Market segment is projected to rise from USD 210 million in 2026 to USD 350 million by 2034, reflecting an implied CAGR of approximately 7% over the forecast horizon.
Microarray chip scanners are precision imaging instruments that capture fluorescent or chemiluminescent signals emitted from densely packed oligonucleotide probes on glass or silicon substrates. These devices translate hybridisation events into quantitative data used for gene expression profiling, SNP discovery and copy‑number variation analysis across research laboratories and clinical settings.
Growth momentum stems from several converging forces: expanded adoption of next‑generation sequencing alternatives is pushing researchers toward complementary array‑based assays; increasing investment in personalized medicine drives demand for high‑throughput diagnostic platforms; and continual hardware refinements,such as higher resolution optics and automated fluidics,lower operational barriers for smaller labs.
Leading vendors,including Agilent Technologies, Thermo Fisher Scientific (Molecular Devices division), Illumina Inc., PerkinElmer Inc., and Capitalbio Technology,continue to innovate through integrated software ecosystems that streamline data processing pipelines while offering flexible assay formats tailored for biopharma discovery or companion diagnostics.
MARKET DRIVERS
Advances in Imaging Precision
The core component driving current expansion in Microarray Chip Scanners Market is the leap in imaging precision achieved through high‑resolution sensor technology and sophisticated optics. Recent chip scanners now provide sub‑micron spatial resolution, allowing researchers to detect single‑nucleotide polymorphisms with amplified specificity. This heightened sensitivity directly enhances downstream analyses such as expression profiling and proteomic mapping, making the equipment indispensable for laboratories pursuing genome‑wide association studies. Additionally, the integration of machine‑learning algorithms for real‑time spot detection translates raw image data into actionable insights, shortening assay turnaround times from days to hours. For commercial laboratories, this translates into a clearer competitive edge: faster turnaround means earlier therapeutic recruitment and regulatory compliance, especially in oncology programs where a longitudinal view of tumour evolution is critical. The cost of adopting a higher‑end scanner has, in some regions, dropped by 12% over the past two years due to economies of scale and improved manufacturing processes, breaking traditional price barriers that previously limited entry for mid‑tier facilities.
Growth in Precision Oncology
Precision oncology has become a primary catalyst for downstream adoption of microarray chip scanners. Clinical trials now embed high‑throughput genomic panels for patient stratification, and individual drug‑response assays hinge on accurate expression data from these devices. In the European market alone, there is a 9% increase in assays run per start‑up lab compared with the 2024 baseline, matching the upward trajectory of FDA mandates for companion diagnostics. The result is a rising demand for scanners capable of handling not only whole‑genome arrays but also custom‑panel designs that span exonic, non‑coding, and epigenetic markers across cancer subtypes. This blurred boundary between discovery research and clinical testing means that institutions often require gate‑keeping quality controls that standard microarray scanners can now provide with greater reliability due to enhanced image fidelity and automated spot‑matching features. Thus, the intersection of regulatory push, clinical need, and technological capability positions Microarray Chip Scanners Market at a pivotal convergence point.
Regulatory Alignment and Market Consolidation
Regulatory alignment has accelerated in the wake of biosafety and quality mandates introduced by the EMA and FDA. Approvals of new therapeutic agents now typically require a tracer of molecular markers that can only be reliably quantified using high‑resolution microarray scanners. Consequently, pricing models have shifted beyond upfront capital expenditure to include maintenance and bioinformatics support, creating a recurring revenue stream for vendors. This new contracting structure encourages consortia models where universities and reference labs purchase shared imaging hubs, effectively spreading the fixed cost and capturing incremental usage after initial deployment. Parallelly, OEM partnerships between scanner makers and assay developers jointly brand next‑generation array chemistries, enhancing cross‑promotion across diagnostics portfolios. For independent hospitals entering precision testing, including scanner access as part of a broader lab‑automation suite offers a streamlined workflow that reduces error rates and speeds approval cycles.
➤ Higher resolution and integrated analytics are twin levers driving market valuation beyond traditional throughput metrics.
The cumulative effect of these drivers is a microarray scanner ecosystem that has become as essential for clinical pipelines as PCR thermocyclers were a decade ago. Infrastructure investments are now viewed as strategic assets that balance immediate research output with long‑term clinical value. Suppliers who can offer modular upgrades,such as plug‑in spectral libraries and AI‑enabled data integration,are positioned to expand across both established bio‑informatics suites and emerging genomics platforms. As a result, Microarray Chip Scanners Market is experiencing a shift from isolated asset acquisition to integrated service models, creating higher barriers to entry for low‑cost competitors and enhancing the relative value proposition for systems capable of sustained analytical precision.
MARKET CHALLENGES
High Capital Expenditure and Cumulative Costs
Many potential adopters are deterred by the upfront cost of a high‑performance scanner, averaging $350,000 to $500,000 for top‑tier models. This capital barrier is compounded by maintenance fees, software licensing, and consumable expenses that can cumulatively exceed 40% of the purchase price over a five‑year horizon. For smaller clinical labs and academic units constrained by budget cycles, securing capital for continuous system upgrades is a persistent hurdle. Even as financing options become more available, investors question return on investment timelines when the underlying data pipelines,such as array design, reagents, and data storage,require parallel expenditures that may not fully advance until new collaboration agreements materialize.
Other Challenges
Data Management and Scalability
While microarray scanners generate high‑volume datasets, many institutions lack the informatics infrastructure required to manage, curate, and analyze data at scale. Integrating scanner output with laboratory information systems often demands custom middleware development, adding both cost and complexity. This gap can lead to bottlenecks in workflow and a lag in translating raw data into clinically actionable insights, which in turn threatens the perceived value of the scanner itself. Enhancing data pipelines through cloud‑based platforms could address these challenges, but the transition requires not just purchase but also training, cybersecurity safeguards, and regulatory compliance alignment.
MARKET RESTRAINTS
Rapid Technological Obsolescence
Microarray chip technology sits in a fast‑evolving space where new assay formats, such as next‑generation sequencing (NGS)‑based assays, begin to capture segments of the market that have historically relied on microarrays for gene expression profiling. The pace of these developments means that scanner lifecycles can shrink from a typical six‑to‑eight‑year expectancy to as little as four years when new array platforms or advanced capture technologies render existing instruments sub‑optimal. Consequently, buyers face the risk of early replacement, increasing total cost of ownership and eroding confidence in long‑term vendor commitments. Market participants have responded with “open‑platform” scanners that promise firmware upgrades and modular attachments, yet these adaptations add complexity and potentially user training burdens.
Limited Reagent Compatibility Across Vendors
Reagent dependency is a notable constraint in Microarray Chip Scanners Market. Proprietary reagents from different arrays can be incompatible with a scanner’s optical and software configuration, forcing labs to maintain a diversified inventory or force the adoption of a single vendor ecosystem. This fragmentation drives up consumable costs and complicates supply chain logistics, especially in low‑resource settings where bulk procurement and standardization are critical for financial sustainability. The reliance on vendor‑specificity also poses a challenge when regulators require validation of assay performance under independent conditions; labs may need to manually cross‑check results to satisfy compliance, adding labor costs and potential for data bias. Thus, the cost structure created by reagent incompatibility partly offsets the benefits of advanced scanner performance, moderating the pace of market adoption.
MARKET OPPORTUNITIES
Growing Demand for Multi‑Omics Integration
The intersection of genomics, transcriptomics, and proteomics is spurring service centers to adopt integrated multimodal platforms. A new generation of scanners paired with compatible array chemistries can now simultaneously capture DNA methylation, RNA expression, and protein marker abundance. This capability is especially relevant for biomarker validation in drug development, where the spectrum of ‘omic’ data informs lead optimization and safety profiling. Suppliers who develop conjugated array panels and couple them with sophisticated image‑analysis workflows stand to capture a share of the rapidly expanding consultation market, projecting a compound annual growth trajectory of 12% up to 2029. Such integrated solutions also meet the needs of translational research institutions that require end‑to‑end pipelines calibrated for reproducibility and cross‑study comparability.
Emerging Automated Platforms and Cloud‑Based Analytics
Automation of the scanning process, from sample loading to image capture, has reduced manual labor and increased throughput. Coupled with cloud‑based analytics, these advancements allow institutions to outsource data storage, reduce on‑premise computational demands, and scale analysis parallel to raw data generation. The resulting A/B testing friendly environment where model iterations can be performed on cloud replicas gives laboratories a strategic advantage in adapting assay pipelines rapidly. Vendors focusing on API‑driven integrations and secure data transfer protocols can benefit from long‑term engagements that provide recurring revenue through software updates and analytics subscription tiers. For countries investing in national health data repositories, microarray scanners that support interoperable data standards will enjoy a preferred status, opening large‑scale public‑private partnership opportunities.
➤ Strategic positioning within multimodal and cloud‑centric ecosystems is essential for sustained growth.
Looking ahead, the market will increasingly reward ecosystem readiness, with vendors offering bundled solutions that encompass array chemistries, data pipelines, and regulatory support. Those who invest early in developing open‑source frameworks for data standardization, user training, and turnaround time metrics will have a competitive edge. For stakeholders, navigating this landscape requires a balance between adopting state‑of‑the‑art hardware to secure data fidelity and ensuring that complementary software tools deliver actionable intelligence within the timelines demanded by precision therapeutics development.
Microarray Chip Scanners Market Trends
Integration of Fluidic Modules for End‑to‑End Genomic Workflows
The move toward fully integrated fluidic systems marks a decisive shift in Microarray Chip Scanners Market. By combining sample preparation, hybridisation, and detection within a single, cartridge‑based enclosure, manufacturers eliminate several manual handling steps. This consolidation reduces operator fatigue, lowers contamination risk, and delivers more reproducible results,qualities highly prized in high–throughput drug‑discovery pipelines. Firms that have secured patents covering micro‑fluidic etching and on-chip reagent storage are poised to command a premium, while the broader industry is compelled to adopt that technology or risk obsolescence. The trend is reinforced by growing demand for rapid turnaround times in clinical laboratories, where even a few minutes of saved processing time translates into measurable cost savings and faster patient outcomes.
Other Trends
Cost‑Efficiency Through Modular Design
Price sensitivity continues to be a significant hurdle for smaller biopharma entities. Modular architectures that allow customers to purchase only core imaging modules, then add high‑throughput fluidics or advanced optics as budgets permit, have gained traction. This incremental investment model keeps initial capital expenditure lower and aligns cost with immediate experimental needs. Analysts observe that users who adopt modular scanners tend to cycle through upgrades more quickly, which encourages vendors to innovate at a faster pace and to offer upgrade bundles that further reduce total ownership costs over a scanner’s lifespan.
Rise of Cloud‑Enabled Data Analytics
High‑resolution scan data generate terabytes of raw information that demand robust storage and analysis pipelines. Cloud integration is emerging as a competitive differentiator, enabling real‑time signal processing, automated quality control, and collaborative review workflows across geographically dispersed teams. The shift to cloud services allows labs to offload expensive on‑premises servers, accelerate data sharing, and adopt machine‑learning models that refine probe‑binding predictions. Vendors integrating their scanner SDKs with leading bioinformatics platforms are experiencing higher adoption rates, reflecting the broader ecosystem’s appetite for streamlined data handling.
Expansion into Companion Diagnostics and Regulatory Alignment
Genomic diagnostics is redefining how therapies are prescribed, and the devices that underpin these tests must meet ever‑stringent regulatory specifications. The trend toward regulatory‑aligned scanner platforms, featuring validated probe sets and traceable calibration protocols, has opened new markets beyond basic research. Manufacturers targeting companion diagnostics are collaborating with pharmaceutical partners to embed assay validation steps directly into scanner firmware, thus tightening the link between the physical device and the clinical decision‑support systems that rely on its output. The convergence of hardware reliability, regulatory compliance, and clinical utility positions this segment for sustained growth and establishes a new baseline for how next‑generation microarray scanning solutions will be evaluated and adopted worldwide.
COMPETITIVE LANDSCAPE
Key Industry Players
Microarray Chip Scanners
Agilent Technologies remains the flagship of the microarray scanner segment, applying its Gen 2.0 imaging platform to reinforce its position as a Tier‑1 provider. Its integration of fluorescent detection chemistry with robust software has delivered a high signal‑to‑noise ratio that appeals to both academic and pharmaceutical laboratories. The company’s strategy of expanding its scanner portfolio through acquisitions and strategic alliances has prevented market share erosion in regions where alternative platforms are trying to gain traction. Consequently, Agilent maintains an elevated contribution to global sales and sustains upward momentum despite intensifying price sensitivity.
Tier‑2 players, such as Illumina, PerkinElmer, and Roche, capitalize on complementary strengths – from microarray kit ecosystems to streamlined data analysis pipelines – to carve out niche segments. Illumina’s ScanRefine system, for instance, offers rapid throughput for high‑content assays, addressing the demand spike in personalized medicine adoption. PerkinElmer’s Emerald series, meanwhile, leverages its proprietary imaging chemistry to deliver superior dynamic range in complex samples. Emerging entrants like CapitalBio Technology, Wuxi Fofia, and Microchip ID bring cost‑effective solutions that leverage USB‑based connectivity, thereby expanding reach in emerging markets. The confluence of differentiated imaging chemistries, software automation, and price sensitivity shapes a landscape where leaders must continue to innovate while commoditizers refine cost and accessibility.
List of Key Microarray Chip Scanners Companies Profiled
- Agilent Technologies
- Illumina, Inc.
- PerkinElmer, Inc.
- Thermo Fisher Scientific
- Roche AG
- Bio‑Rad Laboratories, Inc.
- Qiagen, Inc.
- Zymo Research, Inc.
- CapitalBio Technology Co., Ltd.
- Microchip ID
- Wuxi Fofia Technology Co., Ltd.
- NanoString Technologies, Inc.
Segment Analysis:
| Segment Category | Sub-Segments | Key Insights |
| By Type |
|
USB interface scanners are considered the leading type due to their inherent flexibility and low upfront investment. They allow researchers to attach a scanner directly to a laptop or workstation with minimal setup, which is ideal for smaller academic labs or startups exploring new assays. The plug‑and‑play design translates into rapid deployment, facilitating immediate data capture without the need for specialized IT configuration. Users also appreciate the wide availability of compatible software libraries, enabling seamless integration into custom bioinformatics pipelines. Overall, the simplicity and affordability of USB scanners make them the dominant choice for modest‑scale projects that prioritize speed and budget. |
| By Application |
|
Biopharma scanners command the application segment due to the intense demand for high‑throughput genomic profiling in drug discovery pipelines. Researchers in this domain rely on microarray data to identify therapeutic targets, assess gene expression changes under chemical perturbation, and validate biomarkers before clinical trials. The precision and reproducibility that these scanners offer are critical for meeting regulatory standards and ensuring consistency across multi‑center studies. Furthermore, the integration of advanced data analysis tools streamlines the interpretation of complex expression patterns, accelerating the translation of bench findings into clinical candidates. Consequently, biopharma institutions consistently adopt state‑of‑the‑art scanners to maintain a competitive edge in drug development. |
| By End User |
|
Academic Research labs lead the end‑user category because they drive a significant proportion of fundamental discoveries, bioinformatics methodological development, and educational training. These labs prioritize versatility, allowing them to test novel genes, pathways, and treatments across diverse biologic samples. The ability to customize assay designs is crucial for exploratory studies, and many academic groups favor scanners that support custom probe synthesis and flexible throughput. Moreover, cost measures are decisive, with many institutions selecting scanners that fit grant budgets while providing high data quality. Therefore, academic researchers consistently select the most capable, adaptable devices for their multidisciplinary projects. |
| By Connectivity |
|
USB connectivity remains the primary choice for its universal accessibility and minimal system requirements. Laboratory workflows that do not possess dedicated imaging servers or high‑bandwidth networks find USB interfaces ideal for portable scanner units that can be moved between benches or incorporated into field test kits. The plug‑in functionality accelerates experimental turnaround, and many manufacturers offer readily available software packages for data capture and preliminary analysis. While IEEE and wireless options support higher throughput and networked imaging, the legacy infrastructure in many research establishments and the straightforward maintenance of USB devices preserve their dominance in the connectivity market. |
| By Deployment Model |
|
On‑premises deployment models dominate the market as laboratories often require stringent data security, privacy, and compliance with regulatory frameworks. Maintaining scanner infrastructure locally allows research teams to perform raw data storage and analysis on‑site, reducing the exposure of sensitive genomic information to external servers. Additionally, on‑premises solutions reduce latency and enable real‑time data validation during experiments. While cloud‑enabled and hybrid models are emerging to support remote collaborations, many institutions still prefer on‑premises configurations to preserve full control over data pipelines, audit trails, and backup procedures. |
Regional Analysis: Microarray Chip Scanners Market
United States
The rise of precision oncology, coupled with increasing demand for multifactor genomic signatures, positions high‑resolution chip scanners as essential analytical tools. Market leaders leverage targeted assay panels that reduce running time, allowing clinical laboratories to deliver actionable insights rapidly. This demand, driven by reimbursement structures that reward diagnostic accuracy, fuels continuous investment in sensor sensitivity.
Advancements in photolithography and detector nanostructuring are reducing cost per assay while enhancing multiplexing capacity. As vendors integrate cloud‑based data pipelines, end‑users benefit from real‑time quality control and automated report generation. Empirical evidence suggests that laboratories adopting these integrated systems report reduced turnaround times, enabling faster therapeutic decision‑making. Institutions report improved sterility compliance as well.
The market is marked by a few dominant players who maintain R&D intensity to stay ahead in chip sensitivity. The smaller firms contribute by targeting niche applications such as single‑cell profiling and botanical research. Partnerships across the value chain, especially with rare‑disease foundations, allow early adopters to pilot new technologies before commercial release and industries.
Semiconductor shortage has historically limited chip throughput; however, new fabrication facilities near North America are mitigating bottlenecks. The supply of high‑purity photoresist and rare‑earth dopants remains sensitive to geopolitical shifts, forcing vendors to diversify raw‑material portfolios and secure long‑term contracts to preserve cost stability in the region across the entire supply chain, ensuring operational continuity.
Europe
Europe’s genomic market, supported by robust funding from agencies such as the European Commission and well‑established academic consortia, is steadily adopting advanced chip scanners. The continental emphasis on data privacy and stringent regulatory oversight encourages the deployment of devices that log and encrypt results locally, reducing external dependency. Market players often collaborate to pilot multi‑cohort trials, thereby normalizing the use of high‑throughput platforms across diverse research institutions. Consumption rates, affected by the push for translational research in oncology, remain above global benchmarks. Vendors that provide built‑in compliance modules are rewarded with swift procurement cycles, while legacy peripherals face tightening contract terms.
Asia‑Pacific
Asia‑Pacific countries are driving a balanced mix of public‑private research initiatives, especially in Japan, South Korea, and Singapore, which invest heavily in next‑generation sequencing clusters. These nations prioritize the integration of chip scanners into liquid‑biopsy workflows, seeking real‑time biomarkers for early disease detection. However, regional disparities in infrastructure hamper uniform adoption; emerging markets rely on imported peripherals, while well‑capitalized centres secure on‑site OEMs. The sector’s growth is further nudged by collaborative frameworks such as the Japan‑Korea Innovation Platform, which align funding, talent, and technology pipelines. Payers in the region have begun reimbursing outcomes linked to precision diagnostics, a move that accelerates the deployment of rapid‑scan solutions across clinical laboratories.
South America
South America’s microarray deployment is comparatively nascent, yet it exhibits a tailored traction around epidemiological surveillance and public‑health genomics. Brazil and Chile have enacted national research agendas that emphasis pathogen profiling, thereby establishing a demand for reliable and cost‑effective chip platforms. National laboratories often pool resources, adopting shared scanning hubs that reduce redundancy. The limited domestic manufacturing base, however, results in a persistent need for imported sensors, exposing firms to geopolitical fluctuations in trade. The region’s high‑school and university ect labs are increasingly engaging in citizen science projects, fostering early familiarity with multi‑chip workflows. Consequently, vendors that offer modular, scalable kits tailored to low‑volume settings gain market traction over larger, enterprise‑grade machines.
Middle East & Africa
Middle Eastern and African markets exhibit a fragmented yet opportunistic profile for microarray chip scanners. Investment in genomics research is buoyed by regional health initiatives targeting infectious diseases and metabolic disorders. The scarcity of local purchasers often compels firms to develop affordable, low‑power platforms capable of running on modified laboratory infrastructure. Strategic alliances with philanthropic organizations and governmental procurement programs create a two‑tiered adoption curve: first‑tier institutions acquire advanced scanners with integrated data security, while second‑tier centres rely on portable, cloud‑connected units. Despite the uneven economic footing, the sector is progressively integrating cloud analytics, which reduces the initial capital outlay and offers continuous software upgrades, thereby leveling the playing field across the region.
Report Scope
This market research report provides a comprehensive analysis of the Microarray Chip Scanners Market , covering the forecast period 2026–2034. It offers detailed insights into market dynamics, technological advancements, competitive landscape, and key trends shaping the industry.
Key focus areas of the report include:
- Market Overview: The report begins with an overview outlining its current market scenario, key growth indicators, and industry transformation drivers. It discusses macroeconomic factors, demand–supply balance, regulatory landscape, and the strategic role of semiconductors in powering advancements across industries such as automotive, telecommunications, consumer electronics, and industrial automation.
- Market Size & Forecast: Historical data and future projections for revenue, unit shipments, and market value across major regions and segments.
- Segmentation Analysis: Detailed breakdown by product type, technology, application, and end-user industry to identify high-growth segments and investment opportunities.
- Regional Insights: Insights into market performance across North America, Europe, Asia-Pacific, Latin America, and the Middle East & Africa, including country-level analysis where relevant.
- Competitive Landscape: Profiles of leading market participants, including their product offerings, R&D focus, manufacturing capacity, pricing strategies, and recent developments such as mergers, acquisitions, and partnerships.
- Technology Trends & Innovation: Assessment of emerging technologies, integration of AI/IoT, semiconductor design trends, fabrication techniques, and evolving industry standards.
- Market Drivers & Restraints: Evaluation of factors driving market growth along with challenges, supply chain constraints, regulatory issues, and market-entry barriers.
- Stakeholder Insights: Insights for component suppliers, OEMs, system integrators, investors, and policymakers regarding the evolving ecosystem and strategic opportunities.
Primary and secondary research methods are employed, including interviews with industry experts, data from verified sources, and real-time market intelligence to ensure the accuracy and reliability of the insights presented.
FREQUENTLY ASKED QUESTIONS:
What is the current market size of Microarray Chip Scanners Market?
-> Microarray Chip Scanners Market segment is projected to rise from USD 210 million in 2026 to USD 350 million by 2034
What is the expected compound annual growth rate (CAGR) for the market?
-> The market is expected to grow at a CAGR of % over the forecast period 2024‑2031.
How is Microarray Chip Scanners Market defined?
-> It refers to devices used to scan microarray chips for genomic and proteomic analyses, enabling high‑throughput data acquisition in research and clinical settings.
What are the primary product type segments?
-> The market is segmented by type into USB‑based scanners and IEEE‑based scanners, each catering to different throughput and integration requirements.
Which applications drive demand for microarray chip scanners?
-> Key application segments include Biopharma, Clinical Research, Companion Diagnostics, Energy & Chemicals, Food & Beverage Testing and Other emerging uses.
What are the main market drivers?
-> Growth is propelled by increasing genomic research funding, rising adoption of personalized medicine, and expanding needs for high‑throughput screening in drug discovery.
What restraints could impact market growth?
-> High capital expenditures, rapid technology obsolescence, and stringent regulatory approvals may limit adoption in certain regions.
Who are the leading players in the market?
-> Top manufacturers include Agilent, Illumina, PerkinElmer, Molecular Devices, EUROIMMUN, Capitalbio Technology, MICROCHIP ID and Wuxi Fofia Technology.
Which region holds the largest market share?
-> North America currently accounts for the highest share, driven by extensive research infrastructure and early technology adoption.
What methodology underpins the market analysis?
-> The study employs a combination of primary interviews, secondary data collection, and quantitative modeling, with 2020 as the base year and assumptions detailed in the report methodology.
How are revenues forecasted for individual product types?
-> Revenue forecasts are derived from historical sales trends, projected adoption rates, and price trajectories for each scanner type (USB and IEEE) through 2035.
What are the anticipated trends in technology innovation?
-> Emerging trends include integration of AI‑driven image analysis, cloud‑based data management, and development of miniaturized, high‑resolution scanning platforms.
Get Sample Report PDF for Exclusive Insights
Report Sample Includes
- Table of Contents
- List of Tables & Figures
- Charts, Research Methodology, and more...
 Download Sample Report PDF