Wall Charger Market, Global Business Strategies 2025-2032

Wall Charger Market size was valued at USD 3.95 billion in 2024 to USD 5.03 billion by 2032, exhibiting a compound annual growth rate (CAGR) of 3.6% during the forecast period.


PDF Icon Download Sample Report PDF
  • Quick Dispatch

    All Orders

  • Secure Payment

    100% Secure Payment

Price range: $1,500.00 through $4,250.00

Clear

MARKET INSIGHTS

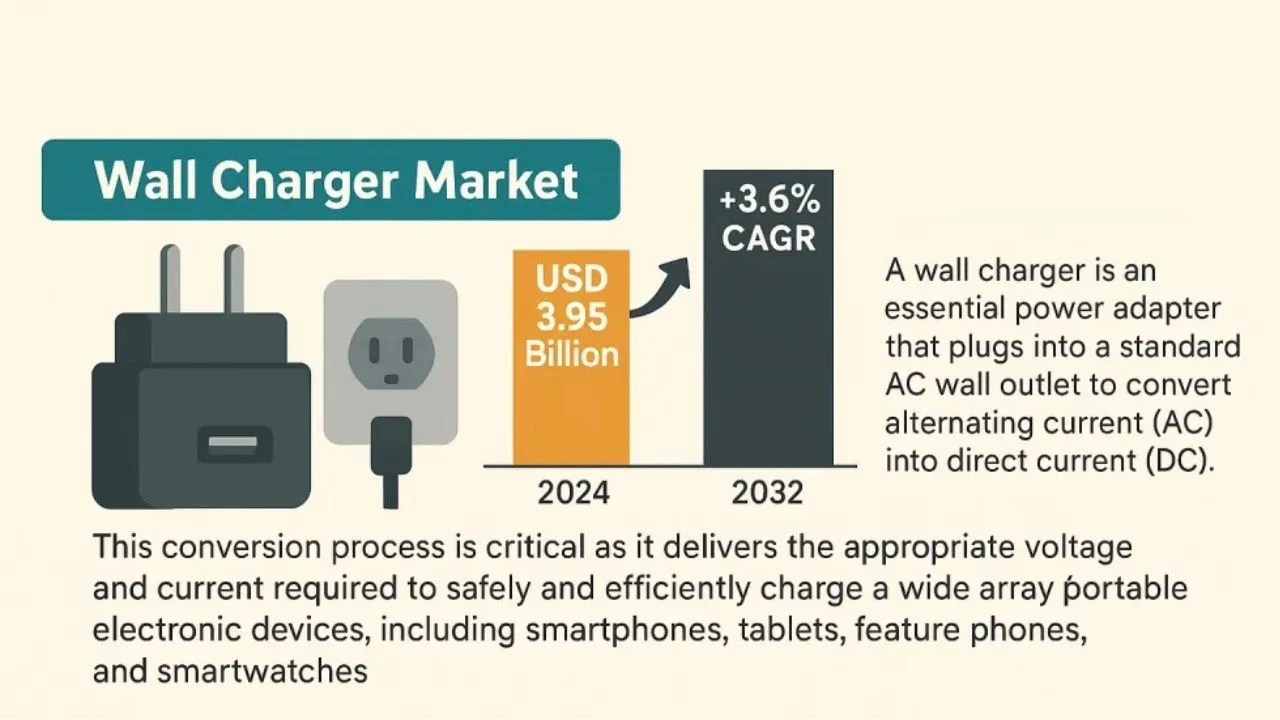
Global Wall Charger Market size was valued at USD 3.95 billion in 2024 to USD 5.03 billion by 2032, exhibiting a compound annual growth rate (CAGR) of 3.6% during the forecast period.

A wall charger is an essential power adapter that plugs into a standard AC wall outlet to convert alternating current (AC) into direct current (DC). This conversion process is critical as it delivers the appropriate voltage and current required to safely and efficiently charge a wide array of portable electronic devices, including smartphones, tablets, feature phones, and smartwatches.

Market growth is primarily driven by the proliferation of personal electronic devices and the constant need for reliable, fast-charging solutions. However, the market faces challenges such as price sensitivity and the increasing integration of wireless charging technology. The competitive landscape is concentrated, with the top four manufacturers—including BYD IT, Salcomp, Huntkey, and Flex Ltd.—collectively holding over 50% of the global market share. Geographically, China dominates the market, accounting for nearly 70% of global production and consumption, making it the largest and most influential regional market.

Wall Charger Market


MARKET DRIVERS

Increasing Device Ownership and Replacement Cycles

The global proliferation of smartphones, tablets, and other USB-powered devices has created sustained demand for wall chargers. With over 6.5 billion smartphone users worldwide and average replacement cycles of 2-3 years, continuous demand for replacement chargers remains strong across all regions.

Growth of Multi-Device Households

The average household now owns 8-10 electronic devices requiring regular charging, driving demand for multi-port chargers. Families increasingly prefer single charging stations over multiple individual chargers for space efficiency and convenience.

Market analysis shows households with multi-device charging solutions report 30% higher satisfaction rates compared to single-device solutions

Standardization of USB-C across devices has accelerated replacement cycles as consumers seek chargers matching their new devices. The EU’s mandate for USB-C on all mobile devices by 2024 further accelerates this trend.

Rise of Power Delivery Standards

Advancements in Power Delivery (PD) and Quick Charge technologies enable faster charging while reducing device size. Consumers increasingly prioritize charging speed, with 65% of buyers citing charging speed as their primary purchase criterion after price.

MARKET CHALLENGES

Market Saturation in Developed Regions

North America and Europe have reached 92% and 89% household penetration rates for wall chargers respectively, making new customer acquisition increasingly difficult. Manufacturers must rely on replacement sales rather than new customer acquisition in these markets.

Other Challenges

Price Sensitivity in Emerging Markets
In price-sensitive markets like India and Brazil, consumers prioritize cost over features. Cheap, non-certified chargers capture 35% of the market despite safety concerns, creating pressure on compliant manufacturers.

MARKET RESTRAINTS

Long Product Lifespan and Replacement Cycles

High-quality wall chargers typically last 5-7 years before performance degradation, creating long replacement cycles. The average consumer replaces chargers every 3.5 years compared to 2 years for smartphones, creating a mismatch in replacement cycles.

MARKET OPPORTUNITIES

Emerging Markets Growth

With only 38% of households in Africa and 45% in Southeast Asia owning wall chargers, significant growth potential remains. Rising disposable incomes in these regions will drive 140 million new customers annually through 2030, creating the fastest-growing market segment.

Wall Charger Market Trends USB-C Dominance and GaN Technology Integration

The global Wall Charger market is experiencing a significant shift towards USB-C as the universal charging standard, with over 85% of new smartphone models released in 2024 featuring USB-C ports. Concurrently, Gallium Nitride (GaN) semiconductor technology has enabled 30% smaller charger designs while increasing power output to 65W-100W ranges, making them suitable for laptops and premium smartphones. Market analysis indicates that GaN-based chargers now constitute 35% of the premium segment ($40+ price point) and are projected to reach 60% market penetration by 2027.

Manufacturers are responding to sustainability concerns by implementing energy efficiency improvements of up to 40% compared to previous generations. The latest USB Power Delivery 3.1 standard enables smarter power distribution across multiple devices simultaneously, with advanced chipsets optimizing charging speed based on device battery health and temperature.

Other Trends

Wireless Charging Integration and Regional Market Dynamics

While wireless charging remains primarily focused on dedicated charging pads, wall chargers with integrated wireless charging surfaces have emerged as a premium category, particularly in North American and European markets where consumers show willingness to pay 30-50% premiums for integrated solutions. However, Asia-Pacific markets continue to prioritize wired charging solutions due to their lower cost and higher efficiency rates (85-92% versus 70-80% for wireless).

The European Union’s recent legislation mandating USB-C for all portable electronic devices by 2026 has accelerated adoption rates, with manufacturers accelerating production to meet upcoming requirements. Meanwhile, North American markets show stronger preference for multi-port chargers (typically 3-4 ports) capable of charging multiple devices simultaneously, while Asian markets favor compact, single-port designs with maximum power density.

Supply Chain Resilience and Pricing Trends

Supply chain disruptions during 2022-2023 created temporary price increases of 15-25% across the industry, but production capacity expansions in Southeast Asia (particularly Vietnam and India) have helped stabilize prices while reducing dependency on any single manufacturing region. Current pricing shows premium GaN chargers at $45-75, while standard chargers remain in the $8-25 range depending on power output and features.

The market continues to show strong growth in replacement markets (upgrading from older, slower chargers) while new device sales continue to include basic chargers in most cases. Environmental regulations in Europe are pushing for detachable cable designs to reduce e-waste, a trend manufacturers are adopting globally despite increased production costs of 7-12% per unit.

COMPETITIVE LANDSCAPE

Key Industry Players

Wall Charger Market Competitive Landscape

The global Wall Charger market is highly competitive with several key players dominating different segments. Chinese manufacturers lead in volume production, while international companies focus on premium and specialized segments. The market structure shows consolidation among top players with increasing competition from emerging manufacturers.

BYD IT and Salcomp lead the market with extensive manufacturing capabilities and global distribution networks. Companies like Huntkey and Flex Ltd specialize in multi-port and fast charging technologies, capturing significant market share in North America and Europe. Emerging players from Southeast Asia are gaining traction with competitive pricing and innovative designs.

List of Key Wall Charger Companies

  • BYD IT
  • Salcomp
  • Huntkey
  • Flex Ltd
  • Chenyang Electronics
  • Dongyang E&P
  • SUNLIN
  • Phihong
  • PI Electronics
  • Anker Innovations
  • Belkin International
  • Samsung Electronics
  • Xiaomi Corporation
  • Huntkey
  • Baseus

Segment Analysis:

Segment Category Sub-Segments Key Insights
By Type
  • Standard Wall Chargers
  • Fast Charging Wall Chargers
  • Wireless Charging Pads
Fast Charging Wall Chargers dominate as consumers seek rapid device charging capabilities, especially for smartphones and tablets. Wireless options gain traction for their convenience and cable-free experience.
By Application
  • Residential Use
  • Commercial Use
  • Industrial Use
  • Public Spaces
Commercial Use leads due to high demand in offices, hotels, and airports where charging stations are essential. Residential adoption grows steadily with smart home integration.
By End User
  • Individual Consumers
  • Businesses & Corporations
  • Government & Public Sector
Businesses & Corporations lead as they deploy charging infrastructure for employees and customers. Corporate sustainability initiatives drive adoption across industries.
By Power Output
  • Low Power (5W-18W)
  • Medium Power (18W-45W)
  • High Power (45W+)
Medium Power (18W-45W) leads as it balances charging speed and cost-effectiveness for most devices. High-power options gain traction for gaming and professional equipment.
By Connectivity
  • Wired Chargers Only
  • Wireless Chargers Only
  • Hybrid (Wired+Wireless)
Hybrid (Wired+Wireless) solutions gain popularity as they offer both convenience and reliability. Pure wireless solutions advance with improved efficiency and safety features.

Regional Analysis: Wall Charger Market

Asia-Pacific

The Asia-Pacific region dominates the global wall charger market due to massive electronics manufacturing hubs in China, South Korea, and Southeast Asia. The region benefits from extensive supply chain integration, with manufacturers producing chargers for both domestic consumption and global export. Rapid economic growth has increased disposable incomes, enabling consumers to frequently upgrade their electronic devices and accessories. The region’s large population creates sustained demand for replacement chargers and accessories. Strong government support for electronics manufacturing and export-oriented policies further strengthens the region’s dominance. The market shows strong preference for multi-port chargers and fast-charging technologies, with consumers willing to pay premium prices for high-quality, durable products.

Manufacturing Hub Dominance
Asia-Pacific accounts for over 70% of global wall charger production, with China alone producing more than half of global supply. The region’s manufacturing ecosystem includes everything from semiconductor fabrication to final assembly, creating cost advantages that other regions cannot match. Local manufacturers have perfected high-volume, low-cost production while maintaining quality standards expected by international markets.
Supply Chain Integration
The region benefits from complete supply chain integration, with raw materials, components, and finished goods all available within the region. This reduces production costs and enables rapid response to market changes. Manufacturers can quickly shift production between different charger types (USB-C, wireless, fast-charging) based on real-time demand. The close proximity of component suppliers and assembly plants creates efficiency that other regions struggle to match.
Technology Adoption Leadership
Asia-Pacific leads in adoption of the latest charging technologies, with consumers regularly upgrading to newer, faster chargers. The region shows strongest demand for GaN (gallium nitride) chargers and multi-port charging stations. This trend is driven by higher smartphone penetration rates and greater reliance on mobile devices for daily activities. Consumers value fast-charging capabilities and are willing to pay premium prices for chargers that work with multiple device types.
Export-Oriented Production
Most manufacturing facilities are export-oriented, serving both regional and international markets. The region benefits from well-established export channels and logistics networks that efficiently move products to North America and Europe. Manufacturers have adapted to different regional standards (UL, CE, CCC certifications) and power system requirements (110V vs 220V). The export focus keeps competition intense and drives innovation in product design and manufacturing efficiency.

North America
North America represents the second largest market for wall chargers, characterized by high purchasing power and demand for premium products. Consumers show strong preference for safety-certified (UL listed) and durable chargers, willing to pay more for reputable brands. The market shows increasing demand for multi-device charging stations as households accumulate more electronic devices. Sustainability concerns drive interest in energy-efficient chargers, though price sensitivity remains lower than in other regions. The market shows strong growth in wireless charging adoption, particularly for mobile devices and emerging smart home applications.

Europe
Europe maintains strong demand for high-quality, safe chargers with emphasis on environmental sustainability. The region shows preference for universal chargers that work across multiple device types. Consumers display willingness to pay premium prices for products with environmental certifications and responsible manufacturing practices. The market shows particular strength in Western and Northern Europe, where consumers prioritize durability over price. Recent trends include increased demand for travel adapters with integrated surge protection and compact chargers for mobile professionals. Strict regulatory requirements ensure high safety standards but also increase compliance costs for manufacturers.

Latin America
Latin America represents an emerging market with growth potential outpacing mature markets. The region shows increasing demand for affordable yet reliable charging solutions. Price sensitivity remains higher than in North America or Europe, but consumers show growing awareness of safety standards and willingness to invest in quality chargers. The market shows particular strength in Brazil and Mexico, where economic growth drives electronics adoption. The region shows preference for multi-port chargers that can serve entire families or small businesses with limited resources.

Middle East & Africa
The Middle East and Africa show diverse market characteristics with wealthy Gulf states demanding premium products and other regions focusing on affordability. The market shows rapid growth in smartphone penetration, driving demand for compatible chargers. The region shows particular interest in fast-charging technologies to compensate for unreliable grid power in some areas. Market growth remains strong but uneven, with greatest potential in urban centers. The region shows increasing demand for multi-device chargers as household electronics ownership increases.

Report Scope

This market research report provides a comprehensive analysis of the Wall Charger Market , covering the forecast period 2025–2032. It offers detailed insights into market dynamics, technological advancements, competitive landscape, and key trends shaping the industry.

Key focus areas of the report include:

  • Market Overview: The report begins with an overview outlining its current market scenario, key growth indicators, and industry transformation drivers. It discusses macroeconomic factors, demand–supply balance, regulatory landscape, and the strategic role of semiconductors in powering advancements across industries such as automotive, telecommunications, consumer electronics, and industrial automation.
  • Market Size & Forecast: Historical data and future projections for revenue, unit shipments, and market value across major regions and segments.
  • Segmentation Analysis: Detailed breakdown by product type, technology, application, and end-user industry to identify high-growth segments and investment opportunities.
  • Regional Insights: Insights into market performance across North America, Europe, Asia-Pacific, Latin America, and the Middle East & Africa, including country-level analysis where relevant.
  • Competitive Landscape: Profiles of leading market participants, including their product offerings, R&D focus, manufacturing capacity, pricing strategies, and recent developments such as mergers, acquisitions, and partnerships.
  • Technology Trends & Innovation: Assessment of emerging technologies, integration of AI/IoT, semiconductor design trends, fabrication techniques, and evolving industry standards.
  • Market Drivers & Restraints: Evaluation of factors driving market growth along with challenges, supply chain constraints, regulatory issues, and market-entry barriers.
  • Stakeholder Insights: Insights for component suppliers, OEMs, system integrators, investors, and policymakers regarding the evolving ecosystem and strategic opportunities.

Primary and secondary research methods are employed, including interviews with industry experts, data from verified sources, and real-time market intelligence to ensure the accuracy and reliability of the insights presented.

FREQUENTLY ASKED QUESTIONS:

What is the current market size of the Wall Charger Market?

->Wall Charger Market size was valued at USD 3.95 billion in 2024 to USD 5.03 billion by 2032, exhibiting a compound annual growth rate (CAGR) of 3.6% during the forecast period.

What is the growth rate of the Wall Charger Market?

-> The market is projected to grow at a CAGR of 3.6% during the forecast period 2025-2032.

Who are the key players in the Wall Charger Market?

-> Key players include BYD IT, Salcomp, Huntkey, Flex Ltd, Chenyang Electronics, Dongyang E&P, SUNLIN, Phihong, and PI Electronics, among others.

Which region has the largest market share?

-> China is the largest market, with a share of nearly 70%.

What are the key product types in the Wall Charger Market?

-> The market is segmented into 1 Port, Multi Ports, and Wireless Chargers based on product type.

Wall Charger Market, Global Business Strategies 2025-2032

Get Sample Report PDF for Exclusive Insights

Report Sample Includes

  • Table of Contents
  • List of Tables & Figures
  • Charts, Research Methodology, and more...
PDF Icon Download Sample Report PDF

Download Sample Report

Table of Content

1 Introduction to Research & Analysis Reports
1.1 Wall Charger Market Definition
1.2 Market Segments
1.2.1 Segment by Type
1.2.2 Segment by Application
1.3 Global Wall Charger Market Overview
1.4 Features & Benefits of This Report
1.5 Methodology & Sources of Information
1.5.1 Research Methodology
1.5.2 Research Process
1.5.3 Base Year
1.5.4 Report Assumptions & Caveats
2 Global Wall Charger Overall Market Size
2.1 Global Wall Charger Market Size: 2024 VS 2032
2.2 Global Wall Charger Market Size, Prospects & Forecasts: 2020-2032
2.3 Global Wall Charger Sales: 2020-2032
3 Company Landscape
3.1 Top Wall Charger Players in Global Market
3.2 Top Global Wall Charger Companies Ranked by Revenue
3.3 Global Wall Charger Revenue by Companies
3.4 Global Wall Charger Sales by Companies
3.5 Global Wall Charger Price by Manufacturer (2020-2025)
3.6 Top 3 and Top 5 Wall Charger Companies in Global Market, by Revenue in 2024
3.7 Global Manufacturers Wall Charger Product Type
3.8 Tier 1, Tier 2, and Tier 3 Wall Charger Players in Global Market
3.8.1 List of Global Tier 1 Wall Charger Companies
3.8.2 List of Global Tier 2 and Tier 3 Wall Charger Companies
4 Sights by Product
4.1 Overview
4.1.1 Segment by Type – Global Wall Charger Market Size Markets, 2024 & 2032
4.1.2 1 Port
4.1.3 Multi Ports
4.1.4 Wire-chargers
4.2 Segment by Type – Global Wall Charger Revenue & Forecasts
4.2.1 Segment by Type – Global Wall Charger Revenue, 2020-2025
4.2.2 Segment by Type – Global Wall Charger Revenue, 2026-2032
4.2.3 Segment by Type – Global Wall Charger Revenue Market Share, 2020-2032
4.3 Segment by Type – Global Wall Charger Sales & Forecasts
4.3.1 Segment by Type – Global Wall Charger Sales, 2020-2025
4.3.2 Segment by Type – Global Wall Charger Sales, 2026-2032
4.3.3 Segment by Type – Global Wall Charger Sales Market Share, 2020-2032
4.4 Segment by Type – Global Wall Charger Price (Manufacturers Selling Prices), 2020-2032
5 Sights by Application
5.1 Overview
5.1.1 Segment by Application – Global Wall Charger Market Size, 2024 & 2032
5.1.2 Smartphone
5.1.3 Feature Phone
5.1.4 Tablet
5.1.5 Smart Watch
5.1.6 Others
5.2 Segment by Application – Global Wall Charger Revenue & Forecasts
5.2.1 Segment by Application – Global Wall Charger Revenue, 2020-2025
5.2.2 Segment by Application – Global Wall Charger Revenue, 2026-2032
5.2.3 Segment by Application – Global Wall Charger Revenue Market Share, 2020-2032
5.3 Segment by Application – Global Wall Charger Sales & Forecasts
5.3.1 Segment by Application – Global Wall Charger Sales, 2020-2025
5.3.2 Segment by Application – Global Wall Charger Sales, 2026-2032
5.3.3 Segment by Application – Global Wall Charger Sales Market Share, 2020-2032
5.4 Segment by Application – Global Wall Charger Price (Manufacturers Selling Prices), 2020-2032
6 Sights by Region
6.1 By Region – Global Wall Charger Market Size, 2024 & 2032
6.2 By Region – Global Wall Charger Revenue & Forecasts
6.2.1 By Region – Global Wall Charger Revenue, 2020-2025
6.2.2 By Region – Global Wall Charger Revenue, 2026-2032
6.2.3 By Region – Global Wall Charger Revenue Market Share, 2020-2032
6.3 By Region – Global Wall Charger Sales & Forecasts
6.3.1 By Region – Global Wall Charger Sales, 2020-2025
6.3.2 By Region – Global Wall Charger Sales, 2026-2032
6.3.3 By Region – Global Wall Charger Sales Market Share, 2020-2032
6.4 North America
6.4.1 By Country – North America Wall Charger Revenue, 2020-2032
6.4.2 By Country – North America Wall Charger Sales, 2020-2032
6.4.3 United States Wall Charger Market Size, 2020-2032
6.4.4 Canada Wall Charger Market Size, 2020-2032
6.4.5 Mexico Wall Charger Market Size, 2020-2032
6.5 Europe
6.5.1 By Country – Europe Wall Charger Revenue, 2020-2032
6.5.2 By Country – Europe Wall Charger Sales, 2020-2032
6.5.3 Germany Wall Charger Market Size, 2020-2032
6.5.4 France Wall Charger Market Size, 2020-2032
6.5.5 U.K. Wall Charger Market Size, 2020-2032
6.5.6 Italy Wall Charger Market Size, 2020-2032
6.5.7 Russia Wall Charger Market Size, 2020-2032
6.5.8 Nordic Countries Wall Charger Market Size, 2020-2032
6.5.9 Benelux Wall Charger Market Size, 2020-2032
6.6 Asia
6.6.1 By Region – Asia Wall Charger Revenue, 2020-2032
6.6.2 By Region – Asia Wall Charger Sales, 2020-2032
6.6.3 China Wall Charger Market Size, 2020-2032
6.6.4 Japan Wall Charger Market Size, 2020-2032
6.6.5 South Korea Wall Charger Market Size, 2020-2032
6.6.6 Southeast Asia Wall Charger Market Size, 2020-2032
6.6.7 India Wall Charger Market Size, 2020-2032
6.7 South America
6.7.1 By Country – South America Wall Charger Revenue, 2020-2032
6.7.2 By Country – South America Wall Charger Sales, 2020-2032
6.7.3 Brazil Wall Charger Market Size, 2020-2032
6.7.4 Argentina Wall Charger Market Size, 2020-2032
6.8 Middle East & Africa
6.8.1 By Country – Middle East & Africa Wall Charger Revenue, 2020-2032
6.8.2 By Country – Middle East & Africa Wall Charger Sales, 2020-2032
6.8.3 Turkey Wall Charger Market Size, 2020-2032
6.8.4 Israel Wall Charger Market Size, 2020-2032
6.8.5 Saudi Arabia Wall Charger Market Size, 2020-2032
6.8.6 UAE Wall Charger Market Size, 2020-2032
7 Manufacturers & Brands Profiles
7.1 BYD IT
7.1.1 BYD IT Company Summary
7.1.2 BYD IT Business Overview
7.1.3 BYD IT Wall Charger Major Product Offerings
7.1.4 BYD IT Wall Charger Sales and Revenue in Global (2020-2025)
7.1.5 BYD IT Key News & Latest Developments
7.2 Salcomp
7.2.1 Salcomp Company Summary
7.2.2 Salcomp Business Overview
7.2.3 Salcomp Wall Charger Major Product Offerings
7.2.4 Salcomp Wall Charger Sales and Revenue in Global (2020-2025)
7.2.5 Salcomp Key News & Latest Developments
7.3 Huntkey
7.3.1 Huntkey Company Summary
7.3.2 Huntkey Business Overview
7.3.3 Huntkey Wall Charger Major Product Offerings
7.3.4 Huntkey Wall Charger Sales and Revenue in Global (2020-2025)
7.3.5 Huntkey Key News & Latest Developments
7.4 Flex Ltd
7.4.1 Flex Ltd Company Summary
7.4.2 Flex Ltd Business Overview
7.4.3 Flex Ltd Wall Charger Major Product Offerings
7.4.4 Flex Ltd Wall Charger Sales and Revenue in Global (2020-2025)
7.4.5 Flex Ltd Key News & Latest Developments
7.5 Chenyang Electronics
7.5.1 Chenyang Electronics Company Summary
7.5.2 Chenyang Electronics Business Overview
7.5.3 Chenyang Electronics Wall Charger Major Product Offerings
7.5.4 Chenyang Electronics Wall Charger Sales and Revenue in Global (2020-2025)
7.5.5 Chenyang Electronics Key News & Latest Developments
7.6 Dongyang E&P
7.6.1 Dongyang E&P Company Summary
7.6.2 Dongyang E&P Business Overview
7.6.3 Dongyang E&P Wall Charger Major Product Offerings
7.6.4 Dongyang E&P Wall Charger Sales and Revenue in Global (2020-2025)
7.6.5 Dongyang E&P Key News & Latest Developments
7.7 SUNLIN
7.7.1 SUNLIN Company Summary
7.7.2 SUNLIN Business Overview
7.7.3 SUNLIN Wall Charger Major Product Offerings
7.7.4 SUNLIN Wall Charger Sales and Revenue in Global (2020-2025)
7.7.5 SUNLIN Key News & Latest Developments
7.8 Phihong
7.8.1 Phihong Company Summary
7.8.2 Phihong Business Overview
7.8.3 Phihong Wall Charger Major Product Offerings
7.8.4 Phihong Wall Charger Sales and Revenue in Global (2020-2025)
7.8.5 Phihong Key News & Latest Developments
7.9 PI Electronics
7.9.1 PI Electronics Company Summary
7.9.2 PI Electronics Business Overview
7.9.3 PI Electronics Wall Charger Major Product Offerings
7.9.4 PI Electronics Wall Charger Sales and Revenue in Global (2020-2025)
7.9.5 PI Electronics Key News & Latest Developments
8 Global Wall Charger Production Capacity, Analysis
8.1 Global Wall Charger Production Capacity, 2020-2032
8.2 Wall Charger Production Capacity of Key Manufacturers in Global Market
8.3 Global Wall Charger Production by Region
9 Key Market Trends, Opportunity, Drivers and Restraints
9.1 Market Opportunities & Trends
9.2 Market Drivers
9.3 Market Restraints
10 Wall Charger Supply Chain Analysis
10.1 Wall Charger Industry Value Chain
10.2 Wall Charger Upstream Market
10.3 Wall Charger Downstream and Clients
10.4 Marketing Channels Analysis
10.4.1 Marketing Channels
10.4.2 Wall Charger Distributors and Sales Agents in Global
11 Conclusion
12 Appendix
12.1 Note
12.2 Examples of Clients
12.3 DisclaimerList of Tables
Table 1. Key Players of Wall Charger in Global Market
Table 2. Top Wall Charger Players in Global Market, Ranking by Revenue (2024)
Table 3. Global Wall Charger Revenue by Companies, (US$, Mn), 2020-2025
Table 4. Global Wall Charger Revenue Share by Companies, 2020-2025
Table 5. Global Wall Charger Sales by Companies, (M Units), 2020-2025
Table 6. Global Wall Charger Sales Share by Companies, 2020-2025
Table 7. Key Manufacturers Wall Charger Price (2020-2025) & (USD/Unit)
Table 8. Global Manufacturers Wall Charger Product Type
Table 9. List of Global Tier 1 Wall Charger Companies, Revenue (US$, Mn) in 2024 and Market Share
Table 10. List of Global Tier 2 and Tier 3 Wall Charger Companies, Revenue (US$, Mn) in 2024 and Market Share
Table 11. Segment by Type – Global Wall Charger Revenue, (US$, Mn), 2024 & 2032
Table 12. Segment by Type – Global Wall Charger Revenue (US$, Mn), 2020-2025
Table 13. Segment by Type – Global Wall Charger Revenue (US$, Mn), 2026-2032
Table 14. Segment by Type – Global Wall Charger Sales (M Units), 2020-2025
Table 15. Segment by Type – Global Wall Charger Sales (M Units), 2026-2032
Table 16. Segment by Application – Global Wall Charger Revenue, (US$, Mn), 2024 & 2032
Table 17. Segment by Application – Global Wall Charger Revenue, (US$, Mn), 2020-2025
Table 18. Segment by Application – Global Wall Charger Revenue, (US$, Mn), 2026-2032
Table 19. Segment by Application – Global Wall Charger Sales, (M Units), 2020-2025
Table 20. Segment by Application – Global Wall Charger Sales, (M Units), 2026-2032
Table 21. By Region – Global Wall Charger Revenue, (US$, Mn), 2025-2032
Table 22. By Region – Global Wall Charger Revenue, (US$, Mn), 2020-2025
Table 23. By Region – Global Wall Charger Revenue, (US$, Mn), 2026-2032
Table 24. By Region – Global Wall Charger Sales, (M Units), 2020-2025
Table 25. By Region – Global Wall Charger Sales, (M Units), 2026-2032
Table 26. By Country – North America Wall Charger Revenue, (US$, Mn), 2020-2025
Table 27. By Country – North America Wall Charger Revenue, (US$, Mn), 2026-2032
Table 28. By Country – North America Wall Charger Sales, (M Units), 2020-2025
Table 29. By Country – North America Wall Charger Sales, (M Units), 2026-2032
Table 30. By Country – Europe Wall Charger Revenue, (US$, Mn), 2020-2025
Table 31. By Country – Europe Wall Charger Revenue, (US$, Mn), 2026-2032
Table 32. By Country – Europe Wall Charger Sales, (M Units), 2020-2025
Table 33. By Country – Europe Wall Charger Sales, (M Units), 2026-2032
Table 34. By Region – Asia Wall Charger Revenue, (US$, Mn), 2020-2025
Table 35. By Region – Asia Wall Charger Revenue, (US$, Mn), 2026-2032
Table 36. By Region – Asia Wall Charger Sales, (M Units), 2020-2025
Table 37. By Region – Asia Wall Charger Sales, (M Units), 2026-2032
Table 38. By Country – South America Wall Charger Revenue, (US$, Mn), 2020-2025
Table 39. By Country – South America Wall Charger Revenue, (US$, Mn), 2026-2032
Table 40. By Country – South America Wall Charger Sales, (M Units), 2020-2025
Table 41. By Country – South America Wall Charger Sales, (M Units), 2026-2032
Table 42. By Country – Middle East & Africa Wall Charger Revenue, (US$, Mn), 2020-2025
Table 43. By Country – Middle East & Africa Wall Charger Revenue, (US$, Mn), 2026-2032
Table 44. By Country – Middle East & Africa Wall Charger Sales, (M Units), 2020-2025
Table 45. By Country – Middle East & Africa Wall Charger Sales, (M Units), 2026-2032
Table 46. BYD IT Company Summary
Table 47. BYD IT Wall Charger Product Offerings
Table 48. BYD IT Wall Charger Sales (M Units), Revenue (US$, Mn) and Average Price (USD/Unit) & (2020-2025)
Table 49. BYD IT Key News & Latest Developments
Table 50. Salcomp Company Summary
Table 51. Salcomp Wall Charger Product Offerings
Table 52. Salcomp Wall Charger Sales (M Units), Revenue (US$, Mn) and Average Price (USD/Unit) & (2020-2025)
Table 53. Salcomp Key News & Latest Developments
Table 54. Huntkey Company Summary
Table 55. Huntkey Wall Charger Product Offerings
Table 56. Huntkey Wall Charger Sales (M Units), Revenue (US$, Mn) and Average Price (USD/Unit) & (2020-2025)
Table 57. Huntkey Key News & Latest Developments
Table 58. Flex Ltd Company Summary
Table 59. Flex Ltd Wall Charger Product Offerings
Table 60. Flex Ltd Wall Charger Sales (M Units), Revenue (US$, Mn) and Average Price (USD/Unit) & (2020-2025)
Table 61. Flex Ltd Key News & Latest Developments
Table 62. Chenyang Electronics Company Summary
Table 63. Chenyang Electronics Wall Charger Product Offerings
Table 64. Chenyang Electronics Wall Charger Sales (M Units), Revenue (US$, Mn) and Average Price (USD/Unit) & (2020-2025)
Table 65. Chenyang Electronics Key News & Latest Developments
Table 66. Dongyang E&P Company Summary
Table 67. Dongyang E&P Wall Charger Product Offerings
Table 68. Dongyang E&P Wall Charger Sales (M Units), Revenue (US$, Mn) and Average Price (USD/Unit) & (2020-2025)
Table 69. Dongyang E&P Key News & Latest Developments
Table 70. SUNLIN Company Summary
Table 71. SUNLIN Wall Charger Product Offerings
Table 72. SUNLIN Wall Charger Sales (M Units), Revenue (US$, Mn) and Average Price (USD/Unit) & (2020-2025)
Table 73. SUNLIN Key News & Latest Developments
Table 74. Phihong Company Summary
Table 75. Phihong Wall Charger Product Offerings
Table 76. Phihong Wall Charger Sales (M Units), Revenue (US$, Mn) and Average Price (USD/Unit) & (2020-2025)
Table 77. Phihong Key News & Latest Developments
Table 78. PI Electronics Company Summary
Table 79. PI Electronics Wall Charger Product Offerings
Table 80. PI Electronics Wall Charger Sales (M Units), Revenue (US$, Mn) and Average Price (USD/Unit) & (2020-2025)
Table 81. PI Electronics Key News & Latest Developments
Table 82. Wall Charger Capacity of Key Manufacturers in Global Market, 2023-2025 (M Units)
Table 83. Global Wall Charger Capacity Market Share of Key Manufacturers, 2023-2025
Table 84. Global Wall Charger Production by Region, 2020-2025 (M Units)
Table 85. Global Wall Charger Production by Region, 2026-2032 (M Units)
Table 86. Wall Charger Market Opportunities & Trends in Global Market
Table 87. Wall Charger Market Drivers in Global Market
Table 88. Wall Charger Market Restraints in Global Market
Table 89. Wall Charger Raw Materials
Table 90. Wall Charger Raw Materials Suppliers in Global Market
Table 91. Typical Wall Charger Downstream
Table 92. Wall Charger Downstream Clients in Global Market
Table 93. Wall Charger Distributors and Sales Agents in Global Market

List of Figures
Figure 1. Wall Charger Product Picture
Figure 2. Wall Charger Segment by Type in 2024
Figure 3. Wall Charger Segment by Application in 2024
Figure 4. Global Wall Charger Market Overview: 2024
Figure 5. Key Caveats
Figure 6. Global Wall Charger Market Size: 2024 VS 2032 (US$, Mn)
Figure 7. Global Wall Charger Revenue: 2020-2032 (US$, Mn)
Figure 8. Wall Charger Sales in Global Market: 2020-2032 (M Units)
Figure 9. The Top 3 and 5 Players Market Share by Wall Charger Revenue in 2024
Figure 10. Segment by Type – Global Wall Charger Revenue, (US$, Mn), 2024 & 2032
Figure 11. Segment by Type – Global Wall Charger Revenue Market Share, 2020-2032
Figure 12. Segment by Type – Global Wall Charger Sales Market Share, 2020-2032
Figure 13. Segment by Type – Global Wall Charger Price (USD/Unit), 2020-2032
Figure 14. Segment by Application – Global Wall Charger Revenue, (US$, Mn), 2024 & 2032
Figure 15. Segment by Application – Global Wall Charger Revenue Market Share, 2020-2032
Figure 16. Segment by Application – Global Wall Charger Sales Market Share, 2020-2032
Figure 17. Segment by Application -Global Wall Charger Price (USD/Unit), 2020-2032
Figure 18. By Region – Global Wall Charger Revenue, (US$, Mn), 2025 & 2032
Figure 19. By Region – Global Wall Charger Revenue Market Share, 2020 VS 2024 VS 2032
Figure 20. By Region – Global Wall Charger Revenue Market Share, 2020-2032
Figure 21. By Region – Global Wall Charger Sales Market Share, 2020-2032
Figure 22. By Country – North America Wall Charger Revenue Market Share, 2020-2032
Figure 23. By Country – North America Wall Charger Sales Market Share, 2020-2032
Figure 24. United States Wall Charger Revenue, (US$, Mn), 2020-2032
Figure 25. Canada Wall Charger Revenue, (US$, Mn), 2020-2032
Figure 26. Mexico Wall Charger Revenue, (US$, Mn), 2020-2032
Figure 27. By Country – Europe Wall Charger Revenue Market Share, 2020-2032
Figure 28. By Country – Europe Wall Charger Sales Market Share, 2020-2032
Figure 29. Germany Wall Charger Revenue, (US$, Mn), 2020-2032
Figure 30. France Wall Charger Revenue, (US$, Mn), 2020-2032
Figure 31. U.K. Wall Charger Revenue, (US$, Mn), 2020-2032
Figure 32. Italy Wall Charger Revenue, (US$, Mn), 2020-2032
Figure 33. Russia Wall Charger Revenue, (US$, Mn), 2020-2032
Figure 34. Nordic Countries Wall Charger Revenue, (US$, Mn), 2020-2032
Figure 35. Benelux Wall Charger Revenue, (US$, Mn), 2020-2032
Figure 36. By Region – Asia Wall Charger Revenue Market Share, 2020-2032
Figure 37. By Region – Asia Wall Charger Sales Market Share, 2020-2032
Figure 38. China Wall Charger Revenue, (US$, Mn), 2020-2032
Figure 39. Japan Wall Charger Revenue, (US$, Mn), 2020-2032
Figure 40. South Korea Wall Charger Revenue, (US$, Mn), 2020-2032
Figure 41. Southeast Asia Wall Charger Revenue, (US$, Mn), 2020-2032
Figure 42. India Wall Charger Revenue, (US$, Mn), 2020-2032
Figure 43. By Country – South America Wall Charger Revenue Market Share, 2020-2032
Figure 44. By Country – South America Wall Charger Sales, Market Share, 2020-2032
Figure 45. Brazil Wall Charger Revenue, (US$, Mn), 2020-2032
Figure 46. Argentina Wall Charger Revenue, (US$, Mn), 2020-2032
Figure 47. By Country – Middle East & Africa Wall Charger Revenue, Market Share, 2020-2032
Figure 48. By Country – Middle East & Africa Wall Charger Sales, Market Share, 2020-2032
Figure 49. Turkey Wall Charger Revenue, (US$, Mn), 2020-2032
Figure 50. Israel Wall Charger Revenue, (US$, Mn), 2020-2032
Figure 51. Saudi Arabia Wall Charger Revenue, (US$, Mn), 2020-2032
Figure 52. UAE Wall Charger Revenue, (US$, Mn), 2020-2032
Figure 53. Global Wall Charger Production Capacity (M Units), 2020-2032
Figure 54. The Percentage of Production Wall Charger by Region, 2024 VS 2032
Figure 55. Wall Charger Industry Value Chain
Figure 56. Marketing Channels