VGA Cables Market Overview
The VGA cable is a special cable used to connect the VGA interface (D-SUB) of the TV or monitor and the VGA interface (D-SUB) of the graphics card. Most computers and external display devices are connected through an analog VGA interface. The display image information generated digitally inside the computer is converted into R, G, B three primary color signals and line and field signals by the digital/analog converter in the graphics card. Synchronization signal, the signal is transmitted to the display device through the data line.
This report provides a deep insight into the global VGA Cables market covering all its essential aspects. This ranges from a macro overview of the market to micro details of the market size, competitive landscape, development trend, niche market, key market drivers and challenges, SWOT analysis, value chain analysis, etc.
The analysis helps the reader to shape the competition within the industries and strategies for the competitive environment to enhance the potential profit. Furthermore, it provides a simple framework for evaluating and accessing the position of the business organization. The report structure also focuses on the competitive landscape of the Global VGA Cables Market, this report introduces in detail the market share, market performance, product situation, operation situation, etc. of the main players, which helps the readers in the industry to identify the main competitors and deeply understand the competition pattern of the market.
In a word, this report is a must-read for industry players, investors, researchers, consultants, business strategists, and all those who have any kind of stake or are planning to foray into the VGA Cables market in any manner.
VGA Cables Market Analysis:
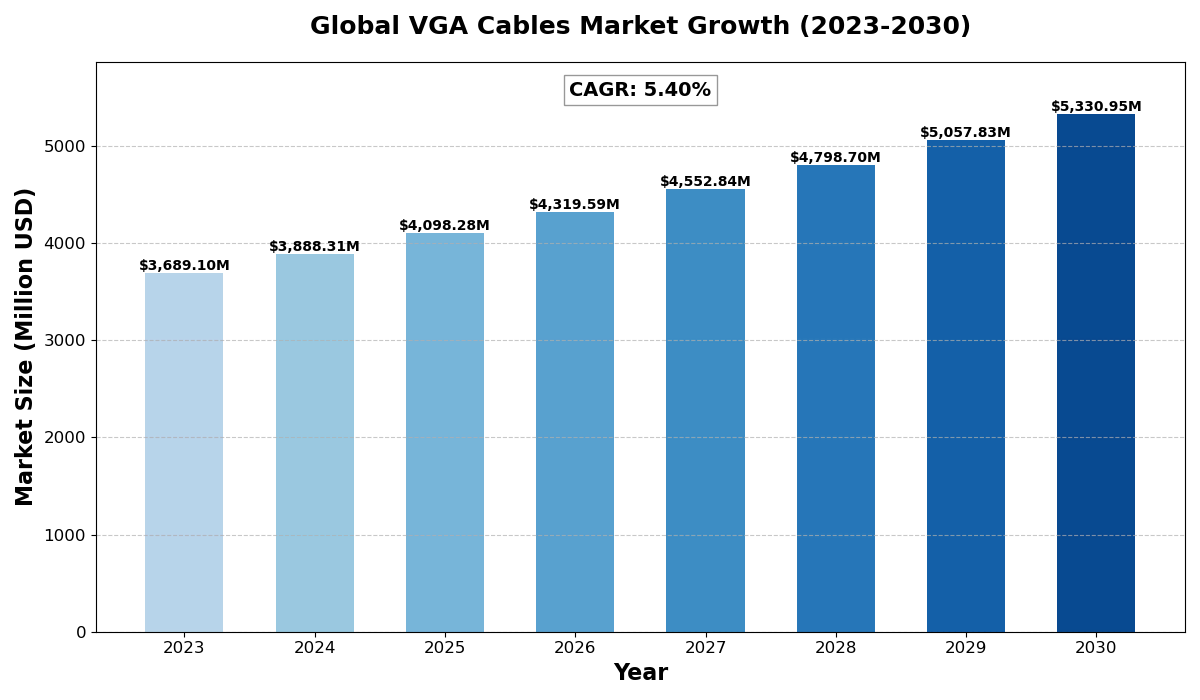
The global VGA Cables Market size was estimated at USD 3689.10 million in 2023 and is projected to reach USD 5330.95 million by 2030, exhibiting a CAGR of 5.40% during the forecast period.
North America VGA Cables market size was USD 961.27 million in 2023, at a CAGR of 4.63% during the forecast period of 2025 through 2030.
VGA Cables Key Market Trends :
-
Growing Demand for High-Resolution Displays
- With the rise of HD and 4K displays, VGA cables are still used for legacy systems, especially in businesses and educational institutions.
-
Shift Towards Digital Interfaces
- HDMI and DisplayPort are replacing VGA in modern devices, but the market remains strong in industrial and automotive sectors.
-
Increase in Industrial and Automotive Applications
- VGA cables are widely used in industrial machinery and automotive infotainment systems, sustaining market demand.
-
Expansion in Emerging Markets
- Developing countries continue to rely on VGA technology due to its cost-effectiveness and compatibility with older systems.
-
Sustainable and High-Quality Cable Production
- Manufacturers are focusing on eco-friendly materials and durable cables to enhance product longevity and reduce e-waste.
VGA Cables Market Regional Analysis :

-
North America:
Strong demand driven by EVs, 5G infrastructure, and renewable energy, with the U.S. leading the market.
-
Europe:
Growth fueled by automotive electrification, renewable energy, and strong regulatory support, with Germany as a key player.
-
Asia-Pacific:
Dominates the market due to large-scale manufacturing in China and Japan, with growing demand from EVs, 5G, and semiconductors.
-
South America:
Emerging market, driven by renewable energy and EV adoption, with Brazil leading growth.
-
Middle East & Africa:
Gradual growth, mainly due to investments in renewable energy and EV infrastructure, with Saudi Arabia and UAE as key contributors.
VGA Cables Market Segmentation :
The research report includes specific segments by region (country), manufacturers, Type, and Application. Market segmentation creates subsets of a market based on product type, end-user or application, Geographic, and other factors. By understanding the market segments, the decision-maker can leverage this targeting in the product, sales, and marketing strategies. Market segments can power your product development cycles by informing how you create product offerings for different segments.
Key Company
- Harbour Industries
- Inc.
- Belden Inc.
- Chatsworth Products
- Inc.
- Tripp Lite
- APC by Schneider Electric
- Copartner Tech Corp.
- DELOCK
- Fleconn Precision Industry (China) Co.
- Limited
- GC Electronics
- IC INTRACOM
- ICE Cable Systems
- JEM Accessories
- Inc.
- Pan-International Wire & Cable (Malaysia) Sdn. Bhd.
- Precision Cable
- Inc.
- Professional Cable
- LLC
- Rexant International
- Ltd.
- Shenzhen Hongke Electronics Co.
- Ltd.
- Softchoice Corporation
- TLD Electronics (HK) Co.
- Ltd.
- TTL Network GmbH
- VERICOM Global Solutions
Market Segmentation (by Type)
- 60HZ
- 70HZ
- 85HZ
Market Segmentation (by Application)
- Electronic Product
- Cars
- Others
Drivers
-
Continued Use in Legacy Systems
- Many organizations and industries still rely on VGA cables for older display systems, driving consistent demand.
-
Growth in Industrial and Automotive Sectors
- VGA cables are widely used in control panels, diagnostic tools, and vehicle infotainment systems.
-
Cost-Effective Display Solutions
- Compared to modern digital alternatives, VGA remains an affordable option for many businesses and consumers.
Restraints
-
Shift to Digital Interfaces
- HDMI, DisplayPort, and USB-C are replacing VGA, reducing its demand in newer devices.
-
Limited Support for High Resolutions
- VGA technology struggles with higher refresh rates and resolutions compared to digital alternatives.
-
Declining PC Market
- The shift towards tablets and mobile devices reduces the need for VGA connections.
Opportunities
-
Emerging Markets and Small Businesses
- Developing nations and budget-conscious businesses still rely on VGA for affordable display connections.
-
Industrial and Automotive Applications
- VGA remains relevant in specialized machinery, control systems, and vehicle displays.
-
Retro and Gaming Communities
- The growing interest in retro gaming and legacy hardware boosts demand for VGA adapters and cables.
Challenges
-
Compatibility Issues with Modern Devices
- Newer laptops and PCs often lack VGA ports, requiring additional adapters for connectivity.
-
Limited Technological Advancements
- Unlike HDMI and DisplayPort, VGA lacks major upgrades, limiting its future growth.
-
Market Saturation and Competition
- With limited innovation, VGA cable manufacturers face intense competition and price pressure.
Key Benefits of This Market Research:
- Industry drivers, restraints, and opportunities covered in the study
- Neutral perspective on the market performance
- Recent industry trends and developments
- Competitive landscape & strategies of key players
- Potential & niche segments and regions exhibiting promising growth covered
- Historical, current, and projected market size, in terms of value
- In-depth analysis of the VGA Cables Market
- Overview of the regional outlook of the VGA Cables Market:
Key Reasons to Buy this Report:
- Access to date statistics compiled by our researchers. These provide you with historical and forecast data, which is analyzed to tell you why your market is set to change
- This enables you to anticipate market changes to remain ahead of your competitors
- You will be able to copy data from the Excel spreadsheet straight into your marketing plans, business presentations, or other strategic documents
- The concise analysis, clear graph, and table format will enable you to pinpoint the information you require quickly
- Provision of market value (USD Billion) data for each segment and sub-segment
- Indicates the region and segment that is expected to witness the fastest growth as well as to dominate the market
- Provides insight into the market through Value Chain
- Market dynamics scenario, along with growth opportunities of the market in the years to come
- 6-month post-sales analyst support
Customization of the Report
In case of any queries or customization requirements, please connect with our sales team, who will ensure that your requirements are met.
FAQs
Q: What are the key driving factors and opportunities in the VGA Cables market?
A: The continued use of VGA in legacy systems, industrial applications, and cost-effective display solutions are key drivers. Opportunities exist in emerging markets, automotive applications, and retro gaming.
Q: Which region is projected to have the largest market share?
A: Asia-Pacific is expected to dominate the market due to high industrial demand and widespread use in developing nations.
Q: Who are the top players in the global VGA Cables market?
A: Leading companies include Harbour Industries, Belden Inc., Tripp Lite, APC by Schneider Electric, and Copartner Tech Corp.
Q: What are the latest technological advancements in the industry?
A: Manufacturers are focusing on durable, eco-friendly materials and improved shielding to enhance VGA cable longevity and performance.
Q: What is the current size of the global VGA Cables market?
A: The market was valued at USD 3,689.10 million in 2023 and is projected to reach USD 5,330.95 million by 2030, growing at a CAGR of 5.40%.

Get Sample Report PDF for Exclusive Insights
Report Sample Includes
- Table of Contents
- List of Tables & Figures
- Charts, Research Methodology, and more...