SEMICONDUCTOR INSIGHT
MARKET RESEARCH REPORT

USBL Acoustic Transponder Market

2026 to 2034
MARKET INTELLIGENCE
ACROSS KEY REGIONS
2026 EDITION
SENSORS Semiconductor Market Research

USBL Acoustic Transponder Market

Size, Share & Industry Analysis, By Type (Shallow-Water Transponders, Deep-Water Transponders, Responder / Telemetry-Enabled Transponders), By Application (ROV/AUV Tracking, Dynamic Positioning Reference, Offshore Construction & Survey, Defense & Research, Others), By Depth Rating (Below 1,000 m, 1,000–4,000 m, 4,000–7,000 m), By Operating Mode (Transponder, Responder, Combined Positioning + Telemetry), and Regional Forecast, 2026-2034

◷
UPDATED 13 October 2026
▤
REPORT LENGTH Detailed Report
▣
REPORT CODE 3c65ca09c499
▯
FORMATS PDF

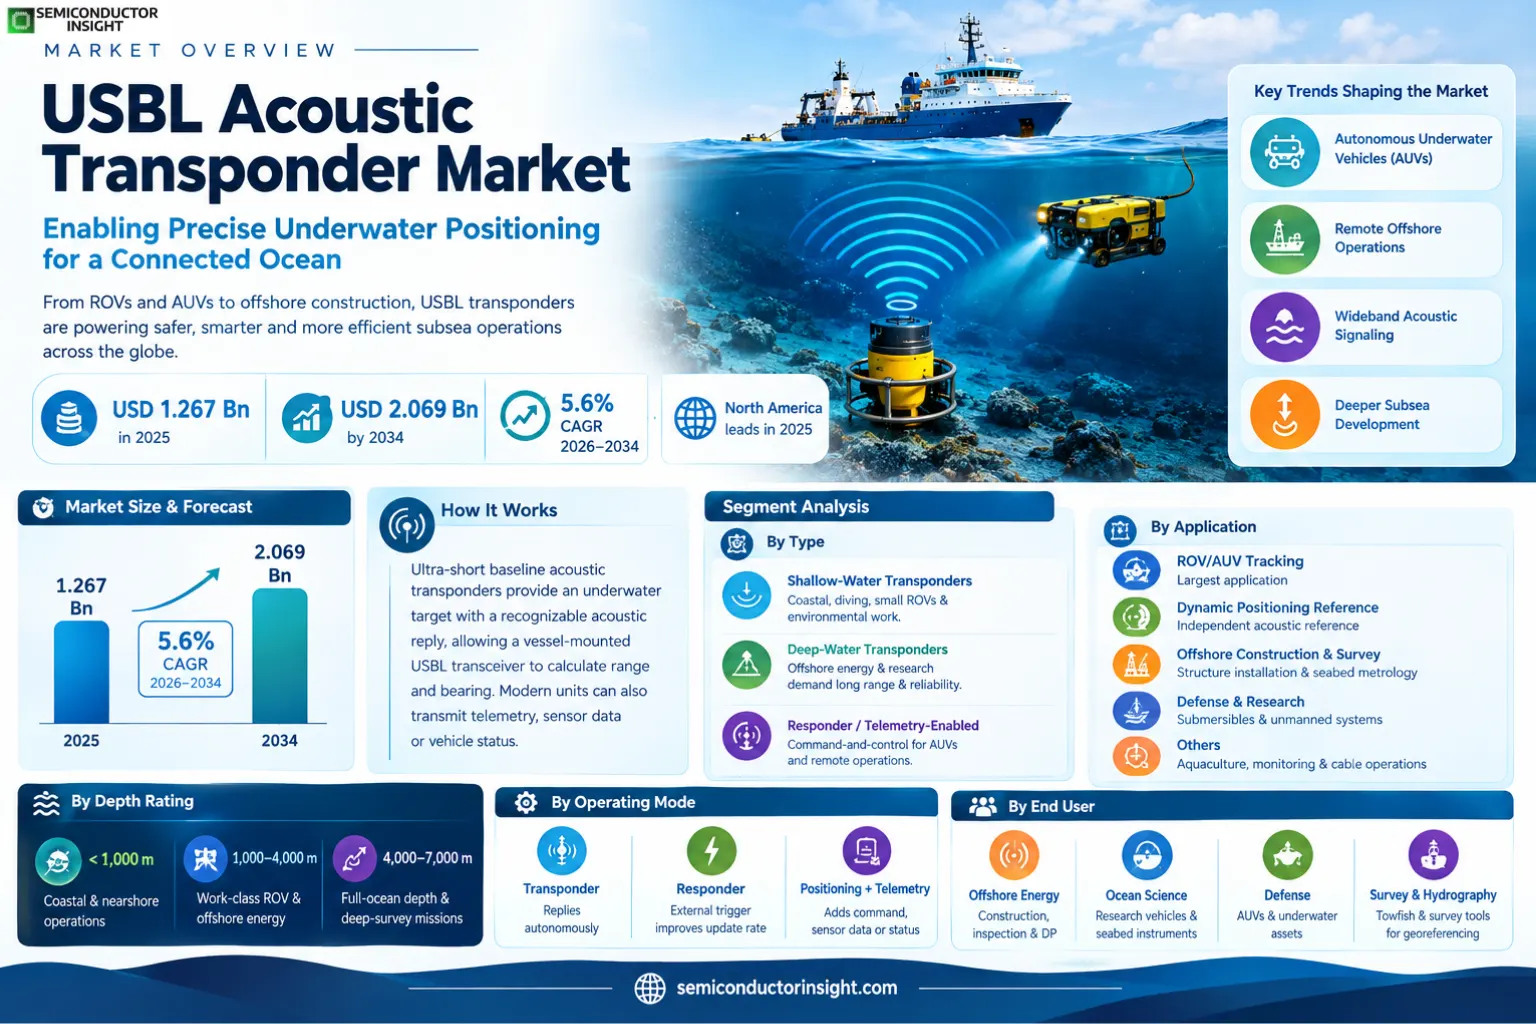
The USBL acoustic transponder market was valued at USD 1.267 billion in 2025 and is projected to reach USD 2.069 billion by 2034, expanding at a 5.6% CAGR over 2026–2034. North America leads in 2025, while the market is being reshaped by autonomous underwater vehicles, remote offshore operations, wideband acoustic signaling and deeper subsea development..

Get the sample PDF with study scope, segmentation and methodology details.

Key Statistics

2025 Market Size
USD 1.267 billion
2034 Projected Market Size
USD 2.069 billion
CAGR (2026–2034)
5.6%
Largest Market in 2025
North America

Key Takeaways

  • Market size and growth: the market is valued at USD 1.267 billion in 2025 and is projected to reach USD 2.069 billion by 2034, with a 5.6% CAGR over 2026–2034.
  • Deep-Water Transponders leads by type because offshore construction, subsea robotics and scientific operations increasingly require reliable tracking at kilometer-scale depth.
  • ROV/AUV Tracking is the leading application because mobile subsea vehicles require continuous range and bearing updates for navigation, intervention and asset recovery.
  • North America leads regionally, while Asia Pacific offers the strongest incremental growth.
  • Primary driver: ROV, AUV, offshore construction and remote subsea operations require reliable underwater positioning where GNSS is unavailable
  • Principal restraint: acoustic multipath, vessel noise, calibration and high deep-water equipment cost can complicate deployment

Market Overview

The USBL acoustic transponder market was valued at USD 1.267 billion in 2025 and is projected to reach USD 2.069 billion by 2034, expanding at a 5.6% CAGR over 2026–2034. North America leads in 2025, while the market is being reshaped by autonomous underwater vehicles, remote offshore operations, wideband acoustic signaling and deeper subsea development..

Base year: 2025 · Estimated year: 2026 · Forecast period: 2026–2034 · Values in USD

Ultra-short baseline acoustic transponders provide underwater targets with a recognizable acoustic reply so a vessel-mounted USBL transceiver can calculate range and bearing. Modern transponders may also transmit telemetry, sensor data or vehicle status. The technology is widely used with ROVs, AUVs, towfish, seabed structures and dynamic-positioning systems because radio and satellite navigation signals do not propagate effectively underwater.

Sonardyne’s current portfolio demonstrates the range of deployment needs. The WSM 6+ is designed for mobile targets such as ROVs and towfish, Marker 6 can identify assets to 7,000 m depth, and DPT 6 serves as a dynamic-positioning reference using Wideband 2 signaling. The Ranger 2 family can track assets, command AUVs and collect data from seabed sensors, illustrating the convergence of positioning and acoustic communications.

Kongsberg’s cNODE MiniS supports more than 500 digital acoustic channels and is offered with 4,000 m and 7,000 m housings, while Teledyne Benthos combines USBL positioning with acoustic modem functionality. These designs show that product value increasingly depends on acoustic robustness, depth rating, battery life, multi-user operation and telemetry capability rather than simple ping-and-reply functionality.

Segment Analysis: By Type

By type, the market is segmented into Shallow-Water Transponders, Deep-Water Transponders, Responder / Telemetry-Enabled Transponders. Deep-Water Transponders holds the leading position based on current performance requirements and deployment economics.

Type Function / role Market position
Shallow-Water Transponders Compact units for coastal survey, diving, small ROV and environmental work. Value-oriented segment with emphasis on portability and fast deployment.
Deep-Water Transponders Pressure-rated units for deep ocean operations and subsea infrastructure. Leading value segment because offshore energy and research demand long range and high reliability.
Responder / Telemetry-Enabled Transponders Combine positioning replies with external trigger or data communication. Growing rapidly as AUV and remote operations require command-and-control functions.

Commercial implications by type

Depth rating is only one differentiator. Acoustic protocol, source level, receive sensitivity, channel count, tilt sensing, telemetry and power consumption determine operational performance. Wideband digital signaling has improved multipath rejection and reduced interference, which is important when several vessels or subsea assets operate simultaneously around offshore construction sites.

Segment Analysis: By Application

By application, demand is segmented into ROV/AUV Tracking, Dynamic Positioning Reference, Offshore Construction & Survey, Defense & Research, Others. ROV/AUV Tracking is the leading application because it directly links the technology to measurable bandwidth, positioning, power, disinfection or system-efficiency benefits.

Application Demand characteristics
ROV/AUV Tracking Largest application; vehicles must be tracked during inspection, survey and intervention missions.
Dynamic Positioning Reference Seabed transponders provide an independent acoustic reference for DP vessels.
Offshore Construction & Survey USBL supports structure installation, towfish tracking and seabed metrology.
Defense & Research Submersibles, research instruments and unmanned systems use acoustic positioning where GNSS is unavailable.
Others Aquaculture, recovery, environmental monitoring and cable operations add niche demand.

By Depth Rating

Depth Rating Commercial relevance
Below 1,000 m Coastal and nearshore operations favor compact low-cost units.
1,000–4,000 m Work-class ROV and offshore-energy operations form a large technical segment.
4,000–7,000 m Full-ocean-depth and deep-survey missions require premium housings and power budgets.

By Operating Mode

Operating Mode Commercial relevance
Transponder Acoustically interrogated device replies autonomously.
Responder External electrical trigger improves update rate in noisy vehicle environments.
Combined Positioning + Telemetry Adds command, sensor data or status communication.

By End User

End User Commercial relevance
Offshore Energy Construction, inspection and DP create high-value recurring demand.
Ocean Science Research vehicles and seabed instruments require reliable positioning.
Defense AUVs and underwater assets use robust acoustic navigation.
Survey & Hydrography Towfish and survey tools require precise georeferencing.

USBL Acoustic Transponder Market Size & Share

Regional Analysis

North America leads the market because North America has a large offshore-energy, defense, ocean-science and subsea-robotics installed base, with strong demand from the Gulf of Mexico and advanced marine technology programs. Asia Pacific has the strongest growth profile as demand expands through offshore wind, subsea infrastructure and marine robotics expansion across China, Japan, South Korea and Southeast Asia.

How does regional demand differ across this market?

North America leads high-value demand, Europe has a large North Sea offshore and subsea-technology ecosystem, and Asia Pacific offers the strongest growth through offshore wind, marine robotics and regional shipbuilding. South America is supported by Brazilian offshore energy, while the Middle East & Africa are project-driven through oil and gas, survey and port infrastructure.

Region Position Growth outlook Demand profile Supplier selection
North America Largest Strong Offshore, defense and science Accuracy, reliability, service
Europe Second Strong North Sea subsea operations Reliability, multi-user performance
Asia Pacific Third Fastest Offshore wind and robotics Depth rating, cost, local support
South America Smaller Moderate Offshore energy Ruggedness and support
Middle East & Africa Emerging Moderate Oil, gas and ports Service, ruggedness, availability
North America LARGEST

Why does North America lead?

The United States and Canada combine offshore energy, naval research, ocean science and a large base of ROV/AUV operators. High vessel-day costs make reliable tracking economically valuable because positioning failures can delay expensive subsea operations.

Market positionLargest
Growth outlookStrong
Demand profileOffshore, defense and science
Selection factorAccuracy, reliability, service
Country Position in region Demand rationale
United States Regional leader Gulf offshore work, defense and research create broad demand.
Canada Ocean technology Atlantic offshore and marine research support specialist use.
Mexico Offshore-linked Gulf energy projects create selected transponder demand.
  • Subsea robotics are increasing the number of tracked assets.
  • DP reference transponders protect against GNSS dependency.
  • High service availability is important for vessel operators.
Europe TECHNOLOGY HUB

How is Europe positioned?

The United Kingdom and Norway host leading acoustic-positioning suppliers and a mature subsea-services industry. Offshore energy, wind and research sustain demand for high-specification equipment.

Market positionSecond
Growth outlookStrong
Demand profileNorth Sea subsea operations
Selection factorReliability, multi-user performance
Country Position in region Demand rationale
United Kingdom Technology leader Sonardyne and subsea service companies anchor the ecosystem.
Norway Offshore leader Deep expertise in DP, ROV and offshore construction drives use.
France Research and defense Marine science and naval applications create high-value demand.
  • Wideband signaling reduces interference in congested offshore work.
  • Offshore wind adds construction and inspection missions.
  • Long equipment lifecycles favor backward-compatible protocols.
Asia Pacific FASTEST-GROWING

Why is Asia Pacific expanding fastest?

China, Japan, South Korea and Southeast Asia are expanding offshore wind, subsea infrastructure, autonomous marine systems and research fleets. Regional shipbuilding and electronics capability also supports local integration.

Market positionThird
Growth outlookFastest
Demand profileOffshore wind and robotics
Selection factorDepth rating, cost, local support
Country Position in region Demand rationale
China Largest growth market Offshore energy and marine robotics create rising demand.
Japan Research and industrial Deep-sea science and subsea technology support high-end systems.
South Korea Shipbuilding and offshore Marine engineering creates strong positioning requirements.
  • AUV use is expanding in survey and inspection.
  • Deep-water construction raises transponder specifications.
  • Regional integrators increasingly support local service.
South America OFFSHORE-LED

What drives South American demand?

Brazil’s deepwater oil and gas industry is the region’s largest demand source. Survey, ROV and installation work require dependable acoustic tracking, while other countries contribute smaller hydrographic and research markets.

Market positionSmaller
Growth outlookModerate
Demand profileOffshore energy
Selection factorRuggedness and support
Country Position in region Demand rationale
Brazil Regional leader Deepwater offshore production drives the strongest demand.
Guyana High-growth niche Rapid offshore development creates project demand.
Chile Research and survey Long coastline supports hydrographic applications.
  • Deepwater assets favor long-range transponders.
  • Vessel-day economics reward reliable systems.
  • Local service capacity influences procurement.
Middle East & Africa PROJECT-LED

Where are opportunities in Middle East & Africa?

Gulf offshore energy and African survey projects create targeted demand. Most high-end systems are imported, making local field support and rental fleets important.

Market positionEmerging
Growth outlookModerate
Demand profileOil, gas and ports
Selection factorService, ruggedness, availability
Country Position in region Demand rationale
UAE Offshore hub Marine contractors and energy projects support demand.
Saudi Arabia Large project market Offshore development and port infrastructure create opportunities.
South Africa Marine services Survey and ocean research create regional demand.
  • Rental fleets can improve utilization.
  • Warm-water conditions affect battery and acoustic planning.
  • Integration with vessel DP systems raises value.

Competitive Landscape

The market is led by specialized marine-technology suppliers with proprietary acoustic protocols, pressure-housing expertise and global offshore service networks.

Sonardyne, Kongsberg and Teledyne Marine compete on acoustic signal processing, depth rating, telemetry and systems integration. Their advantage extends beyond the transponder because topside transceivers, software and compatibility determine full-system performance.

Sonardyne’s Wideband 2 and Wideband 3 platforms emphasize multipath rejection, multi-user operation and diagnostics. Kongsberg’s cNODE MiniS offers more than 500 acoustic channels and full LBL capability. Teledyne combines broadband positioning and modem functionality within its Benthos architecture.

Service and installed-base compatibility are powerful competitive barriers. Offshore contractors often reuse transponders across projects and expect them to work with existing vessel systems, so backward compatibility and global rental or repair support can outweigh small differences in hardware price.

Competitive tier Representative participants Competitive focus
Global acoustic-positioning leaders Sonardyne, Kongsberg Maritime, Teledyne Marine USBL/LBL systems, transponders and telemetry
Marine navigation specialists iXblue/Exail, EvoLogics Integrated subsea navigation and acoustic communications
Regional / application specialists Applied Acoustics, Blueprint Subsea and others Survey, compact ROV and niche positioning

Companies Profiled

Sonardyne, Kongsberg Maritime, Teledyne Marine, Exail, EvoLogics, Applied Acoustics, Blueprint Subsea

Production Capacity Analysis

Production combines piezoelectric transducers, pressure housings, batteries, analog front ends, digital signal processing and waterproof connectors, followed by acoustic calibration and pressure testing.

High-specification transponders are low-volume engineered products rather than commodity electronics. Machining and certifying 4,000–7,000 m pressure housings, assembling acoustic transducers and validating seals can limit throughput more than circuit-board fabrication.

Acoustic calibration also matters. Source level, receive sensitivity, timing accuracy and beam characteristics must be verified so a transponder delivers predictable range and positioning performance. Suppliers with dedicated pressure and acoustic test facilities can shorten qualification cycles.

Market Dynamics

The market is shifting from simple positioning beacons toward multifunctional underwater communication and navigation nodes.

A modern transponder may provide positioning, telemetry, attitude sensing, data logging and release control from the same hardware platform. This increases value per unit and supports autonomous operations, but it also raises software and battery requirements. Fleet compatibility and protocol standardization remain central to customer adoption.

Market Drivers

Drivers Impact Analysis

Driver Impact Commercial mechanism
AUV and ROV growth High More underwater robots require continuous acoustic tracking and command links.
Offshore construction High Subsea installation and survey need precise georeferencing.
Dynamic positioning Medium Acoustic references provide independent position data for DP vessels.
Ocean science Medium Research instruments and vehicles operate beyond GNSS reach.

AUV and ROV growth

More underwater robots require continuous acoustic tracking and command links.

Offshore construction

Subsea installation and survey need precise georeferencing.

Dynamic positioning

Acoustic references provide independent position data for DP vessels.

Ocean science

Research instruments and vehicles operate beyond GNSS reach.

Market Restraints

Restraints Impact Analysis

Restraint Impact Commercial mechanism
Acoustic interference High Noise and multipath can degrade ranging in complex environments.
Deep-water cost High Pressure housings and long-range acoustics raise unit cost.
Calibration requirements Medium Poor topside alignment can introduce systematic position error.
Battery logistics Medium Long deployments require careful energy management and servicing.

Acoustic interference

Noise and multipath can degrade ranging in complex environments.

Deep-water cost

Pressure housings and long-range acoustics raise unit cost.

Calibration requirements

Poor topside alignment can introduce systematic position error.

Battery logistics

Long deployments require careful energy management and servicing.

Market Opportunities

Autonomous subsea fleets

Multi-user acoustic protocols can track and command several AUVs from one platform.

Offshore wind

Construction and inspection add new positioning demand beyond oil and gas.

Integrated telemetry

Combining data communication with tracking can remove separate acoustic modems.

Calibration-free portable USBL

Faster deployment expands use among smaller survey operators.

Supply Chain Analysis

Acoustic components
Piezoelectric elements, hydrophones, analog front ends
Pressure hardware
Titanium/bronze housings, connectors, batteries
Signal processing
DSP, timing, protocols and firmware
System integration
USBL topside, DP, ROV/AUV and survey software

Acoustic components

Transducer design determines bandwidth, source level and sensitivity.

Pressure hardware

Housing depth rating and seal reliability are essential for subsea service.

Signal processing

Wideband coding and filtering improve multipath rejection and update reliability.

System integration

The transponder must interoperate with topside USBL, navigation sensors and vessel software.

Recent Developments

Current — Sonardyne Compatt 6+ adds Wideband 3 support

The platform supports high-precision LBL and USBL work with thousands of configurations and depth ratings to 7,000 m. Source

Current — Kongsberg cNODE MiniS supports deep-water USBL/LBL operations

The transponder supports more than 500 Cymbal channels and 4,000 m or 7,000 m housings. Source

Current — Teledyne Benthos combines USBL and acoustic modem functions

The DAT architecture supports range, bearing and underwater data communication. Source

Report Scope & Segmentation

Attribute Coverage
Market USBL Acoustic Transponder
Base Year 2025
Estimated Year 2026
Forecast Period 2026–2034
2025 Market Size USD 1.267 billion
2026 Estimated Size USD 1.338 billion
2034 Forecast Size USD 2.069 billion
CAGR 5.6% (2026–2034)
By Type Shallow-Water Transponders, Deep-Water Transponders, Responder / Telemetry-Enabled Transponders
By Application ROV/AUV Tracking, Dynamic Positioning Reference, Offshore Construction & Survey, Defense & Research, Others
By Depth Rating Below 1,000 m, 1,000–4,000 m, 4,000–7,000 m
By Operating Mode Transponder, Responder, Combined Positioning + Telemetry
By End User Offshore Energy, Ocean Science, Defense, Survey & Hydrography
Regions North America, Europe, Asia Pacific, South America, Middle East & Africa
Companies Profiled Sonardyne, Kongsberg Maritime, Teledyne Marine, Exail, EvoLogics, Applied Acoustics, Blueprint Subsea

Frequently Asked Questions

What is the USBL acoustic transponder market size in 2025?

The market is valued at USD 1.267 billion in 2025.

What is the projected market size by 2034?

The market is projected to reach USD 2.069 billion by 2034.

What is the CAGR from 2026 to 2034?

The market is expected to expand at a 5.6% CAGR.

Which region leads the market?

North America is the largest regional market in 2025.

Which type leads the market?

Deep-Water Transponders is the leading type.

Which application leads demand?

ROV/AUV Tracking is the leading application.

What is the main growth driver?

ROV, AUV, offshore construction and remote subsea operations require reliable underwater positioning where GNSS is unavailable.

What is the principal restraint?

acoustic multipath, vessel noise, calibration and high deep-water equipment cost can complicate deployment.

Where are the strongest opportunities?

autonomous vehicle telemetry, offshore wind, calibration-free USBL and multi-user wideband transponders.

Which companies are active in the market?

Sonardyne, Kongsberg Maritime, Teledyne Marine, Exail, EvoLogics, Applied Acoustics, Blueprint Subsea.

Research Sources & Evidence Base

View primary and official evidence used in this overview
  1. Sonardyne: Ranger 2 USBL Family — USBL positioning, telemetry and AUV/ROV applications.
  2. Sonardyne: DPT 6 — Dynamic-positioning reference transponder and 7,000 m depth capability.
  3. Sonardyne: WSM 6+ — Mobile ROV, towfish and submersible tracking.
  4. Sonardyne: Marker 6 — Compact target-marking transponder for depths to 7,000 m.
  5. Kongsberg Maritime: cNODE MiniS — USBL/LBL transponder channels, telemetry and depth ratings.
  6. Teledyne Marine: Benthos Positioning Products — USBL positioning and acoustic communications architecture.

USBL Acoustic Transponder Market Size, Share & Industry Analysis, By Type (Shallow-Water Transponders, Deep-Water Transponders, Responder / Telemetry-Enabled Transponders), By Application (ROV/AUV Tracking, Dynamic Positioning Reference, Offshore Construction & Survey, Defense & Research, Others), By Depth Rating (Below 1,000 m, 1,000–4,000 m, 4,000–7,000 m), By Operating Mode (Transponder, Responder, Combined Positioning + Telemetry), and Regional Forecast, 2026-2034

Get Sample Report PDF for Exclusive Insights

Report Sample Includes

  • Table of Contents
  • List of Tables & Figures
  • Charts, Research Methodology, and more...

PDF Icon Download Sample Report PDF

Download Sample Report

Table of Content

Table of Contents
1 Research Methodology and Statistical Scope
1.1 Market Definition and Statistical Scope of USBL Acoustic Transponder
1.2 Key Market Segments
1.2.1 USBL Acoustic Transponder Segment by Type
1.2.2 USBL Acoustic Transponder Segment by Application
1.3 Methodology & Sources of Information
1.3.1 Research Methodology
1.3.2 Research Process
1.3.3 Market Breakdown and Data Triangulation
1.3.4 Base Year
1.3.5 Report Assumptions & Caveats
2 USBL Acoustic Transponder Market Overview
2.1 Global Market Overview
2.1.1 Global USBL Acoustic Transponder Market Size (M USD) Estimates and Forecasts (2026-2034)
2.1.2 Global USBL Acoustic Transponder Sales Estimates and Forecasts (2026-2034)
2.2 Market Segment Executive Summary
2.3 Global Market Size by Region
3 USBL Acoustic Transponder Market Competitive Landscape
3.1 Global USBL Acoustic Transponder Sales by Manufacturers (2019-2025)
3.2 Global USBL Acoustic Transponder Revenue Market Share by Manufacturers (2019-2025)
3.3 USBL Acoustic Transponder Market Share by Company Type (Tier 1, Tier 2, and Tier 3)
3.4 Global USBL Acoustic Transponder Average Price by Manufacturers (2019-2025)
3.5 Manufacturers USBL Acoustic Transponder Sales Sites, Area Served, Product Type
3.6 USBL Acoustic Transponder Market Competitive Situation and Trends
3.6.1 USBL Acoustic Transponder Market Concentration Rate
3.6.2 Global 5 and 10 Largest USBL Acoustic Transponder Players Market Share by Revenue
3.6.3 Mergers & Acquisitions, Expansion
4 USBL Acoustic Transponder Industry Chain Analysis
4.1 USBL Acoustic Transponder Industry Chain Analysis
4.2 Market Overview of Key Raw Materials
4.3 Midstream Market Analysis
4.4 Downstream Customer Analysis
5 The Development and Dynamics of USBL Acoustic Transponder Market
5.1 Key Development Trends
5.2 Driving Factors
5.3 Market Challenges
5.4 Market Restraints
5.5 Industry News
5.5.1 New Product Developments
5.5.2 Mergers & Acquisitions
5.5.3 Expansions
5.5.4 Collaboration/Supply Contracts
5.6 Industry Policies
6 USBL Acoustic Transponder Market Segmentation by Type
6.1 Evaluation Matrix of Segment Market Development Potential (Type)
6.2 Global USBL Acoustic Transponder Sales Market Share by Type (2019-2025)
6.3 Global USBL Acoustic Transponder Market Size Market Share by Type (2019-2025)
6.4 Global USBL Acoustic Transponder Price by Type (2019-2025)
7 USBL Acoustic Transponder Market Segmentation by Application
7.1 Evaluation Matrix of Segment Market Development Potential (Application)
7.2 Global USBL Acoustic Transponder Market Sales by Application (2019-2025)
7.3 Global USBL Acoustic Transponder Market Size (M USD) by Application (2019-2025)
7.4 Global USBL Acoustic Transponder Sales Growth Rate by Application (2019-2025)
8 USBL Acoustic Transponder Market Segmentation by Region
8.1 Global USBL Acoustic Transponder Sales by Region
8.1.1 Global USBL Acoustic Transponder Sales by Region
8.1.2 Global USBL Acoustic Transponder Sales Market Share by Region
8.2 North America
8.2.1 North America USBL Acoustic Transponder Sales by Country
8.2.2 U.S.
8.2.3 Canada
8.2.4 Mexico
8.3 Europe
8.3.1 Europe USBL Acoustic Transponder Sales by Country
8.3.2 Germany
8.3.3 France
8.3.4 U.K.
8.3.5 Italy
8.3.6 Russia
8.4 Asia Pacific
8.4.1 Asia Pacific USBL Acoustic Transponder Sales by Region
8.4.2 China
8.4.3 Japan
8.4.4 South Korea
8.4.5 India
8.4.6 Southeast Asia
8.5 South America
8.5.1 South America USBL Acoustic Transponder Sales by Country
8.5.2 Brazil
8.5.3 Argentina
8.5.4 Columbia
8.6 Middle East and Africa
8.6.1 Middle East and Africa USBL Acoustic Transponder Sales by Region
8.6.2 Saudi Arabia
8.6.3 UAE
8.6.4 Egypt
8.6.5 Nigeria
8.6.6 South Africa
9 Key Companies Profile
9.1 Applied Acoustics
9.1.1 Applied Acoustics USBL Acoustic Transponder Basic Information
9.1.2 Applied Acoustics USBL Acoustic Transponder Product Overview
9.1.3 Applied Acoustics USBL Acoustic Transponder Product Market Performance
9.1.4 Applied Acoustics Business Overview
9.1.5 Applied Acoustics USBL Acoustic Transponder SWOT Analysis
9.1.6 Applied Acoustics Recent Developments
9.2 iXblue
9.2.1 iXblue USBL Acoustic Transponder Basic Information
9.2.2 iXblue USBL Acoustic Transponder Product Overview
9.2.3 iXblue USBL Acoustic Transponder Product Market Performance
9.2.4 iXblue Business Overview
9.2.5 iXblue USBL Acoustic Transponder SWOT Analysis
9.2.6 iXblue Recent Developments
9.3 Sonardyne
9.3.1 Sonardyne USBL Acoustic Transponder Basic Information
9.3.2 Sonardyne USBL Acoustic Transponder Product Overview
9.3.3 Sonardyne USBL Acoustic Transponder Product Market Performance
9.3.4 Sonardyne USBL Acoustic Transponder SWOT Analysis
9.3.5 Sonardyne Business Overview
9.3.6 Sonardyne Recent Developments
9.4 Kongsberg
9.4.1 Kongsberg USBL Acoustic Transponder Basic Information
9.4.2 Kongsberg USBL Acoustic Transponder Product Overview
9.4.3 Kongsberg USBL Acoustic Transponder Product Market Performance
9.4.4 Kongsberg Business Overview
9.4.5 Kongsberg Recent Developments
9.5 Seatronics
9.5.1 Seatronics USBL Acoustic Transponder Basic Information
9.5.2 Seatronics USBL Acoustic Transponder Product Overview
9.5.3 Seatronics USBL Acoustic Transponder Product Market Performance
9.5.4 Seatronics Business Overview
9.5.5 Seatronics Recent Developments
9.6 Unique Group
9.6.1 Unique Group USBL Acoustic Transponder Basic Information
9.6.2 Unique Group USBL Acoustic Transponder Product Overview
9.6.3 Unique Group USBL Acoustic Transponder Product Market Performance
9.6.4 Unique Group Business Overview
9.6.5 Unique Group Recent Developments
9.7 Subsea Technologies
9.7.1 Subsea Technologies USBL Acoustic Transponder Basic Information
9.7.2 Subsea Technologies USBL Acoustic Transponder Product Overview
9.7.3 Subsea Technologies USBL Acoustic Transponder Product Market Performance
9.7.4 Subsea Technologies Business Overview
9.7.5 Subsea Technologies Recent Developments
9.8 EvoLogics GmbH
9.8.1 EvoLogics GmbH USBL Acoustic Transponder Basic Information
9.8.2 EvoLogics GmbH USBL Acoustic Transponder Product Overview
9.8.3 EvoLogics GmbH USBL Acoustic Transponder Product Market Performance
9.8.4 EvoLogics GmbH Business Overview
9.8.5 EvoLogics GmbH Recent Developments
9.9 Boxfish Robotics
9.9.1 Boxfish Robotics USBL Acoustic Transponder Basic Information
9.9.2 Boxfish Robotics USBL Acoustic Transponder Product Overview
9.9.3 Boxfish Robotics USBL Acoustic Transponder Product Market Performance
9.9.4 Boxfish Robotics Business Overview
9.9.5 Boxfish Robotics Recent Developments
10 USBL Acoustic Transponder Market Forecast by Region
10.1 Global USBL Acoustic Transponder Market Size Forecast
10.2 Global USBL Acoustic Transponder Market Forecast by Region
10.2.1 North America Market Size Forecast by Country
10.2.2 Europe USBL Acoustic Transponder Market Size Forecast by Country
10.2.3 Asia Pacific USBL Acoustic Transponder Market Size Forecast by Region
10.2.4 South America USBL Acoustic Transponder Market Size Forecast by Country
10.2.5 Middle East and Africa Forecasted Consumption of USBL Acoustic Transponder by Country
11 Forecast Market by Type and by Application (2025-2030)
11.1 Global USBL Acoustic Transponder Market Forecast by Type (2025-2030)
11.1.1 Global Forecasted Sales of USBL Acoustic Transponder by Type (2025-2030)
11.1.2 Global USBL Acoustic Transponder Market Size Forecast by Type (2025-2030)
11.1.3 Global Forecasted Price of USBL Acoustic Transponder by Type (2025-2030)
11.2 Global USBL Acoustic Transponder Market Forecast by Application (2025-2030)
11.2.1 Global USBL Acoustic Transponder Sales (K Units) Forecast by Application
11.2.2 Global USBL Acoustic Transponder Market Size (M USD) Forecast by Application (2025-2030)
12 Conclusion and Key FindingsList of Tables
Table 1. Introduction of the Type
Table 2. Introduction of the Application
Table 3. Market Size (M USD) Segment Executive Summary
Table 4. USBL Acoustic Transponder Market Size Comparison by Region (M USD)
Table 5. Global USBL Acoustic Transponder Sales (K Units) by Manufacturers (2019-2025)
Table 6. Global USBL Acoustic Transponder Sales Market Share by Manufacturers (2019-2025)
Table 7. Global USBL Acoustic Transponder Revenue (M USD) by Manufacturers (2019-2025)
Table 8. Global USBL Acoustic Transponder Revenue Share by Manufacturers (2019-2025)
Table 9. Company Type (Tier 1, Tier 2, and Tier 3) & (based on the Revenue in USBL Acoustic Transponder as of 2022)
Table 10. Global Market USBL Acoustic Transponder Average Price (USD/Unit) of Key Manufacturers (2019-2025)
Table 11. Manufacturers USBL Acoustic Transponder Sales Sites and Area Served
Table 12. Manufacturers USBL Acoustic Transponder Product Type
Table 13. Global USBL Acoustic Transponder Manufacturers Market Concentration Ratio (CR5 and HHI)
Table 14. Mergers & Acquisitions, Expansion Plans
Table 15. Industry Chain Map of USBL Acoustic Transponder
Table 16. Market Overview of Key Raw Materials
Table 17. Midstream Market Analysis
Table 18. Downstream Customer Analysis
Table 19. Key Development Trends
Table 20. Driving Factors
Table 21. USBL Acoustic Transponder Market Challenges
Table 22. Global USBL Acoustic Transponder Sales by Type (K Units)
Table 23. Global USBL Acoustic Transponder Market Size by Type (M USD)
Table 24. Global USBL Acoustic Transponder Sales (K Units) by Type (2019-2025)
Table 25. Global USBL Acoustic Transponder Sales Market Share by Type (2019-2025)
Table 26. Global USBL Acoustic Transponder Market Size (M USD) by Type (2019-2025)
Table 27. Global USBL Acoustic Transponder Market Size Share by Type (2019-2025)
Table 28. Global USBL Acoustic Transponder Price (USD/Unit) by Type (2019-2025)
Table 29. Global USBL Acoustic Transponder Sales (K Units) by Application
Table 30. Global USBL Acoustic Transponder Market Size by Application
Table 31. Global USBL Acoustic Transponder Sales by Application (2019-2025) & (K Units)
Table 32. Global USBL Acoustic Transponder Sales Market Share by Application (2019-2025)
Table 33. Global USBL Acoustic Transponder Sales by Application (2019-2025) & (M USD)
Table 34. Global USBL Acoustic Transponder Market Share by Application (2019-2025)
Table 35. Global USBL Acoustic Transponder Sales Growth Rate by Application (2019-2025)
Table 36. Global USBL Acoustic Transponder Sales by Region (2019-2025) & (K Units)
Table 37. Global USBL Acoustic Transponder Sales Market Share by Region (2019-2025)
Table 38. North America USBL Acoustic Transponder Sales by Country (2019-2025) & (K Units)
Table 39. Europe USBL Acoustic Transponder Sales by Country (2019-2025) & (K Units)
Table 40. Asia Pacific USBL Acoustic Transponder Sales by Region (2019-2025) & (K Units)
Table 41. South America USBL Acoustic Transponder Sales by Country (2019-2025) & (K Units)
Table 42. Middle East and Africa USBL Acoustic Transponder Sales by Region (2019-2025) & (K Units)
Table 43. Applied Acoustics USBL Acoustic Transponder Basic Information
Table 44. Applied Acoustics USBL Acoustic Transponder Product Overview
Table 45. Applied Acoustics USBL Acoustic Transponder Sales (K Units), Revenue (M USD), Price (USD/Unit) and Gross Margin (2019-2025)
Table 46. Applied Acoustics Business Overview
Table 47. Applied Acoustics USBL Acoustic Transponder SWOT Analysis
Table 48. Applied Acoustics Recent Developments
Table 49. iXblue USBL Acoustic Transponder Basic Information
Table 50. iXblue USBL Acoustic Transponder Product Overview
Table 51. iXblue USBL Acoustic Transponder Sales (K Units), Revenue (M USD), Price (USD/Unit) and Gross Margin (2019-2025)
Table 52. iXblue Business Overview
Table 53. iXblue USBL Acoustic Transponder SWOT Analysis
Table 54. iXblue Recent Developments
Table 55. Sonardyne USBL Acoustic Transponder Basic Information
Table 56. Sonardyne USBL Acoustic Transponder Product Overview
Table 57. Sonardyne USBL Acoustic Transponder Sales (K Units), Revenue (M USD), Price (USD/Unit) and Gross Margin (2019-2025)
Table 58. Sonardyne USBL Acoustic Transponder SWOT Analysis
Table 59. Sonardyne Business Overview
Table 60. Sonardyne Recent Developments
Table 61. Kongsberg USBL Acoustic Transponder Basic Information
Table 62. Kongsberg USBL Acoustic Transponder Product Overview
Table 63. Kongsberg USBL Acoustic Transponder Sales (K Units), Revenue (M USD), Price (USD/Unit) and Gross Margin (2019-2025)
Table 64. Kongsberg Business Overview
Table 65. Kongsberg Recent Developments
Table 66. Seatronics USBL Acoustic Transponder Basic Information
Table 67. Seatronics USBL Acoustic Transponder Product Overview
Table 68. Seatronics USBL Acoustic Transponder Sales (K Units), Revenue (M USD), Price (USD/Unit) and Gross Margin (2019-2025)
Table 69. Seatronics Business Overview
Table 70. Seatronics Recent Developments
Table 71. Unique Group USBL Acoustic Transponder Basic Information
Table 72. Unique Group USBL Acoustic Transponder Product Overview
Table 73. Unique Group USBL Acoustic Transponder Sales (K Units), Revenue (M USD), Price (USD/Unit) and Gross Margin (2019-2025)
Table 74. Unique Group Business Overview
Table 75. Unique Group Recent Developments
Table 76. Subsea Technologies USBL Acoustic Transponder Basic Information
Table 77. Subsea Technologies USBL Acoustic Transponder Product Overview
Table 78. Subsea Technologies USBL Acoustic Transponder Sales (K Units), Revenue (M USD), Price (USD/Unit) and Gross Margin (2019-2025)
Table 79. Subsea Technologies Business Overview
Table 80. Subsea Technologies Recent Developments
Table 81. EvoLogics GmbH USBL Acoustic Transponder Basic Information
Table 82. EvoLogics GmbH USBL Acoustic Transponder Product Overview
Table 83. EvoLogics GmbH USBL Acoustic Transponder Sales (K Units), Revenue (M USD), Price (USD/Unit) and Gross Margin (2019-2025)
Table 84. EvoLogics GmbH Business Overview
Table 85. EvoLogics GmbH Recent Developments
Table 86. Boxfish Robotics USBL Acoustic Transponder Basic Information
Table 87. Boxfish Robotics USBL Acoustic Transponder Product Overview
Table 88. Boxfish Robotics USBL Acoustic Transponder Sales (K Units), Revenue (M USD), Price (USD/Unit) and Gross Margin (2019-2025)
Table 89. Boxfish Robotics Business Overview
Table 90. Boxfish Robotics Recent Developments
Table 91. Global USBL Acoustic Transponder Sales Forecast by Region (2025-2030) & (K Units)
Table 92. Global USBL Acoustic Transponder Market Size Forecast by Region (2025-2030) & (M USD)
Table 93. North America USBL Acoustic Transponder Sales Forecast by Country (2025-2030) & (K Units)
Table 94. North America USBL Acoustic Transponder Market Size Forecast by Country (2025-2030) & (M USD)
Table 95. Europe USBL Acoustic Transponder Sales Forecast by Country (2025-2030) & (K Units)
Table 96. Europe USBL Acoustic Transponder Market Size Forecast by Country (2025-2030) & (M USD)
Table 97. Asia Pacific USBL Acoustic Transponder Sales Forecast by Region (2025-2030) & (K Units)
Table 98. Asia Pacific USBL Acoustic Transponder Market Size Forecast by Region (2025-2030) & (M USD)
Table 99. South America USBL Acoustic Transponder Sales Forecast by Country (2025-2030) & (K Units)
Table 100. South America USBL Acoustic Transponder Market Size Forecast by Country (2025-2030) & (M USD)
Table 101. Middle East and Africa USBL Acoustic Transponder Consumption Forecast by Country (2025-2030) & (Units)
Table 102. Middle East and Africa USBL Acoustic Transponder Market Size Forecast by Country (2025-2030) & (M USD)
Table 103. Global USBL Acoustic Transponder Sales Forecast by Type (2025-2030) & (K Units)
Table 104. Global USBL Acoustic Transponder Market Size Forecast by Type (2025-2030) & (M USD)
Table 105. Global USBL Acoustic Transponder Price Forecast by Type (2025-2030) & (USD/Unit)
Table 106. Global USBL Acoustic Transponder Sales (K Units) Forecast by Application (2025-2030)
Table 107. Global USBL Acoustic Transponder Market Size Forecast by Application (2025-2030) & (M USD)
List of Figures
Figure 1. Product Picture of USBL Acoustic Transponder
Figure 2. Data Triangulation
Figure 3. Key Caveats
Figure 4. Global USBL Acoustic Transponder Market Size (M USD), 2026-2034
Figure 5. Global USBL Acoustic Transponder Market Size (M USD) (2026-2034)
Figure 6. Global USBL Acoustic Transponder Sales (K Units) & (2026-2034)
Figure 7. Evaluation Matrix of Segment Market Development Potential (Type)
Figure 8. Evaluation Matrix of Segment Market Development Potential (Application)
Figure 9. Evaluation Matrix of Regional Market Development Potential
Figure 10. USBL Acoustic Transponder Market Size by Country (M USD)
Figure 11. USBL Acoustic Transponder Sales Share by Manufacturers in 2023
Figure 12. Global USBL Acoustic Transponder Revenue Share by Manufacturers in 2023
Figure 13. USBL Acoustic Transponder Market Share by Company Type (Tier 1, Tier 2 and Tier 3): 2023
Figure 14. Global Market USBL Acoustic Transponder Average Price (USD/Unit) of Key Manufacturers in 2023
Figure 15. The Global 5 and 10 Largest Players: Market Share by USBL Acoustic Transponder Revenue in 2023
Figure 16. Evaluation Matrix of Segment Market Development Potential (Type)
Figure 17. Global USBL Acoustic Transponder Market Share by Type
Figure 18. Sales Market Share of USBL Acoustic Transponder by Type (2019-2025)
Figure 19. Sales Market Share of USBL Acoustic Transponder by Type in 2023
Figure 20. Market Size Share of USBL Acoustic Transponder by Type (2019-2025)
Figure 21. Market Size Market Share of USBL Acoustic Transponder by Type in 2023
Figure 22. Evaluation Matrix of Segment Market Development Potential (Application)
Figure 23. Global USBL Acoustic Transponder Market Share by Application
Figure 24. Global USBL Acoustic Transponder Sales Market Share by Application (2019-2025)
Figure 25. Global USBL Acoustic Transponder Sales Market Share by Application in 2023
Figure 26. Global USBL Acoustic Transponder Market Share by Application (2019-2025)
Figure 27. Global USBL Acoustic Transponder Market Share by Application in 2023
Figure 28. Global USBL Acoustic Transponder Sales Growth Rate by Application (2019-2025)
Figure 29. Global USBL Acoustic Transponder Sales Market Share by Region (2019-2025)
Figure 30. North America USBL Acoustic Transponder Sales and Growth Rate (2019-2025) & (K Units)
Figure 31. North America USBL Acoustic Transponder Sales Market Share by Country in 2023
Figure 32. U.S. USBL Acoustic Transponder Sales and Growth Rate (2019-2025) & (K Units)
Figure 33. Canada USBL Acoustic Transponder Sales (K Units) and Growth Rate (2019-2025)
Figure 34. Mexico USBL Acoustic Transponder Sales (Units) and Growth Rate (2019-2025)
Figure 35. Europe USBL Acoustic Transponder Sales and Growth Rate (2019-2025) & (K Units)
Figure 36. Europe USBL Acoustic Transponder Sales Market Share by Country in 2023
Figure 37. Germany USBL Acoustic Transponder Sales and Growth Rate (2019-2025) & (K Units)
Figure 38. France USBL Acoustic Transponder Sales and Growth Rate (2019-2025) & (K Units)
Figure 39. U.K. USBL Acoustic Transponder Sales and Growth Rate (2019-2025) & (K Units)
Figure 40. Italy USBL Acoustic Transponder Sales and Growth Rate (2019-2025) & (K Units)
Figure 41. Russia USBL Acoustic Transponder Sales and Growth Rate (2019-2025) & (K Units)
Figure 42. Asia Pacific USBL Acoustic Transponder Sales and Growth Rate (K Units)
Figure 43. Asia Pacific USBL Acoustic Transponder Sales Market Share by Region in 2023
Figure 44. China USBL Acoustic Transponder Sales and Growth Rate (2019-2025) & (K Units)
Figure 45. Japan USBL Acoustic Transponder Sales and Growth Rate (2019-2025) & (K Units)
Figure 46. South Korea USBL Acoustic Transponder Sales and Growth Rate (2019-2025) & (K Units)
Figure 47. India USBL Acoustic Transponder Sales and Growth Rate (2019-2025) & (K Units)
Figure 48. Southeast Asia USBL Acoustic Transponder Sales and Growth Rate (2019-2025) & (K Units)
Figure 49. South America USBL Acoustic Transponder Sales and Growth Rate (K Units)
Figure 50. South America USBL Acoustic Transponder Sales Market Share by Country in 2023
Figure 51. Brazil USBL Acoustic Transponder Sales and Growth Rate (2019-2025) & (K Units)
Figure 52. Argentina USBL Acoustic Transponder Sales and Growth Rate (2019-2025) & (K Units)
Figure 53. Columbia USBL Acoustic Transponder Sales and Growth Rate (2019-2025) & (K Units)
Figure 54. Middle East and Africa USBL Acoustic Transponder Sales and Growth Rate (K Units)
Figure 55. Middle East and Africa USBL Acoustic Transponder Sales Market Share by Region in 2023
Figure 56. Saudi Arabia USBL Acoustic Transponder Sales and Growth Rate (2019-2025) & (K Units)
Figure 57. UAE USBL Acoustic Transponder Sales and Growth Rate (2019-2025) & (K Units)
Figure 58. Egypt USBL Acoustic Transponder Sales and Growth Rate (2019-2025) & (K Units)
Figure 59. Nigeria USBL Acoustic Transponder Sales and Growth Rate (2019-2025) & (K Units)
Figure 60. South Africa USBL Acoustic Transponder Sales and Growth Rate (2019-2025) & (K Units)
Figure 61. Global USBL Acoustic Transponder Sales Forecast by Volume (2026-2034) & (K Units)
Figure 62. Global USBL Acoustic Transponder Market Size Forecast by Value (2026-2034) & (M USD)
Figure 63. Global USBL Acoustic Transponder Sales Market Share Forecast by Type (2025-2030)
Figure 64. Global USBL Acoustic Transponder Market Share Forecast by Type (2025-2030)
Figure 65. Global USBL Acoustic Transponder Sales Forecast by Application (2025-2030)
Figure 66. Global USBL Acoustic Transponder Market Share Forecast by Application (2025-2030)