Turbidity Sensors Market Overview
Turbidity Sensors measure light passing through a sample of water. The light transmitted through the sample is dependent on the amount of soiled particles in the water. These devices are ideally suited for use in washing machines & dishwashers as well as other water purity type applications. As the particles increase, the light transmitted decreases. The measurement produced by the turbidity sensors enables the machine to run for shorter periods, generating energy savings for the consumer and long term environmental benefits.
This report provides a deep insight into the global Turbidity Sensors market covering all its essential aspects. This ranges from a macro overview of the market to micro details of the market size, competitive landscape, development trend, niche market, key market drivers and challenges, SWOT analysis, value chain analysis, etc.
The analysis helps the reader to shape the competition within the industries and strategies for the competitive environment to enhance the potential profit. Furthermore, it provides a simple framework for evaluating and accessing the position of the business organization. The report structure also focuses on the competitive landscape of the Global Turbidity Sensors Market, this report introduces in detail the market share, market performance, product situation, operation situation, etc. of the main players, which helps the readers in the industry to identify the main competitors and deeply understand the competition pattern of the market.
In a word, this report is a must-read for industry players, investors, researchers, consultants, business strategists, and all those who have any kind of stake or are planning to foray into the Turbidity Sensors market in any manner.
Turbidity Sensors Market Analysis:
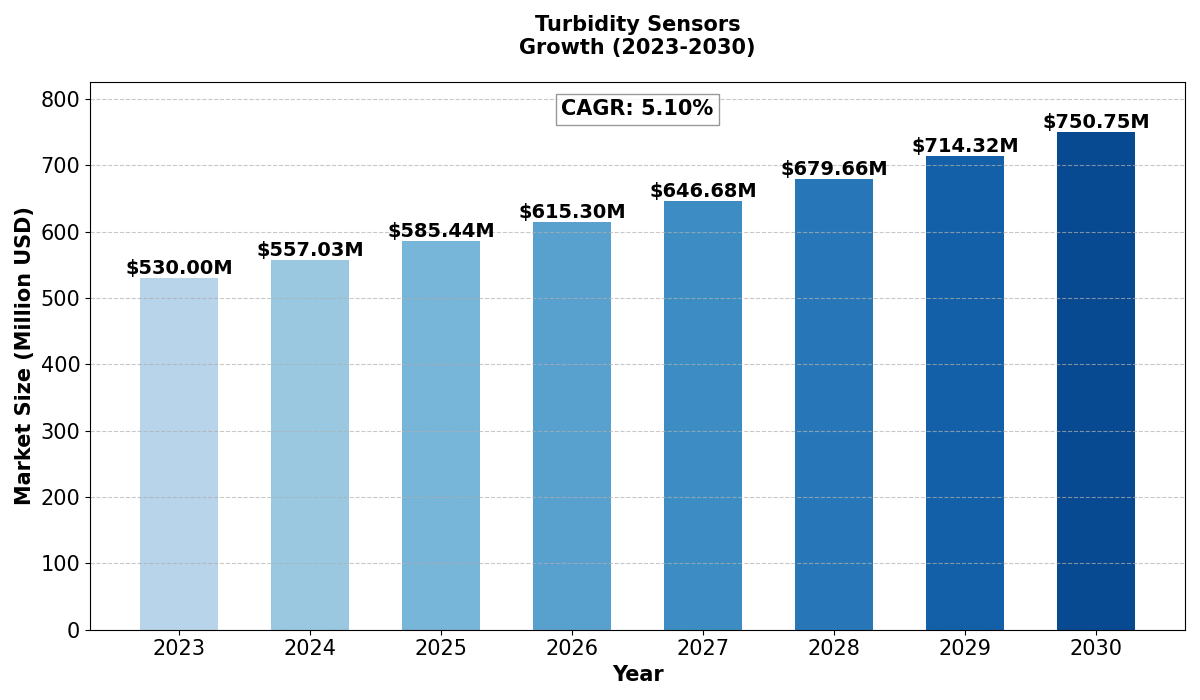
The global Turbidity Sensors Market size was estimated at USD 530 million in 2023 and is projected to reach USD 750.75 million by 2030, exhibiting a CAGR of 5.10% during the forecast period.
North America Turbidity Sensors market size was USD 138.10 million in 2023, at a CAGR of 4.37% during the forecast period of 2025 through 2030.
Turbidity Sensors Key Market Trends :
-
Rising Demand for Water Quality Monitoring
- Increasing concerns over water pollution and contamination are driving the adoption of turbidity sensors in environmental monitoring and wastewater treatment.
-
Advancements in Sensor Technology
- Digital turbidity sensors with improved accuracy, real-time data transmission, and IoT integration are enhancing market growth.
-
Integration of Smart Sensors in Home Appliances
- The use of turbidity sensors in washing machines and dishwashers is rising to optimize energy and water consumption.
-
Growing Industrial Applications
- Industries such as pharmaceuticals, food & beverage, and chemicals are increasingly using turbidity sensors for quality control and process monitoring.
-
Regulatory Compliance and Environmental Standards
- Stringent government regulations regarding water quality and industrial discharge are fueling the demand for turbidity sensors.
Turbidity Sensors Market Regional Analysis :

-
North America:
Strong demand driven by EVs, 5G infrastructure, and renewable energy, with the U.S. leading the market.
-
Europe:
Growth fueled by automotive electrification, renewable energy, and strong regulatory support, with Germany as a key player.
-
Asia-Pacific:
Dominates the market due to large-scale manufacturing in China and Japan, with growing demand from EVs, 5G, and semiconductors.
-
South America:
Emerging market, driven by renewable energy and EV adoption, with Brazil leading growth.
-
Middle East & Africa:
Gradual growth, mainly due to investments in renewable energy and EV infrastructure, with Saudi Arabia and UAE as key contributors.
Turbidity Sensors Market Segmentation :
The research report includes specific segments by region (country), manufacturers, Type, and Application. Market segmentation creates subsets of a market based on product type, end-user or application, Geographic, and other factors. By understanding the market segments, the decision-maker can leverage this targeting in the product, sales, and marketing strategies. Market segments can power your product development cycles by informing how you create product offerings for different segments.
Key Company
- Aanderaa
- Endress+Hauser
- Process Instruments (PI)
- ?KROHNE Group
- Willow Technologies
- Mettler Toledo
- OTT HydroMet
- Optek
- Campbell Scientific
- PASCO
Market Segmentation (by Type)
- Analog Turbidity Sensor
- Digital Turbidity Sensor
Market Segmentation (by Application)
- Wastewater Treatment
- Laboratory
- Industrial Application
Drivers
-
Increasing Need for Water Purity and Safety
- Rising water pollution levels are driving demand for advanced turbidity sensors in wastewater treatment and drinking water monitoring.
-
Adoption of Smart Sensing Technology
- The integration of AI and IoT in turbidity sensors is improving accuracy, automation, and efficiency in industrial applications.
-
Expansion of Industrial and Municipal Wastewater Treatment
- Growing investments in water treatment infrastructure worldwide are boosting market growth.
Restraints
-
High Cost of Advanced Sensor Technologies
- The initial investment in high-precision turbidity sensors may limit adoption in cost-sensitive markets.
-
Complex Calibration and Maintenance
- Regular calibration and maintenance requirements can be challenging, especially in large-scale industrial applications.
-
Limited Awareness in Developing Regions
- The lack of knowledge about advanced turbidity sensors in certain markets may slow growth.
Opportunities
-
Growing Demand for IoT-Enabled Water Monitoring Systems
- The integration of IoT in water quality monitoring offers significant growth potential for turbidity sensor manufacturers.
-
Rising Environmental Regulations
- Stringent water quality regulations worldwide are creating opportunities for sensor adoption in various industries.
-
Technological Innovations in Sensor Design
- Ongoing research and development in sensor miniaturization and wireless connectivity are expanding applications.
Challenges
-
Variability in Measurement Accuracy
- External factors such as air bubbles, temperature changes, and sample composition can impact sensor readings.
-
Competition from Alternative Water Quality Testing Methods
- Optical and ultrasonic methods for water quality analysis may limit the demand for turbidity sensors.
-
Data Management and Standardization Issues
- Ensuring consistent and standardized data interpretation across different applications remains a challenge.
Key Benefits of This Market Research:
- Industry drivers, restraints, and opportunities covered in the study
- Neutral perspective on the market performance
- Recent industry trends and developments
- Competitive landscape & strategies of key players
- Potential & niche segments and regions exhibiting promising growth covered
- Historical, current, and projected market size, in terms of value
- In-depth analysis of the Turbidity Sensors Market
- Overview of the regional outlook of the Turbidity Sensors Market:
Key Reasons to Buy this Report:
- Access to date statistics compiled by our researchers. These provide you with historical and forecast data, which is analyzed to tell you why your market is set to change
- This enables you to anticipate market changes to remain ahead of your competitors
- You will be able to copy data from the Excel spreadsheet straight into your marketing plans, business presentations, or other strategic documents
- The concise analysis, clear graph, and table format will enable you to pinpoint the information you require quickly
- Provision of market value (USD Billion) data for each segment and sub-segment
- Indicates the region and segment that is expected to witness the fastest growth as well as to dominate the market
- Provides insight into the market through Value Chain
- Market dynamics scenario, along with growth opportunities of the market in the years to come
- 6-month post-sales analyst support
Customization of the Report
In case of any queries or customization requirements, please connect with our sales team, who will ensure that your requirements are met.
FAQs
Q: What are the key driving factors and opportunities in the Turbidity Sensors Market?
A: The market is driven by increasing demand for water quality monitoring, smart sensor adoption, and rising environmental regulations. Opportunities exist in IoT-based water monitoring systems and technological advancements in sensor design.
Q: Which region is projected to have the largest market share?
A: Asia-Pacific is expected to lead the market due to rapid industrialization, rising investments in wastewater treatment, and growing environmental concerns.
Q: Who are the top players in the global Turbidity Sensors Market?
A: Leading companies include Aanderaa, Endress+Hauser, Mettler Toledo, OTT HydroMet, and Process Instruments (PI).
Q: What are the latest technological advancements in the industry?
A: Innovations include IoT-enabled turbidity sensors, real-time data analytics, and AI-powered monitoring solutions for improved accuracy and efficiency.
Q: What is the current size of the global Turbidity Sensors Market?
A: The market was valued at USD 530 million in 2023 and is projected to reach USD 750.75 million by 2030, growing at a CAGR of 5.10%.

Get Sample Report PDF for Exclusive Insights
Report Sample Includes
- Table of Contents
- List of Tables & Figures
- Charts, Research Methodology, and more...


