Total Suspended Particles (TSP) Monitor Market, Trends, Business Strategies 2025-2032

Total Suspended Particles (TSP) Monitor Market was valued at 139 million in 2024 and is projected to reach US$ 221 million by 2032, at a CAGR of 7.3% during the forecast period

PDF Icon Download Sample Report PDF
  • Quick Dispatch

    All Orders

  • Secure Payment

    100% Secure Payment

Price range: $1,500.00 through $4,250.00

Clear

MARKET INSIGHTS

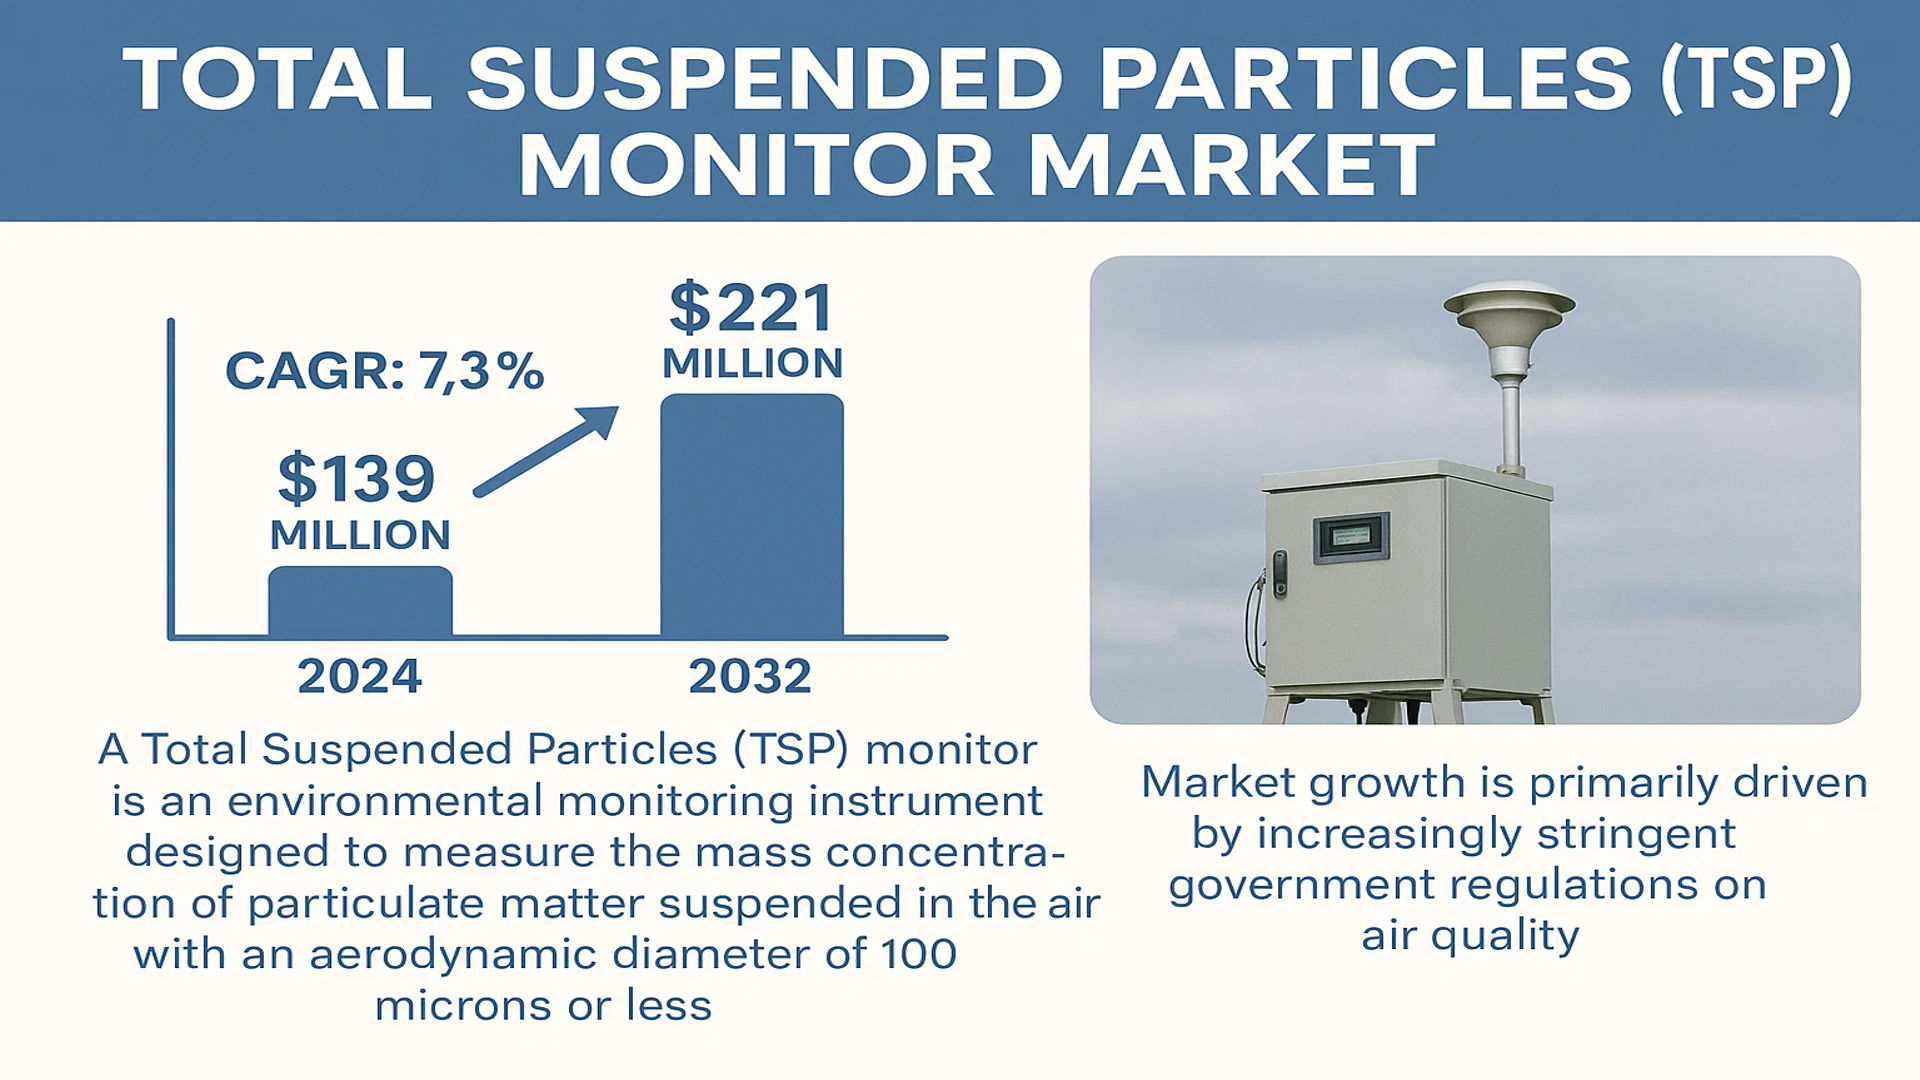
The global Total Suspended Particles (TSP) Monitor Market was valued at 139 million in 2024 and is projected to reach US$ 221 million by 2032, at a CAGR of 7.3% during the forecast period.

A Total Suspended Particles (TSP) Monitor is a critical environmental monitoring instrument designed to measure the mass concentration of particulate matter suspended in the air with an aerodynamic diameter of 100 microns or less. These devices utilize advanced sampling and analysis technologies, such as beta attenuation or gravimetric methods, to capture and quantify particles including dust, smoke, pollen, and spores. The data generated is essential for assessing air quality, ensuring regulatory compliance, and protecting public health, as prolonged exposure to high TSP levels is linked to respiratory and cardiovascular diseases.

Market growth is primarily driven by increasingly stringent government regulations on air quality, such as those enforced by the U.S. Environmental Protection Agency (EPA) and the European Environment Agency (EEA). Furthermore, rapid industrialization and urbanization, particularly in Asia-Pacific nations, are amplifying the demand for continuous air monitoring. Key industry players like Thermo Fisher Scientific, HORIBA, and Acoem are fueling expansion through technological innovations, such as the integration of IoT for real-time data transmission. For instance, in early 2024, Thermo Fisher Scientific launched an enhanced model of its TSP monitor with improved data logging capabilities, catering to the growing need for precise environmental data in industrial and urban settings.
Total Suspended Particles (TSP) Monitor Market

MARKET DYNAMICS

MARKET DRIVERS

Stringent Environmental Regulations and Air Quality Standards to Drive Market Expansion

Global regulatory bodies are implementing increasingly stringent air quality standards, compelling industries and municipalities to adopt advanced monitoring solutions. The World Health Organization’s updated air quality guidelines recommend reducing annual mean PM10 concentrations to 15 μg/m³, creating substantial demand for precise TSP monitoring equipment. Many countries have established national ambient air quality standards that mandate continuous monitoring of particulate matter, with non-compliance resulting in significant penalties. This regulatory pressure is particularly evident in rapidly industrializing regions where air pollution levels frequently exceed safe limits. For instance, numerous manufacturing facilities now face requirements to install continuous emission monitoring systems that include TSP monitors as part of their environmental compliance strategies.

Growing Industrialization and Urbanization to Accelerate Market Growth

Rapid industrialization across developing economies is generating increased particulate matter emissions, driving the need for comprehensive air quality monitoring systems. The manufacturing sector, construction activities, and energy production facilities are significant contributors to airborne particulate matter, with industrial processes accounting for approximately 40% of global TSP emissions. Urbanization trends show that over 55% of the world’s population now resides in urban areas, where transportation networks and construction activities substantially elevate particulate matter concentrations. This urban growth pattern has created critical demand for TSP monitoring in smart city initiatives, with many metropolitan areas implementing dense networks of air quality sensors to track pollution sources and patterns.

Increasing Health Awareness and Environmental Consciousness to Boost Market Demand

Growing public awareness about the health impacts of airborne particulate matter is creating substantial market momentum. Medical research has established that exposure to elevated TSP levels correlates with increased respiratory and cardiovascular diseases, driving both governmental and private sector investment in monitoring infrastructure. Healthcare organizations and insurance providers are increasingly supporting air quality monitoring initiatives as preventive health measures. The economic burden of air pollution-related health issues, estimated to cost global economies approximately 3.3% of GDP annually, further incentivizes investment in monitoring technologies. Community-led air quality monitoring programs are also expanding, with citizen science initiatives deploying TSP monitors to create hyperlocal pollution maps and advocate for environmental improvements.

MARKET CHALLENGES

High Initial Investment and Maintenance Costs to Challenge Market Penetration

The market faces significant adoption barriers due to the substantial capital investment required for advanced TSP monitoring systems. High-precision monitors incorporating beta attenuation, laser diffraction, or gravimetric measurement technologies typically range from $15,000 to $50,000 per unit, creating financial challenges for widespread deployment. Maintenance costs add considerable operational expenses, with annual calibration, filter replacement, and servicing representing approximately 20-30% of the initial equipment cost. These financial constraints are particularly challenging for developing regions and smaller municipalities that face budget limitations while needing to comply with air quality standards. The requirement for specialized technical personnel to operate and maintain these systems further increases the total cost of ownership.

Other Challenges

Technical Limitations and Measurement Accuracy
Achieving consistent measurement accuracy across varying environmental conditions presents significant technical challenges. TSP monitors must account for factors including humidity, temperature fluctuations, and particle composition variations that can affect measurement reliability. Different particle types exhibit varying light scattering properties and sedimentation characteristics, complicating accurate mass concentration calculations. The need for regular calibration against reference methods creates operational complexities, particularly in remote or harsh environmental conditions where access to calibration facilities is limited.

Data Interpretation and Standardization Issues
The absence of universal data interpretation standards creates challenges in comparing measurements across different monitoring networks. Variations in measurement methodologies, sampling frequencies, and data reporting formats hinder the creation of comprehensive air quality databases. Regulatory bodies in different regions often specify conflicting measurement protocols, requiring manufacturers to develop region-specific product variations that increase development costs and limit economies of scale.

MARKET RESTRAINTS

Limited Technical Expertise and Skilled Personnel to Restrain Market Growth

The sophisticated nature of modern TSP monitoring systems requires specialized technical expertise for proper operation, calibration, and maintenance. The global shortage of qualified air quality professionals presents a significant restraint, with an estimated deficit of 40% in environmental monitoring specialists across key markets. This skills gap is particularly acute in emerging economies where environmental monitoring infrastructure is expanding rapidly but local technical expertise remains underdeveloped. The complexity of interpreting monitoring data and maintaining equipment reliability demands continuous training programs, creating additional operational burdens for organizations deploying TSP monitoring networks.

Economic Volatility and Budget Constraints to Limit Market Expansion

Economic uncertainties and budget allocation challenges significantly impact market growth, particularly in the public sector where most environmental monitoring initiatives are funded. Governmental budget cycles and changing political priorities often delay or reduce funding for air quality monitoring programs. During economic downturns, environmental monitoring typically faces budget cuts as governments prioritize immediate economic concerns over environmental protection. The capital-intensive nature of comprehensive monitoring networks makes them vulnerable to funding fluctuations, with multi-year deployment plans often subject to revision or cancellation based on changing fiscal conditions.

Technical Integration Complexities to Hinder Widespread Adoption

Integrating TSP monitoring systems with existing environmental management infrastructure presents substantial technical challenges. Legacy systems often lack compatibility with modern monitoring equipment, requiring expensive upgrades or complete system replacements. The integration of data from multiple monitoring stations into centralized management platforms demands sophisticated data management solutions and robust communication networks. These technical integration requirements create additional implementation barriers, particularly in regions with limited technological infrastructure or where multiple stakeholders must coordinate system deployment and data sharing arrangements.

MARKET OPPORTUNITIES

Technological Advancements and IoT Integration to Create Significant Growth Opportunities

Emerging technologies are revolutionizing TSP monitoring capabilities, creating substantial market opportunities. The integration of Internet of Things connectivity enables real-time data transmission and remote monitoring capabilities, reducing operational costs and improving data accessibility. Advanced sensor technologies incorporating artificial intelligence and machine learning algorithms enhance measurement accuracy and predictive capabilities. These technological innovations are driving development of more compact, energy-efficient monitoring devices that can operate in diverse environmental conditions with minimal maintenance requirements. The convergence of environmental monitoring with smart city infrastructures presents particularly promising opportunities for integrated air quality management systems.

Expanding Industrial Automation and Environmental Compliance Requirements to Drive Future Growth

Increasing automation in industrial processes creates substantial opportunities for integrated TSP monitoring solutions. Modern manufacturing facilities are implementing comprehensive environmental management systems that require continuous particulate matter monitoring as part of their operational protocols. The growing emphasis on corporate environmental responsibility and sustainability reporting is driving industrial enterprises to invest in advanced monitoring technologies. Regulatory developments mandating continuous emissions monitoring across various industrial sectors are expected to significantly expand the addressable market for TSP monitoring equipment in the coming years.

Emerging Markets and Infrastructure Development to Offer Substantial Expansion Potential

Rapid infrastructure development in emerging economies presents significant growth opportunities for TSP monitoring systems. Many developing nations are establishing national air quality monitoring networks as part of their environmental protection initiatives. International development funding and technical assistance programs are supporting the deployment of environmental monitoring infrastructure in regions previously lacking comprehensive air quality assessment capabilities. The increasing recognition of air pollution’s economic impact is driving policy changes that prioritize environmental monitoring investments, particularly in rapidly urbanizing regions where particulate matter concentrations frequently exceed health-based guidelines.

TOTAL SUSPENDED PARTICLES (TSP) MONITOR MARKET TRENDS

Stringent Government Air Quality Regulations Drive Market Adoption

The global push for cleaner air, driven by mounting health concerns and environmental policies, is a primary catalyst for the TSP monitor market. Regulatory bodies worldwide are implementing stricter air quality standards, compelling industries and municipalities to invest in robust monitoring solutions. For instance, the World Health Organization’s updated Air Quality Guidelines have prompted numerous countries to revise their national standards downward, creating a significant need for accurate particulate matter data. This regulatory pressure is not merely about compliance; it is increasingly tied to public health outcomes and economic incentives, as cities and corporations seek to demonstrate environmental responsibility. The market is responding with advanced, reliable monitoring systems that provide the high-fidelity data required for regulatory reporting and informed decision-making. This trend is particularly pronounced in rapidly industrializing regions where economic growth must be balanced with environmental stewardship.

Other Trends

Technological Integration and IoT Connectivity

A significant trend reshaping the TSP monitor landscape is the integration of Internet of Things (IoT) technology and cloud-based data analytics. Modern TSP monitors are increasingly being designed as nodes within larger, interconnected environmental sensor networks. This allows for real-time data transmission, remote calibration, and centralized management of vast monitoring arrays. The ability to aggregate and analyze data from hundreds of sensors simultaneously provides unprecedented spatial and temporal resolution in air quality mapping. This technological shift is moving the market beyond simple data loggers towards intelligent systems that can trigger alerts, predict pollution events, and provide actionable insights for urban planners and facility managers. The value is no longer just in the hardware but in the data intelligence ecosystem that surrounds it.

Expansion into Industrial and Occupational Health Sectors

While ambient air monitoring remains a core application, there is a growing and robust demand for TSP monitors in industrial and occupational health settings. Industries such as mining, construction, manufacturing, and waste management are under increased scrutiny to protect worker health from airborne dust and particulate exposure. Regulations like the permissible exposure limits (PELs) set by occupational safety organizations mandate continuous monitoring in many work environments. This has spurred the development of more rugged, portable, and user-friendly TSP monitors designed for on-site use by safety officers. The industrial segment’s growth is further fueled by corporate sustainability initiatives and the need to mitigate liability risks, making the investment in monitoring equipment a critical component of modern operational safety protocols.

COMPETITIVE LANDSCAPE

Key Industry Players

Companies Strive to Strengthen their Product Portfolio to Sustain Competition

The global Total Suspended Particles (TSP) Monitor market exhibits a semi-consolidated competitive structure, characterized by the presence of multinational corporations, specialized mid-sized firms, and agile regional players. Thermo Fisher Scientific stands as a dominant force in this landscape, leveraging its extensive R&D capabilities and robust global distribution network. The company’s leadership position is reinforced by its comprehensive portfolio of high-precision environmental monitoring instruments, which cater to both regulatory compliance and industrial applications across North America, Europe, and Asia-Pacific regions.

HORIBA, Ltd. and Acoem also command significant market shares, owing to their technological innovations and strong foothold in key industrial and ambient air monitoring sectors. HORIBA’s advanced particle measurement technologies, particularly in real-time monitoring systems, have positioned it favorably in markets with stringent air quality standards. Meanwhile, Acoem has strengthened its position through strategic acquisitions and a focus on integrated environmental monitoring solutions, serving sectors from mining to municipal air quality management.

These leading players are actively pursuing growth through product diversification and geographical expansion. Recent developments include the launch of IoT-enabled TSP monitors with cloud-based data analytics capabilities, reflecting the industry’s shift toward smart environmental monitoring solutions. Furthermore, companies are enhancing their portable monitor offerings to address the growing demand for flexible, on-site particulate matter assessment in construction, mining, and emergency response applications.

Emerging competitors from Asia, particularly Chinese manufacturers like Qingdao Laoying Haina Opto-electronic Environmental Protection Group and Qingdao Juchuang Environmental Protection Group, are gaining traction through cost-competitive offerings and strengthened domestic presence. These companies are increasingly focusing on international market penetration, supported by improving product quality and compliance with international standards. Additionally, specialized players such as Tisch Environmental and Mesa Labs maintain strong positions in niche segments, particularly in reference-grade monitoring equipment and environmental certification applications.

List of Key Total Suspended Particles (TSP) Monitor Companies Profiled

Segment Analysis:

By Type

Fixed Segment Dominates the Market Due to Continuous Monitoring Requirements in Industrial and Regulatory Settings

The market is segmented based on type into:

  • Fixed
    • Subtypes: High-volume samplers, Beta attenuation monitors, and others
  • Portable
    • Subtypes: Handheld monitors, Personal dust monitors, and others

By Application

Ambient Air Monitoring Segment Leads Due to Stringent Government Regulations and Public Health Concerns

The market is segmented based on application into:

  • Ambient Air Monitoring
  • Industrial Environment Monitoring
  • Mines
  • Other

By Technology

Beta Attenuation Technology Holds Significant Share Owing to Its High Accuracy and Regulatory Acceptance

The market is segmented based on technology into:

  • Beta Attenuation
  • Gravimetric
  • Light Scattering
  • Tapered Element Oscillating Microbalance (TEOM)
  • Others

By End User

Government and Environmental Agencies Lead the Market Driven by Compliance and Public Safety Mandates

The market is segmented based on end user into:

  • Government and Environmental Agencies
  • Industrial Manufacturing
  • Mining Companies
  • Research and Academic Institutions
  • Others

Regional Analysis: Total Suspended Particles (TSP) Monitor Market

Asia-Pacific
The Asia-Pacific region dominates the global TSP monitor market, driven by severe air pollution challenges and rapid industrialization. China, the world’s largest market for air quality monitoring equipment, has implemented its National Air Quality Monitoring Network, which includes over 1,500 monitoring stations. India’s National Clean Air Programme aims to reduce particulate matter concentrations by 20-30% by 2024, creating substantial demand for monitoring solutions. While cost sensitivity leads to significant adoption of portable monitors, fixed installations are growing in urban centers. The region’s manufacturing strength is evident through companies like Qingdao Laoying Haina and Qingdao Juchuang, which compete effectively with international players. However, regulatory enforcement varies significantly across countries, with more developed markets like Japan and South Korea maintaining stricter standards than emerging economies.

North America
North America represents a mature but steadily growing market for TSP monitors, characterized by stringent regulatory frameworks and advanced technological adoption. The United States Environmental Protection Agency’s National Ambient Air Quality Standards (NAAQS) mandate continuous monitoring of particulate matter, driving demand for both fixed and portable TSP monitors. The market is dominated by established players like Thermo Fisher Scientific, Mesa Labs, and Tisch Environmental, who provide high-precision monitoring solutions. Recent developments include the integration of IoT and cloud-based data management systems, allowing real-time air quality assessment. While the U.S. accounts for the largest share, Canada’s increasing focus on environmental protection and Mexico’s growing industrial sector contribute to regional market expansion. The emphasis remains on regulatory compliance and technological innovation.

Europe
Europe’s TSP monitor market is driven by comprehensive environmental regulations and strong public awareness of air quality issues. The European Union’s Ambient Air Quality Directive sets strict limits for particulate matter concentrations, requiring member states to maintain extensive monitoring networks. Countries like Germany, France, and the UK have sophisticated air quality monitoring infrastructures, with a preference for high-accuracy fixed monitors. The market sees significant innovation in sensor technology and data analytics, with companies like Acoem and HORIBA leading development efforts. The European Environment Agency’s air quality assessments further stimulate market growth by highlighting pollution hotspots. However, market saturation in Western Europe is offset by growing investments in Eastern European countries, where air quality monitoring infrastructure is still developing.

South America
South America presents an emerging market for TSP monitors, characterized by growing environmental awareness but inconsistent regulatory enforcement. Brazil and Argentina lead regional demand, driven by urban air quality concerns and industrial expansion. São Paulo’s environmental agency CETESB operates one of Latin America’s most advanced air monitoring networks, while Buenos Aires has implemented several air quality initiatives. The market predominantly features portable monitors due to cost considerations and flexibility needs. Economic volatility and budgetary constraints often delay large-scale monitoring projects, though international funding and development programs provide some support. Local manufacturing remains limited, with most equipment imported from North America, Europe, and increasingly from China.

Middle East & Africa
The Middle East & Africa region shows varying development patterns in TSP monitoring. Gulf Cooperation Council countries, particularly Saudi Arabia and the UAE, have implemented advanced monitoring networks driven by environmental visions and urban development projects. These oil-rich nations primarily use high-end fixed monitoring systems from international suppliers. In contrast, African markets face significant challenges due to limited funding, infrastructure gaps, and weaker regulatory frameworks. South Africa maintains the most developed monitoring network on the continent, while other nations rely on international aid programs for environmental monitoring equipment. The region shows long-term growth potential as urbanization increases and environmental awareness grows, but development remains uneven across countries.

Report Scope

This market research report provides a comprehensive analysis of the global Total Suspended Particles (TSP) Monitor market, covering the forecast period 2024–2032. It offers detailed insights into market dynamics, technological advancements, competitive landscape, and key trends shaping the industry.

Key focus areas of the report include:

  • Market Size & Forecast: Historical data and future projections for revenue, unit shipments, and market value across major regions and segments.
  • Segmentation Analysis: Detailed breakdown by product type, technology, application, and end-user industry to identify high-growth segments and investment opportunities.
  • Regional Outlook: Insights into market performance across North America, Europe, Asia-Pacific, Latin America, and the Middle East & Africa, including country-level analysis where relevant.
  • Competitive Landscape: Profiles of leading market participants, including their product offerings, R&D focus, manufacturing capacity, pricing strategies, and recent developments such as mergers, acquisitions, and partnerships.
  • Technology Trends & Innovation: Assessment of emerging technologies, integration of IoT and AI, sensor advancements, and evolving industry standards.
  • Market Drivers & Restraints: Evaluation of factors driving market growth along with challenges, supply chain constraints, regulatory issues, and market-entry barriers.
  • Stakeholder Analysis: Insights for component suppliers, OEMs, system integrators, investors, and policymakers regarding the evolving ecosystem and strategic opportunities.

Primary and secondary research methods are employed, including interviews with industry experts, data from verified sources, and real-time market intelligence to ensure the accuracy and reliability of the insights presented.

FREQUENTLY ASKED QUESTIONS:

What is the current market size of Global Total Suspended Particles (TSP) Monitor Market?

-> Total Suspended Particles (TSP) Monitor Market was valued at 139 million in 2024 and is projected to reach US$ 221 million by 2032, at a CAGR of 7.3% during the forecast periods.

Which key companies operate in Global Total Suspended Particles (TSP) Monitor Market?

-> Key players include Acoem, Mesa Labs, Thermo Fisher Scientific, HORIBA, Aeroqual, Qingdao Laoying Haina Opto-electronic Environmental Protection Group, Qingdao Juchuang Environmental Protection Group, Tisch Environmental, AMS Analytica, and Staplex, among others.

What are the key growth drivers?

-> Key growth drivers include stringent government air quality regulations, increasing industrialization, rising public health awareness, and growing demand for environmental monitoring in mining and manufacturing sectors.

Which region dominates the market?

-> Asia-Pacific is the fastest-growing region, driven by China’s significant market expansion, while North America remains a technologically advanced market with strong regulatory frameworks.

What are the emerging trends?

-> Emerging trends include integration of IoT connectivity for real-time data monitoring, development of portable and handheld TSP monitors, adoption of laser-based detection technologies, and increasing focus on calibration-free and low-maintenance systems.

Total Suspended Particles (TSP) Monitor Market, Trends, Business Strategies 2025-2032

Get Sample Report PDF for Exclusive Insights

Report Sample Includes

  • Table of Contents
  • List of Tables & Figures
  • Charts, Research Methodology, and more...
PDF Icon Download Sample Report PDF
SKU: a767d1ee027e
Category:

Download Sample Report

Table of Content

1 Introduction to Research & Analysis Reports
1.1 Total Suspended Particles (TSP) Monitor Market Definition
1.2 Market Segments
1.2.1 Segment by Type
1.2.2 Segment by Application
1.3 Global Total Suspended Particles (TSP) Monitor Market Overview
1.4 Features & Benefits of This Report
1.5 Methodology & Sources of Information
1.5.1 Research Methodology
1.5.2 Research Process
1.5.3 Base Year
1.5.4 Report Assumptions & Caveats
2 Global Total Suspended Particles (TSP) Monitor Overall Market Size
2.1 Global Total Suspended Particles (TSP) Monitor Market Size: 2024 VS 2032
2.2 Global Total Suspended Particles (TSP) Monitor Market Size, Prospects & Forecasts: 2020-2032
2.3 Global Total Suspended Particles (TSP) Monitor Sales: 2020-2032
3 Company Landscape
3.1 Top Total Suspended Particles (TSP) Monitor Players in Global Market
3.2 Top Global Total Suspended Particles (TSP) Monitor Companies Ranked by Revenue
3.3 Global Total Suspended Particles (TSP) Monitor Revenue by Companies
3.4 Global Total Suspended Particles (TSP) Monitor Sales by Companies
3.5 Global Total Suspended Particles (TSP) Monitor Price by Manufacturer (2020-2025)
3.6 Top 3 and Top 5 Total Suspended Particles (TSP) Monitor Companies in Global Market, by Revenue in 2024
3.7 Global Manufacturers Total Suspended Particles (TSP) Monitor Product Type
3.8 Tier 1, Tier 2, and Tier 3 Total Suspended Particles (TSP) Monitor Players in Global Market
3.8.1 List of Global Tier 1 Total Suspended Particles (TSP) Monitor Companies
3.8.2 List of Global Tier 2 and Tier 3 Total Suspended Particles (TSP) Monitor Companies
4 Sights by Product
4.1 Overview
4.1.1 Segment by Type – Global Total Suspended Particles (TSP) Monitor Market Size Markets, 2024 & 2032
4.1.2 Fixed
4.1.3 Portable
4.2 Segment by Type – Global Total Suspended Particles (TSP) Monitor Revenue & Forecasts
4.2.1 Segment by Type – Global Total Suspended Particles (TSP) Monitor Revenue, 2020-2025
4.2.2 Segment by Type – Global Total Suspended Particles (TSP) Monitor Revenue, 2026-2032
4.2.3 Segment by Type – Global Total Suspended Particles (TSP) Monitor Revenue Market Share, 2020-2032
4.3 Segment by Type – Global Total Suspended Particles (TSP) Monitor Sales & Forecasts
4.3.1 Segment by Type – Global Total Suspended Particles (TSP) Monitor Sales, 2020-2025
4.3.2 Segment by Type – Global Total Suspended Particles (TSP) Monitor Sales, 2026-2032
4.3.3 Segment by Type – Global Total Suspended Particles (TSP) Monitor Sales Market Share, 2020-2032
4.4 Segment by Type – Global Total Suspended Particles (TSP) Monitor Price (Manufacturers Selling Prices), 2020-2032
5 Sights by Application
5.1 Overview
5.1.1 Segment by Application – Global Total Suspended Particles (TSP) Monitor Market Size, 2024 & 2032
5.1.2 Ambient Air Monitoring
5.1.3 Industrial Environment Monitoring
5.1.4 Mines
5.1.5 Other
5.2 Segment by Application – Global Total Suspended Particles (TSP) Monitor Revenue & Forecasts
5.2.1 Segment by Application – Global Total Suspended Particles (TSP) Monitor Revenue, 2020-2025
5.2.2 Segment by Application – Global Total Suspended Particles (TSP) Monitor Revenue, 2026-2032
5.2.3 Segment by Application – Global Total Suspended Particles (TSP) Monitor Revenue Market Share, 2020-2032
5.3 Segment by Application – Global Total Suspended Particles (TSP) Monitor Sales & Forecasts
5.3.1 Segment by Application – Global Total Suspended Particles (TSP) Monitor Sales, 2020-2025
5.3.2 Segment by Application – Global Total Suspended Particles (TSP) Monitor Sales, 2026-2032
5.3.3 Segment by Application – Global Total Suspended Particles (TSP) Monitor Sales Market Share, 2020-2032
5.4 Segment by Application – Global Total Suspended Particles (TSP) Monitor Price (Manufacturers Selling Prices), 2020-2032
6 Sights by Region
6.1 By Region – Global Total Suspended Particles (TSP) Monitor Market Size, 2024 & 2032
6.2 By Region – Global Total Suspended Particles (TSP) Monitor Revenue & Forecasts
6.2.1 By Region – Global Total Suspended Particles (TSP) Monitor Revenue, 2020-2025
6.2.2 By Region – Global Total Suspended Particles (TSP) Monitor Revenue, 2026-2032
6.2.3 By Region – Global Total Suspended Particles (TSP) Monitor Revenue Market Share, 2020-2032
6.3 By Region – Global Total Suspended Particles (TSP) Monitor Sales & Forecasts
6.3.1 By Region – Global Total Suspended Particles (TSP) Monitor Sales, 2020-2025
6.3.2 By Region – Global Total Suspended Particles (TSP) Monitor Sales, 2026-2032
6.3.3 By Region – Global Total Suspended Particles (TSP) Monitor Sales Market Share, 2020-2032
6.4 North America
6.4.1 By Country – North America Total Suspended Particles (TSP) Monitor Revenue, 2020-2032
6.4.2 By Country – North America Total Suspended Particles (TSP) Monitor Sales, 2020-2032
6.4.3 United States Total Suspended Particles (TSP) Monitor Market Size, 2020-2032
6.4.4 Canada Total Suspended Particles (TSP) Monitor Market Size, 2020-2032
6.4.5 Mexico Total Suspended Particles (TSP) Monitor Market Size, 2020-2032
6.5 Europe
6.5.1 By Country – Europe Total Suspended Particles (TSP) Monitor Revenue, 2020-2032
6.5.2 By Country – Europe Total Suspended Particles (TSP) Monitor Sales, 2020-2032
6.5.3 Germany Total Suspended Particles (TSP) Monitor Market Size, 2020-2032
6.5.4 France Total Suspended Particles (TSP) Monitor Market Size, 2020-2032
6.5.5 U.K. Total Suspended Particles (TSP) Monitor Market Size, 2020-2032
6.5.6 Italy Total Suspended Particles (TSP) Monitor Market Size, 2020-2032
6.5.7 Russia Total Suspended Particles (TSP) Monitor Market Size, 2020-2032
6.5.8 Nordic Countries Total Suspended Particles (TSP) Monitor Market Size, 2020-2032
6.5.9 Benelux Total Suspended Particles (TSP) Monitor Market Size, 2020-2032
6.6 Asia
6.6.1 By Region – Asia Total Suspended Particles (TSP) Monitor Revenue, 2020-2032
6.6.2 By Region – Asia Total Suspended Particles (TSP) Monitor Sales, 2020-2032
6.6.3 China Total Suspended Particles (TSP) Monitor Market Size, 2020-2032
6.6.4 Japan Total Suspended Particles (TSP) Monitor Market Size, 2020-2032
6.6.5 South Korea Total Suspended Particles (TSP) Monitor Market Size, 2020-2032
6.6.6 Southeast Asia Total Suspended Particles (TSP) Monitor Market Size, 2020-2032
6.6.7 India Total Suspended Particles (TSP) Monitor Market Size, 2020-2032
6.7 South America
6.7.1 By Country – South America Total Suspended Particles (TSP) Monitor Revenue, 2020-2032
6.7.2 By Country – South America Total Suspended Particles (TSP) Monitor Sales, 2020-2032
6.7.3 Brazil Total Suspended Particles (TSP) Monitor Market Size, 2020-2032
6.7.4 Argentina Total Suspended Particles (TSP) Monitor Market Size, 2020-2032
6.8 Middle East & Africa
6.8.1 By Country – Middle East & Africa Total Suspended Particles (TSP) Monitor Revenue, 2020-2032
6.8.2 By Country – Middle East & Africa Total Suspended Particles (TSP) Monitor Sales, 2020-2032
6.8.3 Turkey Total Suspended Particles (TSP) Monitor Market Size, 2020-2032
6.8.4 Israel Total Suspended Particles (TSP) Monitor Market Size, 2020-2032
6.8.5 Saudi Arabia Total Suspended Particles (TSP) Monitor Market Size, 2020-2032
6.8.6 UAE Total Suspended Particles (TSP) Monitor Market Size, 2020-2032
7 Manufacturers & Brands Profiles
7.1 Acoem
7.1.1 Acoem Company Summary
7.1.2 Acoem Business Overview
7.1.3 Acoem Total Suspended Particles (TSP) Monitor Major Product Offerings
7.1.4 Acoem Total Suspended Particles (TSP) Monitor Sales and Revenue in Global (2020-2025)
7.1.5 Acoem Key News & Latest Developments
7.2 Mesa Labs
7.2.1 Mesa Labs Company Summary
7.2.2 Mesa Labs Business Overview
7.2.3 Mesa Labs Total Suspended Particles (TSP) Monitor Major Product Offerings
7.2.4 Mesa Labs Total Suspended Particles (TSP) Monitor Sales and Revenue in Global (2020-2025)
7.2.5 Mesa Labs Key News & Latest Developments
7.3 Thermo Fisher Scientific
7.3.1 Thermo Fisher Scientific Company Summary
7.3.2 Thermo Fisher Scientific Business Overview
7.3.3 Thermo Fisher Scientific Total Suspended Particles (TSP) Monitor Major Product Offerings
7.3.4 Thermo Fisher Scientific Total Suspended Particles (TSP) Monitor Sales and Revenue in Global (2020-2025)
7.3.5 Thermo Fisher Scientific Key News & Latest Developments
7.4 HORIBA
7.4.1 HORIBA Company Summary
7.4.2 HORIBA Business Overview
7.4.3 HORIBA Total Suspended Particles (TSP) Monitor Major Product Offerings
7.4.4 HORIBA Total Suspended Particles (TSP) Monitor Sales and Revenue in Global (2020-2025)
7.4.5 HORIBA Key News & Latest Developments
7.5 Aeroqual
7.5.1 Aeroqual Company Summary
7.5.2 Aeroqual Business Overview
7.5.3 Aeroqual Total Suspended Particles (TSP) Monitor Major Product Offerings
7.5.4 Aeroqual Total Suspended Particles (TSP) Monitor Sales and Revenue in Global (2020-2025)
7.5.5 Aeroqual Key News & Latest Developments
7.6 Qingdao Laoying Haina Opto-electronic Environmental Protection Group
7.6.1 Qingdao Laoying Haina Opto-electronic Environmental Protection Group Company Summary
7.6.2 Qingdao Laoying Haina Opto-electronic Environmental Protection Group Business Overview
7.6.3 Qingdao Laoying Haina Opto-electronic Environmental Protection Group Total Suspended Particles (TSP) Monitor Major Product Offerings
7.6.4 Qingdao Laoying Haina Opto-electronic Environmental Protection Group Total Suspended Particles (TSP) Monitor Sales and Revenue in Global (2020-2025)
7.6.5 Qingdao Laoying Haina Opto-electronic Environmental Protection Group Key News & Latest Developments
7.7 Qingdao Juchuang Environmental Protection Group
7.7.1 Qingdao Juchuang Environmental Protection Group Company Summary
7.7.2 Qingdao Juchuang Environmental Protection Group Business Overview
7.7.3 Qingdao Juchuang Environmental Protection Group Total Suspended Particles (TSP) Monitor Major Product Offerings
7.7.4 Qingdao Juchuang Environmental Protection Group Total Suspended Particles (TSP) Monitor Sales and Revenue in Global (2020-2025)
7.7.5 Qingdao Juchuang Environmental Protection Group Key News & Latest Developments
7.8 Tisch Environmental
7.8.1 Tisch Environmental Company Summary
7.8.2 Tisch Environmental Business Overview
7.8.3 Tisch Environmental Total Suspended Particles (TSP) Monitor Major Product Offerings
7.8.4 Tisch Environmental Total Suspended Particles (TSP) Monitor Sales and Revenue in Global (2020-2025)
7.8.5 Tisch Environmental Key News & Latest Developments
7.9 AMS Analytica
7.9.1 AMS Analytica Company Summary
7.9.2 AMS Analytica Business Overview
7.9.3 AMS Analytica Total Suspended Particles (TSP) Monitor Major Product Offerings
7.9.4 AMS Analytica Total Suspended Particles (TSP) Monitor Sales and Revenue in Global (2020-2025)
7.9.5 AMS Analytica Key News & Latest Developments
7.10 Staplex
7.10.1 Staplex Company Summary
7.10.2 Staplex Business Overview
7.10.3 Staplex Total Suspended Particles (TSP) Monitor Major Product Offerings
7.10.4 Staplex Total Suspended Particles (TSP) Monitor Sales and Revenue in Global (2020-2025)
7.10.5 Staplex Key News & Latest Developments
7.11 DustScan
7.11.1 DustScan Company Summary
7.11.2 DustScan Business Overview
7.11.3 DustScan Total Suspended Particles (TSP) Monitor Major Product Offerings
7.11.4 DustScan Total Suspended Particles (TSP) Monitor Sales and Revenue in Global (2020-2025)
7.11.5 DustScan Key News & Latest Developments
7.12 ENVCO
7.12.1 ENVCO Company Summary
7.12.2 ENVCO Business Overview
7.12.3 ENVCO Total Suspended Particles (TSP) Monitor Major Product Offerings
7.12.4 ENVCO Total Suspended Particles (TSP) Monitor Sales and Revenue in Global (2020-2025)
7.12.5 ENVCO Key News & Latest Developments
7.13 California Tech Zone
7.13.1 California Tech Zone Company Summary
7.13.2 California Tech Zone Business Overview
7.13.3 California Tech Zone Total Suspended Particles (TSP) Monitor Major Product Offerings
7.13.4 California Tech Zone Total Suspended Particles (TSP) Monitor Sales and Revenue in Global (2020-2025)
7.13.5 California Tech Zone Key News & Latest Developments
8 Global Total Suspended Particles (TSP) Monitor Production Capacity, Analysis
8.1 Global Total Suspended Particles (TSP) Monitor Production Capacity, 2020-2032
8.2 Total Suspended Particles (TSP) Monitor Production Capacity of Key Manufacturers in Global Market
8.3 Global Total Suspended Particles (TSP) Monitor Production by Region
9 Key Market Trends, Opportunity, Drivers and Restraints
9.1 Market Opportunities & Trends
9.2 Market Drivers
9.3 Market Restraints
10 Total Suspended Particles (TSP) Monitor Supply Chain Analysis
10.1 Total Suspended Particles (TSP) Monitor Industry Value Chain
10.2 Total Suspended Particles (TSP) Monitor Upstream Market
10.3 Total Suspended Particles (TSP) Monitor Downstream and Clients
10.4 Marketing Channels Analysis
10.4.1 Marketing Channels
10.4.2 Total Suspended Particles (TSP) Monitor Distributors and Sales Agents in Global
11 Conclusion
12 Appendix
12.1 Note
12.2 Examples of Clients
12.3 DisclaimerList of Tables
Table 1. Key Players of Total Suspended Particles (TSP) Monitor in Global Market
Table 2. Top Total Suspended Particles (TSP) Monitor Players in Global Market, Ranking by Revenue (2024)
Table 3. Global Total Suspended Particles (TSP) Monitor Revenue by Companies, (US$, Mn), 2020-2025
Table 4. Global Total Suspended Particles (TSP) Monitor Revenue Share by Companies, 2020-2025
Table 5. Global Total Suspended Particles (TSP) Monitor Sales by Companies, (K Units), 2020-2025
Table 6. Global Total Suspended Particles (TSP) Monitor Sales Share by Companies, 2020-2025
Table 7. Key Manufacturers Total Suspended Particles (TSP) Monitor Price (2020-2025) & (K US$/Unit)
Table 8. Global Manufacturers Total Suspended Particles (TSP) Monitor Product Type
Table 9. List of Global Tier 1 Total Suspended Particles (TSP) Monitor Companies, Revenue (US$, Mn) in 2024 and Market Share
Table 10. List of Global Tier 2 and Tier 3 Total Suspended Particles (TSP) Monitor Companies, Revenue (US$, Mn) in 2024 and Market Share
Table 11. Segment by Type – Global Total Suspended Particles (TSP) Monitor Revenue, (US$, Mn), 2024 & 2032
Table 12. Segment by Type – Global Total Suspended Particles (TSP) Monitor Revenue (US$, Mn), 2020-2025
Table 13. Segment by Type – Global Total Suspended Particles (TSP) Monitor Revenue (US$, Mn), 2026-2032
Table 14. Segment by Type – Global Total Suspended Particles (TSP) Monitor Sales (K Units), 2020-2025
Table 15. Segment by Type – Global Total Suspended Particles (TSP) Monitor Sales (K Units), 2026-2032
Table 16. Segment by Application – Global Total Suspended Particles (TSP) Monitor Revenue, (US$, Mn), 2024 & 2032
Table 17. Segment by Application – Global Total Suspended Particles (TSP) Monitor Revenue, (US$, Mn), 2020-2025
Table 18. Segment by Application – Global Total Suspended Particles (TSP) Monitor Revenue, (US$, Mn), 2026-2032
Table 19. Segment by Application – Global Total Suspended Particles (TSP) Monitor Sales, (K Units), 2020-2025
Table 20. Segment by Application – Global Total Suspended Particles (TSP) Monitor Sales, (K Units), 2026-2032
Table 21. By Region – Global Total Suspended Particles (TSP) Monitor Revenue, (US$, Mn), 2025-2032
Table 22. By Region – Global Total Suspended Particles (TSP) Monitor Revenue, (US$, Mn), 2020-2025
Table 23. By Region – Global Total Suspended Particles (TSP) Monitor Revenue, (US$, Mn), 2026-2032
Table 24. By Region – Global Total Suspended Particles (TSP) Monitor Sales, (K Units), 2020-2025
Table 25. By Region – Global Total Suspended Particles (TSP) Monitor Sales, (K Units), 2026-2032
Table 26. By Country – North America Total Suspended Particles (TSP) Monitor Revenue, (US$, Mn), 2020-2025
Table 27. By Country – North America Total Suspended Particles (TSP) Monitor Revenue, (US$, Mn), 2026-2032
Table 28. By Country – North America Total Suspended Particles (TSP) Monitor Sales, (K Units), 2020-2025
Table 29. By Country – North America Total Suspended Particles (TSP) Monitor Sales, (K Units), 2026-2032
Table 30. By Country – Europe Total Suspended Particles (TSP) Monitor Revenue, (US$, Mn), 2020-2025
Table 31. By Country – Europe Total Suspended Particles (TSP) Monitor Revenue, (US$, Mn), 2026-2032
Table 32. By Country – Europe Total Suspended Particles (TSP) Monitor Sales, (K Units), 2020-2025
Table 33. By Country – Europe Total Suspended Particles (TSP) Monitor Sales, (K Units), 2026-2032
Table 34. By Region – Asia Total Suspended Particles (TSP) Monitor Revenue, (US$, Mn), 2020-2025
Table 35. By Region – Asia Total Suspended Particles (TSP) Monitor Revenue, (US$, Mn), 2026-2032
Table 36. By Region – Asia Total Suspended Particles (TSP) Monitor Sales, (K Units), 2020-2025
Table 37. By Region – Asia Total Suspended Particles (TSP) Monitor Sales, (K Units), 2026-2032
Table 38. By Country – South America Total Suspended Particles (TSP) Monitor Revenue, (US$, Mn), 2020-2025
Table 39. By Country – South America Total Suspended Particles (TSP) Monitor Revenue, (US$, Mn), 2026-2032
Table 40. By Country – South America Total Suspended Particles (TSP) Monitor Sales, (K Units), 2020-2025
Table 41. By Country – South America Total Suspended Particles (TSP) Monitor Sales, (K Units), 2026-2032
Table 42. By Country – Middle East & Africa Total Suspended Particles (TSP) Monitor Revenue, (US$, Mn), 2020-2025
Table 43. By Country – Middle East & Africa Total Suspended Particles (TSP) Monitor Revenue, (US$, Mn), 2026-2032
Table 44. By Country – Middle East & Africa Total Suspended Particles (TSP) Monitor Sales, (K Units), 2020-2025
Table 45. By Country – Middle East & Africa Total Suspended Particles (TSP) Monitor Sales, (K Units), 2026-2032
Table 46. Acoem Company Summary
Table 47. Acoem Total Suspended Particles (TSP) Monitor Product Offerings
Table 48. Acoem Total Suspended Particles (TSP) Monitor Sales (K Units), Revenue (US$, Mn) and Average Price (K US$/Unit) & (2020-2025)
Table 49. Acoem Key News & Latest Developments
Table 50. Mesa Labs Company Summary
Table 51. Mesa Labs Total Suspended Particles (TSP) Monitor Product Offerings
Table 52. Mesa Labs Total Suspended Particles (TSP) Monitor Sales (K Units), Revenue (US$, Mn) and Average Price (K US$/Unit) & (2020-2025)
Table 53. Mesa Labs Key News & Latest Developments
Table 54. Thermo Fisher Scientific Company Summary
Table 55. Thermo Fisher Scientific Total Suspended Particles (TSP) Monitor Product Offerings
Table 56. Thermo Fisher Scientific Total Suspended Particles (TSP) Monitor Sales (K Units), Revenue (US$, Mn) and Average Price (K US$/Unit) & (2020-2025)
Table 57. Thermo Fisher Scientific Key News & Latest Developments
Table 58. HORIBA Company Summary
Table 59. HORIBA Total Suspended Particles (TSP) Monitor Product Offerings
Table 60. HORIBA Total Suspended Particles (TSP) Monitor Sales (K Units), Revenue (US$, Mn) and Average Price (K US$/Unit) & (2020-2025)
Table 61. HORIBA Key News & Latest Developments
Table 62. Aeroqual Company Summary
Table 63. Aeroqual Total Suspended Particles (TSP) Monitor Product Offerings
Table 64. Aeroqual Total Suspended Particles (TSP) Monitor Sales (K Units), Revenue (US$, Mn) and Average Price (K US$/Unit) & (2020-2025)
Table 65. Aeroqual Key News & Latest Developments
Table 66. Qingdao Laoying Haina Opto-electronic Environmental Protection Group Company Summary
Table 67. Qingdao Laoying Haina Opto-electronic Environmental Protection Group Total Suspended Particles (TSP) Monitor Product Offerings
Table 68. Qingdao Laoying Haina Opto-electronic Environmental Protection Group Total Suspended Particles (TSP) Monitor Sales (K Units), Revenue (US$, Mn) and Average Price (K US$/Unit) & (2020-2025)
Table 69. Qingdao Laoying Haina Opto-electronic Environmental Protection Group Key News & Latest Developments
Table 70. Qingdao Juchuang Environmental Protection Group Company Summary
Table 71. Qingdao Juchuang Environmental Protection Group Total Suspended Particles (TSP) Monitor Product Offerings
Table 72. Qingdao Juchuang Environmental Protection Group Total Suspended Particles (TSP) Monitor Sales (K Units), Revenue (US$, Mn) and Average Price (K US$/Unit) & (2020-2025)
Table 73. Qingdao Juchuang Environmental Protection Group Key News & Latest Developments
Table 74. Tisch Environmental Company Summary
Table 75. Tisch Environmental Total Suspended Particles (TSP) Monitor Product Offerings
Table 76. Tisch Environmental Total Suspended Particles (TSP) Monitor Sales (K Units), Revenue (US$, Mn) and Average Price (K US$/Unit) & (2020-2025)
Table 77. Tisch Environmental Key News & Latest Developments
Table 78. AMS Analytica Company Summary
Table 79. AMS Analytica Total Suspended Particles (TSP) Monitor Product Offerings
Table 80. AMS Analytica Total Suspended Particles (TSP) Monitor Sales (K Units), Revenue (US$, Mn) and Average Price (K US$/Unit) & (2020-2025)
Table 81. AMS Analytica Key News & Latest Developments
Table 82. Staplex Company Summary
Table 83. Staplex Total Suspended Particles (TSP) Monitor Product Offerings
Table 84. Staplex Total Suspended Particles (TSP) Monitor Sales (K Units), Revenue (US$, Mn) and Average Price (K US$/Unit) & (2020-2025)
Table 85. Staplex Key News & Latest Developments
Table 86. DustScan Company Summary
Table 87. DustScan Total Suspended Particles (TSP) Monitor Product Offerings
Table 88. DustScan Total Suspended Particles (TSP) Monitor Sales (K Units), Revenue (US$, Mn) and Average Price (K US$/Unit) & (2020-2025)
Table 89. DustScan Key News & Latest Developments
Table 90. ENVCO Company Summary
Table 91. ENVCO Total Suspended Particles (TSP) Monitor Product Offerings
Table 92. ENVCO Total Suspended Particles (TSP) Monitor Sales (K Units), Revenue (US$, Mn) and Average Price (K US$/Unit) & (2020-2025)
Table 93. ENVCO Key News & Latest Developments
Table 94. California Tech Zone Company Summary
Table 95. California Tech Zone Total Suspended Particles (TSP) Monitor Product Offerings
Table 96. California Tech Zone Total Suspended Particles (TSP) Monitor Sales (K Units), Revenue (US$, Mn) and Average Price (K US$/Unit) & (2020-2025)
Table 97. California Tech Zone Key News & Latest Developments
Table 98. Total Suspended Particles (TSP) Monitor Capacity of Key Manufacturers in Global Market, 2023-2025 (K Units)
Table 99. Global Total Suspended Particles (TSP) Monitor Capacity Market Share of Key Manufacturers, 2023-2025
Table 100. Global Total Suspended Particles (TSP) Monitor Production by Region, 2020-2025 (K Units)
Table 101. Global Total Suspended Particles (TSP) Monitor Production by Region, 2026-2032 (K Units)
Table 102. Total Suspended Particles (TSP) Monitor Market Opportunities & Trends in Global Market
Table 103. Total Suspended Particles (TSP) Monitor Market Drivers in Global Market
Table 104. Total Suspended Particles (TSP) Monitor Market Restraints in Global Market
Table 105. Total Suspended Particles (TSP) Monitor Raw Materials
Table 106. Total Suspended Particles (TSP) Monitor Raw Materials Suppliers in Global Market
Table 107. Typical Total Suspended Particles (TSP) Monitor Downstream
Table 108. Total Suspended Particles (TSP) Monitor Downstream Clients in Global Market
Table 109. Total Suspended Particles (TSP) Monitor Distributors and Sales Agents in Global Market

List of Figures
Figure 1. Total Suspended Particles (TSP) Monitor Product Picture
Figure 2. Total Suspended Particles (TSP) Monitor Segment by Type in 2024
Figure 3. Total Suspended Particles (TSP) Monitor Segment by Application in 2024
Figure 4. Global Total Suspended Particles (TSP) Monitor Market Overview: 2024
Figure 5. Key Caveats
Figure 6. Global Total Suspended Particles (TSP) Monitor Market Size: 2024 VS 2032 (US$, Mn)
Figure 7. Global Total Suspended Particles (TSP) Monitor Revenue: 2020-2032 (US$, Mn)
Figure 8. Total Suspended Particles (TSP) Monitor Sales in Global Market: 2020-2032 (K Units)
Figure 9. The Top 3 and 5 Players Market Share by Total Suspended Particles (TSP) Monitor Revenue in 2024
Figure 10. Segment by Type – Global Total Suspended Particles (TSP) Monitor Revenue, (US$, Mn), 2024 & 2032
Figure 11. Segment by Type – Global Total Suspended Particles (TSP) Monitor Revenue Market Share, 2020-2032
Figure 12. Segment by Type – Global Total Suspended Particles (TSP) Monitor Sales Market Share, 2020-2032
Figure 13. Segment by Type – Global Total Suspended Particles (TSP) Monitor Price (K US$/Unit), 2020-2032
Figure 14. Segment by Application – Global Total Suspended Particles (TSP) Monitor Revenue, (US$, Mn), 2024 & 2032
Figure 15. Segment by Application – Global Total Suspended Particles (TSP) Monitor Revenue Market Share, 2020-2032
Figure 16. Segment by Application – Global Total Suspended Particles (TSP) Monitor Sales Market Share, 2020-2032
Figure 17. Segment by Application -Global Total Suspended Particles (TSP) Monitor Price (K US$/Unit), 2020-2032
Figure 18. By Region – Global Total Suspended Particles (TSP) Monitor Revenue, (US$, Mn), 2025 & 2032
Figure 19. By Region – Global Total Suspended Particles (TSP) Monitor Revenue Market Share, 2020 VS 2024 VS 2032
Figure 20. By Region – Global Total Suspended Particles (TSP) Monitor Revenue Market Share, 2020-2032
Figure 21. By Region – Global Total Suspended Particles (TSP) Monitor Sales Market Share, 2020-2032
Figure 22. By Country – North America Total Suspended Particles (TSP) Monitor Revenue Market Share, 2020-2032
Figure 23. By Country – North America Total Suspended Particles (TSP) Monitor Sales Market Share, 2020-2032
Figure 24. United States Total Suspended Particles (TSP) Monitor Revenue, (US$, Mn), 2020-2032
Figure 25. Canada Total Suspended Particles (TSP) Monitor Revenue, (US$, Mn), 2020-2032
Figure 26. Mexico Total Suspended Particles (TSP) Monitor Revenue, (US$, Mn), 2020-2032
Figure 27. By Country – Europe Total Suspended Particles (TSP) Monitor Revenue Market Share, 2020-2032
Figure 28. By Country – Europe Total Suspended Particles (TSP) Monitor Sales Market Share, 2020-2032
Figure 29. Germany Total Suspended Particles (TSP) Monitor Revenue, (US$, Mn), 2020-2032
Figure 30. France Total Suspended Particles (TSP) Monitor Revenue, (US$, Mn), 2020-2032
Figure 31. U.K. Total Suspended Particles (TSP) Monitor Revenue, (US$, Mn), 2020-2032
Figure 32. Italy Total Suspended Particles (TSP) Monitor Revenue, (US$, Mn), 2020-2032
Figure 33. Russia Total Suspended Particles (TSP) Monitor Revenue, (US$, Mn), 2020-2032
Figure 34. Nordic Countries Total Suspended Particles (TSP) Monitor Revenue, (US$, Mn), 2020-2032
Figure 35. Benelux Total Suspended Particles (TSP) Monitor Revenue, (US$, Mn), 2020-2032
Figure 36. By Region – Asia Total Suspended Particles (TSP) Monitor Revenue Market Share, 2020-2032
Figure 37. By Region – Asia Total Suspended Particles (TSP) Monitor Sales Market Share, 2020-2032
Figure 38. China Total Suspended Particles (TSP) Monitor Revenue, (US$, Mn), 2020-2032
Figure 39. Japan Total Suspended Particles (TSP) Monitor Revenue, (US$, Mn), 2020-2032
Figure 40. South Korea Total Suspended Particles (TSP) Monitor Revenue, (US$, Mn), 2020-2032
Figure 41. Southeast Asia Total Suspended Particles (TSP) Monitor Revenue, (US$, Mn), 2020-2032
Figure 42. India Total Suspended Particles (TSP) Monitor Revenue, (US$, Mn), 2020-2032
Figure 43. By Country – South America Total Suspended Particles (TSP) Monitor Revenue Market Share, 2020-2032
Figure 44. By Country – South America Total Suspended Particles (TSP) Monitor Sales, Market Share, 2020-2032
Figure 45. Brazil Total Suspended Particles (TSP) Monitor Revenue, (US$, Mn), 2020-2032
Figure 46. Argentina Total Suspended Particles (TSP) Monitor Revenue, (US$, Mn), 2020-2032
Figure 47. By Country – Middle East & Africa Total Suspended Particles (TSP) Monitor Revenue, Market Share, 2020-2032
Figure 48. By Country – Middle East & Africa Total Suspended Particles (TSP) Monitor Sales, Market Share, 2020-2032
Figure 49. Turkey Total Suspended Particles (TSP) Monitor Revenue, (US$, Mn), 2020-2032
Figure 50. Israel Total Suspended Particles (TSP) Monitor Revenue, (US$, Mn), 2020-2032
Figure 51. Saudi Arabia Total Suspended Particles (TSP) Monitor Revenue, (US$, Mn), 2020-2032
Figure 52. UAE Total Suspended Particles (TSP) Monitor Revenue, (US$, Mn), 2020-2032
Figure 53. Global Total Suspended Particles (TSP) Monitor Production Capacity (K Units), 2020-2032
Figure 54. The Percentage of Production Total Suspended Particles (TSP) Monitor by Region, 2024 VS 2032
Figure 55. Total Suspended Particles (TSP) Monitor Industry Value Chain
Figure 56. Marketing Channels