Smart Home Occupancy Sensors Market, Size, Trends, Business Strategies 2025-2032

Global Smart Home Occupancy Sensors market size was estimated at USD 2278 million in 2023 and is projected to reach USD 4439.18 million by 2030, exhibiting a CAGR of 10.00% during the forecast period.

PDF Icon Download Sample Report PDF
  • Quick Dispatch

    All Orders

  • Secure Payment

    100% Secure Payment

Compare

$1,500.00$4,250.00

Clear

Smart Home Occupancy Sensors Market Overview

Vacancy sensors, also known as occupancy sensors, are electronic devices designed to detect the presence or absence of people within a specific area or space. These sensors are commonly used in lighting and HVAC (heating, ventilation, and air conditioning) systems to automatically control the operation of lighting, fans, and other devices based on occupancy status.

This report provides a deep insight into the global Smart Home Occupancy Sensors Market covering all its essential aspects. This ranges from a macro overview of the market to micro details of the market size, competitive landscape, development trend, niche market, key market drivers and challenges, SWOT analysis, value chain analysis, etc.

The analysis helps the reader to shape the competition within the industries and strategies for the competitive environment to enhance the potential profit. Furthermore, it provides a simple framework for evaluating and accessing the position of the business organization. The report structure also focuses on the competitive landscape of the Global Smart Home Occupancy Sensors Market, this report introduces in detail the market share, market performance, product situation, operation situation, etc. of the main players, which helps the readers in the industry to identify the main competitors and deeply understand the competition pattern of the market.
In a word, this report is a must-read for industry players, investors, researchers, consultants, business strategists, and all those who have any kind of stake or are planning to foray into the Smart Home Occupancy Sensors Market in any manner.

Smart Home Occupancy Sensors Market Analysis:

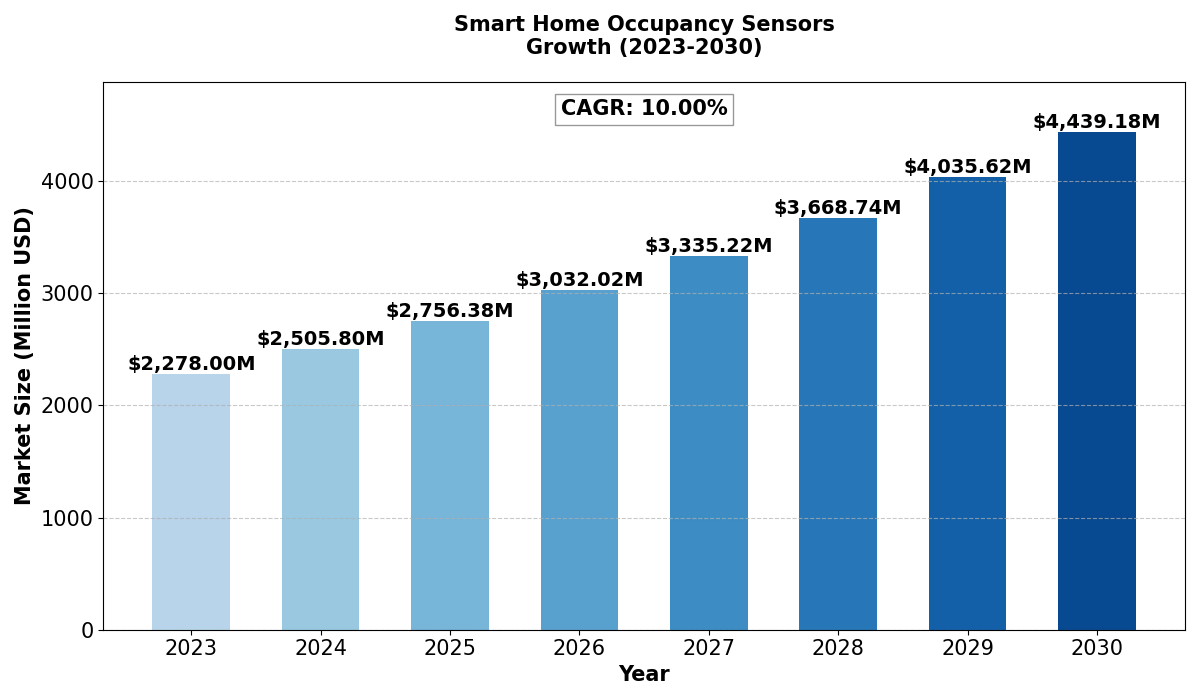
The global Smart Home Occupancy Sensors market size was estimated at USD 2278 million in 2023 and is projected to reach USD 4439.18 million by 2030, exhibiting a CAGR of 10.00% during the forecast period.

North America Smart Home Occupancy Sensors market size was USD 593.58 million in 2023, at a CAGR of 8.57% during the forecast period of 2025 through 2030.

Smart Home Occupancy Sensors Key Market Trends  :

  1. Integration with Smart Home Ecosystems
    Smart occupancy sensors are increasingly being integrated with home automation platforms such as Google Home, Amazon Alexa, and Apple HomeKit for seamless connectivity and control.

  2. Growing Demand for Energy Efficiency
    As homeowners seek to reduce energy consumption, occupancy sensors play a key role in automating lighting and HVAC systems to optimize power usage.

  3. Advancements in AI and Machine Learning
    AI-powered sensors can analyze occupancy patterns, differentiate between humans and pets, and adapt lighting or HVAC settings accordingly for improved efficiency and convenience.

  4. Rise in Wireless and IoT-Enabled Sensors
    Wireless and IoT-based occupancy sensors are gaining traction, offering easy installation and remote monitoring capabilities via smartphone apps.

  5. Enhanced Security and Surveillance Applications
    Occupancy sensors are increasingly being used in home security systems to detect unauthorized movement and trigger alerts or activate security cameras.

Smart Home Occupancy Sensors Market Regional Analysis :

semi insight

  • North America:Strong demand driven by EVs, 5G infrastructure, and renewable energy, with the U.S. leading the market.
  • Europe:Growth fueled by automotive electrification, renewable energy, and strong regulatory support, with Germany as a key player.
  • Asia-Pacific:Dominates the market due to large-scale manufacturing in China and Japan, with growing demand from EVs, 5G, and semiconductors.
  • South America:Emerging market, driven by renewable energy and EV adoption, with Brazil leading growth.
  • Middle East & Africa:Gradual growth, mainly due to investments in renewable energy and EV infrastructure, with Saudi Arabia and UAE as key contributors.

Smart Home Occupancy Sensors Market Segmentation :

The research report includes specific segments by region (country), manufacturers, Type, and Application. Market segmentation creates subsets of a market based on product type, end-user or application, Geographic, and other factors. By understanding the market segments, the decision-maker can leverage this targeting in the product, sales, and marketing strategies. Market segments can power your product development cycles by informing how you create product offerings for different segments.

Key Company

  • Signify
  • Schneider Electric
  • Honeywell
  • GE Current
  • Johnson Controls
  • Legrand
  • Crestron Electronics
  • Lutron Electronics
  • Acuity Brands
  • OPTEX
  • Leviton Manufacturing Co.
  • Inc
  • Enerlites
  • Hubbell
  • ATSS

Market Segmentation (by Type)

  • PIR Sensors
  • Ultrasonic Sensors
  • Dual-technology Occupancy Sensors
  • Others

Market Segmentation (by Application)

  • Lighting Systems
  • HVAC Systems
  • Security & Surveillance Systems
  • Others

Drivers

  • Booming Semiconductor and Electronics Industry
    The increasing demand for smartphones, tablets, wearables, and IoT devices is driving the need for high-precision Smart Home Occupancy Sensorss in wafer dicing and chip packaging.

  • Advancements in Semiconductor Packaging
    The shift toward advanced packaging technologies, such as 3D ICs and fan-out wafer-level packaging, is boosting the adoption of high-quality Smart Home Occupancy Sensorss.

  • Rising Demand in Industrial Electronics
    The expansion of industrial automation, medical devices, and automotive electronics is further supporting the market growth for Smart Home Occupancy Sensorss.

Restraints

  • High Costs of Advanced Smart Home Occupancy Sensorss
    Premium-quality Smart Home Occupancy Sensorss with enhanced properties, such as UV curable and conductive films, are expensive, limiting adoption among cost-sensitive manufacturers.

  • Stringent Regulations on Semiconductor Materials
    Environmental concerns and regulatory policies related to semiconductor manufacturing materials pose challenges to Smart Home Occupancy Sensors producers.

  • Complexity in Material Selection
    Different semiconductor applications require specific Smart Home Occupancy Sensors properties, making material selection complex and time-consuming for manufacturers.

Opportunities

  • Emerging 5G and AI Technologies
    The rise of 5G networks and artificial intelligence (AI) applications is creating new opportunities for Smart Home Occupancy Sensorss in high-performance semiconductor fabrication.

  • Expansion in Automotive Electronics
    The growing adoption of electric vehicles (EVs) and autonomous driving technologies is increasing the demand for Smart Home Occupancy Sensorss in power semiconductor manufacturing.

  • Development of UV Curable Smart Home Occupancy Sensorss
    UV curable films, which improve chip release properties and reduce contamination, are gaining traction in high-precision dicing applications.

Challenges

  • Fluctuations in Raw Material Prices
    Variability in the cost of raw materials, such as adhesives and polymers, can impact the overall pricing and profitability of Smart Home Occupancy Sensors manufacturers.

  • Competition from Alternative Dicing Methods
    Emerging dicing technologies, such as stealth dicing and plasma dicing, are reducing the reliance on traditional Smart Home Occupancy Sensorss in certain applications.

  • Quality Control and Consistency Issues
    Ensuring uniform adhesion, stress control, and defect-free Smart Home Occupancy Sensors production remains a challenge for manufacturers aiming to meet semiconductor industry standards.

Key Benefits of This Market Research:

  • Industry drivers, restraints, and opportunities covered in the study
  • Neutral perspective on the market performance
  • Recent industry trends and developments
  • Competitive landscape & strategies of key players
  • Potential & niche segments and regions exhibiting promising growth covered
  • Historical, current, and projected market size, in terms of value
  • In-depth analysis of the Smart Home Occupancy Sensors Market
  • Overview of the regional outlook of the Smart Home Occupancy Sensors Market:

Key Reasons to Buy this Report:

  • Access to date statistics compiled by our researchers. These provide you with historical and forecast data, which is analyzed to tell you why your market is set to change
  • This enables you to anticipate market changes to remain ahead of your competitors
  • You will be able to copy data from the Excel spreadsheet straight into your marketing plans, business presentations, or other strategic documents
  • The concise analysis, clear graph, and table format will enable you to pinpoint the information you require quickly
  • Provision of market value (USD Billion) data for each segment and sub-segment
  • Indicates the region and segment that is expected to witness the fastest growth as well as to dominate the market
  • Includes in-depth analysis of the market from various perspectives through Porters five forces analysis
  • Provides insight into the market through Value Chain
  • Market dynamics scenario, along with growth opportunities of the market in the years to come
  • 6-month post-sales analyst support

Customization of the Report
In case of any queries or customization requirements, please connect with our sales team, who will ensure that your requirements are met.

FAQs

What are the key driving factors and opportunities in the Smart Home Occupancy Sensors market?
The market is driven by increasing smart home adoption, energy conservation initiatives, and government regulations promoting energy efficiency. Opportunities exist in smart city projects, sensor technology advancements, and expansion in developing markets.


Which region is projected to have the largest share?
North America is expected to dominate the market due to high smart home penetration, government energy efficiency mandates, and increasing consumer demand for automation solutions.


Who are the top players in the global Smart Home Occupancy Sensors market?
Leading companies include Signify, Schneider Electric, Honeywell, GE Current, Johnson Controls, Legrand, Crestron Electronics, Lutron Electronics, and Acuity Brands.


What are the latest technological advancements in the industry?
Recent innovations include AI-driven motion detection, wireless and IoT-enabled sensors, and integration with smart home assistants like Amazon Alexa and Google Home.


What is the current size of the global Smart Home Occupancy Sensors market?
The market was valued at USD 2278 million in 2023 and is projected to reach USD 4439.18 million by 2030, growing at a CAGR of 10.00% during the forecast period.

Smart Home Occupancy Sensors Market, Size, Trends, Business Strategies 2025-2032

Get Sample Report PDF for Exclusive Insights

Report Sample Includes

  • Table of Contents
  • List of Tables & Figures
  • Charts, Research Methodology, and more...
PDF Icon Download Sample Report PDF

Download Sample Report

Table of Content

Table of Contents
1 Research Methodology and Statistical Scope
1.1 Market Definition and Statistical Scope of Smart Home Occupancy Sensors
1.2 Key Market Segments
1.2.1 Smart Home Occupancy Sensors Segment by Type
1.2.2 Smart Home Occupancy Sensors Segment by Application
1.3 Methodology & Sources of Information
1.3.1 Research Methodology
1.3.2 Research Process
1.3.3 Market Breakdown and Data Triangulation
1.3.4 Base Year
1.3.5 Report Assumptions & Caveats
2 Smart Home Occupancy Sensors Market Overview
2.1 Global Market Overview
2.1.1 Global Smart Home Occupancy Sensors Market Size (M USD) Estimates and Forecasts (2019-2030)
2.1.2 Global Smart Home Occupancy Sensors Sales Estimates and Forecasts (2019-2030)
2.2 Market Segment Executive Summary
2.3 Global Market Size by Region
3 Smart Home Occupancy Sensors Market Competitive Landscape
3.1 Global Smart Home Occupancy Sensors Sales by Manufacturers (2019-2025)
3.2 Global Smart Home Occupancy Sensors Revenue Market Share by Manufacturers (2019-2025)
3.3 Smart Home Occupancy Sensors Market Share by Company Type (Tier 1, Tier 2, and Tier 3)
3.4 Global Smart Home Occupancy Sensors Average Price by Manufacturers (2019-2025)
3.5 Manufacturers Smart Home Occupancy Sensors Sales Sites, Area Served, Product Type
3.6 Smart Home Occupancy Sensors Market Competitive Situation and Trends
3.6.1 Smart Home Occupancy Sensors Market Concentration Rate
3.6.2 Global 5 and 10 Largest Smart Home Occupancy Sensors Players Market Share by Revenue
3.6.3 Mergers & Acquisitions, Expansion
4 Smart Home Occupancy Sensors Industry Chain Analysis
4.1 Smart Home Occupancy Sensors Industry Chain Analysis
4.2 Market Overview of Key Raw Materials
4.3 Midstream Market Analysis
4.4 Downstream Customer Analysis
5 The Development and Dynamics of Smart Home Occupancy Sensors Market
5.1 Key Development Trends
5.2 Driving Factors
5.3 Market Challenges
5.4 Market Restraints
5.5 Industry News
5.5.1 New Product Developments
5.5.2 Mergers & Acquisitions
5.5.3 Expansions
5.5.4 Collaboration/Supply Contracts
5.6 Industry Policies
6 Smart Home Occupancy Sensors Market Segmentation by Type
6.1 Evaluation Matrix of Segment Market Development Potential (Type)
6.2 Global Smart Home Occupancy Sensors Sales Market Share by Type (2019-2025)
6.3 Global Smart Home Occupancy Sensors Market Size Market Share by Type (2019-2025)
6.4 Global Smart Home Occupancy Sensors Price by Type (2019-2025)
7 Smart Home Occupancy Sensors Market Segmentation by Application
7.1 Evaluation Matrix of Segment Market Development Potential (Application)
7.2 Global Smart Home Occupancy Sensors Market Sales by Application (2019-2025)
7.3 Global Smart Home Occupancy Sensors Market Size (M USD) by Application (2019-2025)
7.4 Global Smart Home Occupancy Sensors Sales Growth Rate by Application (2019-2025)
8 Smart Home Occupancy Sensors Market Segmentation by Region
8.1 Global Smart Home Occupancy Sensors Sales by Region
8.1.1 Global Smart Home Occupancy Sensors Sales by Region
8.1.2 Global Smart Home Occupancy Sensors Sales Market Share by Region
8.2 North America
8.2.1 North America Smart Home Occupancy Sensors Sales by Country
8.2.2 U.S.
8.2.3 Canada
8.2.4 Mexico
8.3 Europe
8.3.1 Europe Smart Home Occupancy Sensors Sales by Country
8.3.2 Germany
8.3.3 France
8.3.4 U.K.
8.3.5 Italy
8.3.6 Russia
8.4 Asia Pacific
8.4.1 Asia Pacific Smart Home Occupancy Sensors Sales by Region
8.4.2 China
8.4.3 Japan
8.4.4 South Korea
8.4.5 India
8.4.6 Southeast Asia
8.5 South America
8.5.1 South America Smart Home Occupancy Sensors Sales by Country
8.5.2 Brazil
8.5.3 Argentina
8.5.4 Columbia
8.6 Middle East and Africa
8.6.1 Middle East and Africa Smart Home Occupancy Sensors Sales by Region
8.6.2 Saudi Arabia
8.6.3 UAE
8.6.4 Egypt
8.6.5 Nigeria
8.6.6 South Africa
9 Key Companies Profile
9.1 Signify
9.1.1 Signify Smart Home Occupancy Sensors Basic Information
9.1.2 Signify Smart Home Occupancy Sensors Product Overview
9.1.3 Signify Smart Home Occupancy Sensors Product Market Performance
9.1.4 Signify Business Overview
9.1.5 Signify Smart Home Occupancy Sensors SWOT Analysis
9.1.6 Signify Recent Developments
9.2 Schneider Electric
9.2.1 Schneider Electric Smart Home Occupancy Sensors Basic Information
9.2.2 Schneider Electric Smart Home Occupancy Sensors Product Overview
9.2.3 Schneider Electric Smart Home Occupancy Sensors Product Market Performance
9.2.4 Schneider Electric Business Overview
9.2.5 Schneider Electric Smart Home Occupancy Sensors SWOT Analysis
9.2.6 Schneider Electric Recent Developments
9.3 Honeywell
9.3.1 Honeywell Smart Home Occupancy Sensors Basic Information
9.3.2 Honeywell Smart Home Occupancy Sensors Product Overview
9.3.3 Honeywell Smart Home Occupancy Sensors Product Market Performance
9.3.4 Honeywell Smart Home Occupancy Sensors SWOT Analysis
9.3.5 Honeywell Business Overview
9.3.6 Honeywell Recent Developments
9.4 GE Current
9.4.1 GE Current Smart Home Occupancy Sensors Basic Information
9.4.2 GE Current Smart Home Occupancy Sensors Product Overview
9.4.3 GE Current Smart Home Occupancy Sensors Product Market Performance
9.4.4 GE Current Business Overview
9.4.5 GE Current Recent Developments
9.5 Johnson Controls
9.5.1 Johnson Controls Smart Home Occupancy Sensors Basic Information
9.5.2 Johnson Controls Smart Home Occupancy Sensors Product Overview
9.5.3 Johnson Controls Smart Home Occupancy Sensors Product Market Performance
9.5.4 Johnson Controls Business Overview
9.5.5 Johnson Controls Recent Developments
9.6 Legrand
9.6.1 Legrand Smart Home Occupancy Sensors Basic Information
9.6.2 Legrand Smart Home Occupancy Sensors Product Overview
9.6.3 Legrand Smart Home Occupancy Sensors Product Market Performance
9.6.4 Legrand Business Overview
9.6.5 Legrand Recent Developments
9.7 Crestron Electronics
9.7.1 Crestron Electronics Smart Home Occupancy Sensors Basic Information
9.7.2 Crestron Electronics Smart Home Occupancy Sensors Product Overview
9.7.3 Crestron Electronics Smart Home Occupancy Sensors Product Market Performance
9.7.4 Crestron Electronics Business Overview
9.7.5 Crestron Electronics Recent Developments
9.8 Lutron Electronics
9.8.1 Lutron Electronics Smart Home Occupancy Sensors Basic Information
9.8.2 Lutron Electronics Smart Home Occupancy Sensors Product Overview
9.8.3 Lutron Electronics Smart Home Occupancy Sensors Product Market Performance
9.8.4 Lutron Electronics Business Overview
9.8.5 Lutron Electronics Recent Developments
9.9 Acuity Brands
9.9.1 Acuity Brands Smart Home Occupancy Sensors Basic Information
9.9.2 Acuity Brands Smart Home Occupancy Sensors Product Overview
9.9.3 Acuity Brands Smart Home Occupancy Sensors Product Market Performance
9.9.4 Acuity Brands Business Overview
9.9.5 Acuity Brands Recent Developments
9.10 OPTEX
9.10.1 OPTEX Smart Home Occupancy Sensors Basic Information
9.10.2 OPTEX Smart Home Occupancy Sensors Product Overview
9.10.3 OPTEX Smart Home Occupancy Sensors Product Market Performance
9.10.4 OPTEX Business Overview
9.10.5 OPTEX Recent Developments
9.11 Leviton Manufacturing Co.
9.11.1 Leviton Manufacturing Co. Smart Home Occupancy Sensors Basic Information
9.11.2 Leviton Manufacturing Co. Smart Home Occupancy Sensors Product Overview
9.11.3 Leviton Manufacturing Co. Smart Home Occupancy Sensors Product Market Performance
9.11.4 Leviton Manufacturing Co. Business Overview
9.11.5 Leviton Manufacturing Co. Recent Developments
9.12 Inc
9.12.1 Inc Smart Home Occupancy Sensors Basic Information
9.12.2 Inc Smart Home Occupancy Sensors Product Overview
9.12.3 Inc Smart Home Occupancy Sensors Product Market Performance
9.12.4 Inc Business Overview
9.12.5 Inc Recent Developments
9.13 Enerlites
9.13.1 Enerlites Smart Home Occupancy Sensors Basic Information
9.13.2 Enerlites Smart Home Occupancy Sensors Product Overview
9.13.3 Enerlites Smart Home Occupancy Sensors Product Market Performance
9.13.4 Enerlites Business Overview
9.13.5 Enerlites Recent Developments
9.14 Hubbell
9.14.1 Hubbell Smart Home Occupancy Sensors Basic Information
9.14.2 Hubbell Smart Home Occupancy Sensors Product Overview
9.14.3 Hubbell Smart Home Occupancy Sensors Product Market Performance
9.14.4 Hubbell Business Overview
9.14.5 Hubbell Recent Developments
9.15 ATSS
9.15.1 ATSS Smart Home Occupancy Sensors Basic Information
9.15.2 ATSS Smart Home Occupancy Sensors Product Overview
9.15.3 ATSS Smart Home Occupancy Sensors Product Market Performance
9.15.4 ATSS Business Overview
9.15.5 ATSS Recent Developments
10 Smart Home Occupancy Sensors Market Forecast by Region
10.1 Global Smart Home Occupancy Sensors Market Size Forecast
10.2 Global Smart Home Occupancy Sensors Market Forecast by Region
10.2.1 North America Market Size Forecast by Country
10.2.2 Europe Smart Home Occupancy Sensors Market Size Forecast by Country
10.2.3 Asia Pacific Smart Home Occupancy Sensors Market Size Forecast by Region
10.2.4 South America Smart Home Occupancy Sensors Market Size Forecast by Country
10.2.5 Middle East and Africa Forecasted Consumption of Smart Home Occupancy Sensors by Country
11 Forecast Market by Type and by Application (2025-2030)
11.1 Global Smart Home Occupancy Sensors Market Forecast by Type (2025-2030)
11.1.1 Global Forecasted Sales of Smart Home Occupancy Sensors by Type (2025-2030)
11.1.2 Global Smart Home Occupancy Sensors Market Size Forecast by Type (2025-2030)
11.1.3 Global Forecasted Price of Smart Home Occupancy Sensors by Type (2025-2030)
11.2 Global Smart Home Occupancy Sensors Market Forecast by Application (2025-2030)
11.2.1 Global Smart Home Occupancy Sensors Sales (K Units) Forecast by Application
11.2.2 Global Smart Home Occupancy Sensors Market Size (M USD) Forecast by Application (2025-2030)
12 Conclusion and Key FindingsList of Tables
Table 1. Introduction of the Type
Table 2. Introduction of the Application
Table 3. Market Size (M USD) Segment Executive Summary
Table 4. Smart Home Occupancy Sensors Market Size Comparison by Region (M USD)
Table 5. Global Smart Home Occupancy Sensors Sales (K Units) by Manufacturers (2019-2025)
Table 6. Global Smart Home Occupancy Sensors Sales Market Share by Manufacturers (2019-2025)
Table 7. Global Smart Home Occupancy Sensors Revenue (M USD) by Manufacturers (2019-2025)
Table 8. Global Smart Home Occupancy Sensors Revenue Share by Manufacturers (2019-2025)
Table 9. Company Type (Tier 1, Tier 2, and Tier 3) & (based on the Revenue in Smart Home Occupancy Sensors as of 2022)
Table 10. Global Market Smart Home Occupancy Sensors Average Price (USD/Unit) of Key Manufacturers (2019-2025)
Table 11. Manufacturers Smart Home Occupancy Sensors Sales Sites and Area Served
Table 12. Manufacturers Smart Home Occupancy Sensors Product Type
Table 13. Global Smart Home Occupancy Sensors Manufacturers Market Concentration Ratio (CR5 and HHI)
Table 14. Mergers & Acquisitions, Expansion Plans
Table 15. Industry Chain Map of Smart Home Occupancy Sensors
Table 16. Market Overview of Key Raw Materials
Table 17. Midstream Market Analysis
Table 18. Downstream Customer Analysis
Table 19. Key Development Trends
Table 20. Driving Factors
Table 21. Smart Home Occupancy Sensors Market Challenges
Table 22. Global Smart Home Occupancy Sensors Sales by Type (K Units)
Table 23. Global Smart Home Occupancy Sensors Market Size by Type (M USD)
Table 24. Global Smart Home Occupancy Sensors Sales (K Units) by Type (2019-2025)
Table 25. Global Smart Home Occupancy Sensors Sales Market Share by Type (2019-2025)
Table 26. Global Smart Home Occupancy Sensors Market Size (M USD) by Type (2019-2025)
Table 27. Global Smart Home Occupancy Sensors Market Size Share by Type (2019-2025)
Table 28. Global Smart Home Occupancy Sensors Price (USD/Unit) by Type (2019-2025)
Table 29. Global Smart Home Occupancy Sensors Sales (K Units) by Application
Table 30. Global Smart Home Occupancy Sensors Market Size by Application
Table 31. Global Smart Home Occupancy Sensors Sales by Application (2019-2025) & (K Units)
Table 32. Global Smart Home Occupancy Sensors Sales Market Share by Application (2019-2025)
Table 33. Global Smart Home Occupancy Sensors Sales by Application (2019-2025) & (M USD)
Table 34. Global Smart Home Occupancy Sensors Market Share by Application (2019-2025)
Table 35. Global Smart Home Occupancy Sensors Sales Growth Rate by Application (2019-2025)
Table 36. Global Smart Home Occupancy Sensors Sales by Region (2019-2025) & (K Units)
Table 37. Global Smart Home Occupancy Sensors Sales Market Share by Region (2019-2025)
Table 38. North America Smart Home Occupancy Sensors Sales by Country (2019-2025) & (K Units)
Table 39. Europe Smart Home Occupancy Sensors Sales by Country (2019-2025) & (K Units)
Table 40. Asia Pacific Smart Home Occupancy Sensors Sales by Region (2019-2025) & (K Units)
Table 41. South America Smart Home Occupancy Sensors Sales by Country (2019-2025) & (K Units)
Table 42. Middle East and Africa Smart Home Occupancy Sensors Sales by Region (2019-2025) & (K Units)
Table 43. Signify Smart Home Occupancy Sensors Basic Information
Table 44. Signify Smart Home Occupancy Sensors Product Overview
Table 45. Signify Smart Home Occupancy Sensors Sales (K Units), Revenue (M USD), Price (USD/Unit) and Gross Margin (2019-2025)
Table 46. Signify Business Overview
Table 47. Signify Smart Home Occupancy Sensors SWOT Analysis
Table 48. Signify Recent Developments
Table 49. Schneider Electric Smart Home Occupancy Sensors Basic Information
Table 50. Schneider Electric Smart Home Occupancy Sensors Product Overview
Table 51. Schneider Electric Smart Home Occupancy Sensors Sales (K Units), Revenue (M USD), Price (USD/Unit) and Gross Margin (2019-2025)
Table 52. Schneider Electric Business Overview
Table 53. Schneider Electric Smart Home Occupancy Sensors SWOT Analysis
Table 54. Schneider Electric Recent Developments
Table 55. Honeywell Smart Home Occupancy Sensors Basic Information
Table 56. Honeywell Smart Home Occupancy Sensors Product Overview
Table 57. Honeywell Smart Home Occupancy Sensors Sales (K Units), Revenue (M USD), Price (USD/Unit) and Gross Margin (2019-2025)
Table 58. Honeywell Smart Home Occupancy Sensors SWOT Analysis
Table 59. Honeywell Business Overview
Table 60. Honeywell Recent Developments
Table 61. GE Current Smart Home Occupancy Sensors Basic Information
Table 62. GE Current Smart Home Occupancy Sensors Product Overview
Table 63. GE Current Smart Home Occupancy Sensors Sales (K Units), Revenue (M USD), Price (USD/Unit) and Gross Margin (2019-2025)
Table 64. GE Current Business Overview
Table 65. GE Current Recent Developments
Table 66. Johnson Controls Smart Home Occupancy Sensors Basic Information
Table 67. Johnson Controls Smart Home Occupancy Sensors Product Overview
Table 68. Johnson Controls Smart Home Occupancy Sensors Sales (K Units), Revenue (M USD), Price (USD/Unit) and Gross Margin (2019-2025)
Table 69. Johnson Controls Business Overview
Table 70. Johnson Controls Recent Developments
Table 71. Legrand Smart Home Occupancy Sensors Basic Information
Table 72. Legrand Smart Home Occupancy Sensors Product Overview
Table 73. Legrand Smart Home Occupancy Sensors Sales (K Units), Revenue (M USD), Price (USD/Unit) and Gross Margin (2019-2025)
Table 74. Legrand Business Overview
Table 75. Legrand Recent Developments
Table 76. Crestron Electronics Smart Home Occupancy Sensors Basic Information
Table 77. Crestron Electronics Smart Home Occupancy Sensors Product Overview
Table 78. Crestron Electronics Smart Home Occupancy Sensors Sales (K Units), Revenue (M USD), Price (USD/Unit) and Gross Margin (2019-2025)
Table 79. Crestron Electronics Business Overview
Table 80. Crestron Electronics Recent Developments
Table 81. Lutron Electronics Smart Home Occupancy Sensors Basic Information
Table 82. Lutron Electronics Smart Home Occupancy Sensors Product Overview
Table 83. Lutron Electronics Smart Home Occupancy Sensors Sales (K Units), Revenue (M USD), Price (USD/Unit) and Gross Margin (2019-2025)
Table 84. Lutron Electronics Business Overview
Table 85. Lutron Electronics Recent Developments
Table 86. Acuity Brands Smart Home Occupancy Sensors Basic Information
Table 87. Acuity Brands Smart Home Occupancy Sensors Product Overview
Table 88. Acuity Brands Smart Home Occupancy Sensors Sales (K Units), Revenue (M USD), Price (USD/Unit) and Gross Margin (2019-2025)
Table 89. Acuity Brands Business Overview
Table 90. Acuity Brands Recent Developments
Table 91. OPTEX Smart Home Occupancy Sensors Basic Information
Table 92. OPTEX Smart Home Occupancy Sensors Product Overview
Table 93. OPTEX Smart Home Occupancy Sensors Sales (K Units), Revenue (M USD), Price (USD/Unit) and Gross Margin (2019-2025)
Table 94. OPTEX Business Overview
Table 95. OPTEX Recent Developments
Table 96. Leviton Manufacturing Co. Smart Home Occupancy Sensors Basic Information
Table 97. Leviton Manufacturing Co. Smart Home Occupancy Sensors Product Overview
Table 98. Leviton Manufacturing Co. Smart Home Occupancy Sensors Sales (K Units), Revenue (M USD), Price (USD/Unit) and Gross Margin (2019-2025)
Table 99. Leviton Manufacturing Co. Business Overview
Table 100. Leviton Manufacturing Co. Recent Developments
Table 101. Inc Smart Home Occupancy Sensors Basic Information
Table 102. Inc Smart Home Occupancy Sensors Product Overview
Table 103. Inc Smart Home Occupancy Sensors Sales (K Units), Revenue (M USD), Price (USD/Unit) and Gross Margin (2019-2025)
Table 104. Inc Business Overview
Table 105. Inc Recent Developments
Table 106. Enerlites Smart Home Occupancy Sensors Basic Information
Table 107. Enerlites Smart Home Occupancy Sensors Product Overview
Table 108. Enerlites Smart Home Occupancy Sensors Sales (K Units), Revenue (M USD), Price (USD/Unit) and Gross Margin (2019-2025)
Table 109. Enerlites Business Overview
Table 110. Enerlites Recent Developments
Table 111. Hubbell Smart Home Occupancy Sensors Basic Information
Table 112. Hubbell Smart Home Occupancy Sensors Product Overview
Table 113. Hubbell Smart Home Occupancy Sensors Sales (K Units), Revenue (M USD), Price (USD/Unit) and Gross Margin (2019-2025)
Table 114. Hubbell Business Overview
Table 115. Hubbell Recent Developments
Table 116. ATSS Smart Home Occupancy Sensors Basic Information
Table 117. ATSS Smart Home Occupancy Sensors Product Overview
Table 118. ATSS Smart Home Occupancy Sensors Sales (K Units), Revenue (M USD), Price (USD/Unit) and Gross Margin (2019-2025)
Table 119. ATSS Business Overview
Table 120. ATSS Recent Developments
Table 121. Global Smart Home Occupancy Sensors Sales Forecast by Region (2025-2030) & (K Units)
Table 122. Global Smart Home Occupancy Sensors Market Size Forecast by Region (2025-2030) & (M USD)
Table 123. North America Smart Home Occupancy Sensors Sales Forecast by Country (2025-2030) & (K Units)
Table 124. North America Smart Home Occupancy Sensors Market Size Forecast by Country (2025-2030) & (M USD)
Table 125. Europe Smart Home Occupancy Sensors Sales Forecast by Country (2025-2030) & (K Units)
Table 126. Europe Smart Home Occupancy Sensors Market Size Forecast by Country (2025-2030) & (M USD)
Table 127. Asia Pacific Smart Home Occupancy Sensors Sales Forecast by Region (2025-2030) & (K Units)
Table 128. Asia Pacific Smart Home Occupancy Sensors Market Size Forecast by Region (2025-2030) & (M USD)
Table 129. South America Smart Home Occupancy Sensors Sales Forecast by Country (2025-2030) & (K Units)
Table 130. South America Smart Home Occupancy Sensors Market Size Forecast by Country (2025-2030) & (M USD)
Table 131. Middle East and Africa Smart Home Occupancy Sensors Consumption Forecast by Country (2025-2030) & (Units)
Table 132. Middle East and Africa Smart Home Occupancy Sensors Market Size Forecast by Country (2025-2030) & (M USD)
Table 133. Global Smart Home Occupancy Sensors Sales Forecast by Type (2025-2030) & (K Units)
Table 134. Global Smart Home Occupancy Sensors Market Size Forecast by Type (2025-2030) & (M USD)
Table 135. Global Smart Home Occupancy Sensors Price Forecast by Type (2025-2030) & (USD/Unit)
Table 136. Global Smart Home Occupancy Sensors Sales (K Units) Forecast by Application (2025-2030)
Table 137. Global Smart Home Occupancy Sensors Market Size Forecast by Application (2025-2030) & (M USD)
List of Figures
Figure 1. Product Picture of Smart Home Occupancy Sensors
Figure 2. Data Triangulation
Figure 3. Key Caveats
Figure 4. Global Smart Home Occupancy Sensors Market Size (M USD), 2019-2030
Figure 5. Global Smart Home Occupancy Sensors Market Size (M USD) (2019-2030)
Figure 6. Global Smart Home Occupancy Sensors Sales (K Units) & (2019-2030)
Figure 7. Evaluation Matrix of Segment Market Development Potential (Type)
Figure 8. Evaluation Matrix of Segment Market Development Potential (Application)
Figure 9. Evaluation Matrix of Regional Market Development Potential
Figure 10. Smart Home Occupancy Sensors Market Size by Country (M USD)
Figure 11. Smart Home Occupancy Sensors Sales Share by Manufacturers in 2023
Figure 12. Global Smart Home Occupancy Sensors Revenue Share by Manufacturers in 2023
Figure 13. Smart Home Occupancy Sensors Market Share by Company Type (Tier 1, Tier 2 and Tier 3): 2023
Figure 14. Global Market Smart Home Occupancy Sensors Average Price (USD/Unit) of Key Manufacturers in 2023
Figure 15. The Global 5 and 10 Largest Players: Market Share by Smart Home Occupancy Sensors Revenue in 2023
Figure 16. Evaluation Matrix of Segment Market Development Potential (Type)
Figure 17. Global Smart Home Occupancy Sensors Market Share by Type
Figure 18. Sales Market Share of Smart Home Occupancy Sensors by Type (2019-2025)
Figure 19. Sales Market Share of Smart Home Occupancy Sensors by Type in 2023
Figure 20. Market Size Share of Smart Home Occupancy Sensors by Type (2019-2025)
Figure 21. Market Size Market Share of Smart Home Occupancy Sensors by Type in 2023
Figure 22. Evaluation Matrix of Segment Market Development Potential (Application)
Figure 23. Global Smart Home Occupancy Sensors Market Share by Application
Figure 24. Global Smart Home Occupancy Sensors Sales Market Share by Application (2019-2025)
Figure 25. Global Smart Home Occupancy Sensors Sales Market Share by Application in 2023
Figure 26. Global Smart Home Occupancy Sensors Market Share by Application (2019-2025)
Figure 27. Global Smart Home Occupancy Sensors Market Share by Application in 2023
Figure 28. Global Smart Home Occupancy Sensors Sales Growth Rate by Application (2019-2025)
Figure 29. Global Smart Home Occupancy Sensors Sales Market Share by Region (2019-2025)
Figure 30. North America Smart Home Occupancy Sensors Sales and Growth Rate (2019-2025) & (K Units)
Figure 31. North America Smart Home Occupancy Sensors Sales Market Share by Country in 2023
Figure 32. U.S. Smart Home Occupancy Sensors Sales and Growth Rate (2019-2025) & (K Units)
Figure 33. Canada Smart Home Occupancy Sensors Sales (K Units) and Growth Rate (2019-2025)
Figure 34. Mexico Smart Home Occupancy Sensors Sales (Units) and Growth Rate (2019-2025)
Figure 35. Europe Smart Home Occupancy Sensors Sales and Growth Rate (2019-2025) & (K Units)
Figure 36. Europe Smart Home Occupancy Sensors Sales Market Share by Country in 2023
Figure 37. Germany Smart Home Occupancy Sensors Sales and Growth Rate (2019-2025) & (K Units)
Figure 38. France Smart Home Occupancy Sensors Sales and Growth Rate (2019-2025) & (K Units)
Figure 39. U.K. Smart Home Occupancy Sensors Sales and Growth Rate (2019-2025) & (K Units)
Figure 40. Italy Smart Home Occupancy Sensors Sales and Growth Rate (2019-2025) & (K Units)
Figure 41. Russia Smart Home Occupancy Sensors Sales and Growth Rate (2019-2025) & (K Units)
Figure 42. Asia Pacific Smart Home Occupancy Sensors Sales and Growth Rate (K Units)
Figure 43. Asia Pacific Smart Home Occupancy Sensors Sales Market Share by Region in 2023
Figure 44. China Smart Home Occupancy Sensors Sales and Growth Rate (2019-2025) & (K Units)
Figure 45. Japan Smart Home Occupancy Sensors Sales and Growth Rate (2019-2025) & (K Units)
Figure 46. South Korea Smart Home Occupancy Sensors Sales and Growth Rate (2019-2025) & (K Units)
Figure 47. India Smart Home Occupancy Sensors Sales and Growth Rate (2019-2025) & (K Units)
Figure 48. Southeast Asia Smart Home Occupancy Sensors Sales and Growth Rate (2019-2025) & (K Units)
Figure 49. South America Smart Home Occupancy Sensors Sales and Growth Rate (K Units)
Figure 50. South America Smart Home Occupancy Sensors Sales Market Share by Country in 2023
Figure 51. Brazil Smart Home Occupancy Sensors Sales and Growth Rate (2019-2025) & (K Units)
Figure 52. Argentina Smart Home Occupancy Sensors Sales and Growth Rate (2019-2025) & (K Units)
Figure 53. Columbia Smart Home Occupancy Sensors Sales and Growth Rate (2019-2025) & (K Units)
Figure 54. Middle East and Africa Smart Home Occupancy Sensors Sales and Growth Rate (K Units)
Figure 55. Middle East and Africa Smart Home Occupancy Sensors Sales Market Share by Region in 2023
Figure 56. Saudi Arabia Smart Home Occupancy Sensors Sales and Growth Rate (2019-2025) & (K Units)
Figure 57. UAE Smart Home Occupancy Sensors Sales and Growth Rate (2019-2025) & (K Units)
Figure 58. Egypt Smart Home Occupancy Sensors Sales and Growth Rate (2019-2025) & (K Units)
Figure 59. Nigeria Smart Home Occupancy Sensors Sales and Growth Rate (2019-2025) & (K Units)
Figure 60. South Africa Smart Home Occupancy Sensors Sales and Growth Rate (2019-2025) & (K Units)
Figure 61. Global Smart Home Occupancy Sensors Sales Forecast by Volume (2019-2030) & (K Units)
Figure 62. Global Smart Home Occupancy Sensors Market Size Forecast by Value (2019-2030) & (M USD)
Figure 63. Global Smart Home Occupancy Sensors Sales Market Share Forecast by Type (2025-2030)
Figure 64. Global Smart Home Occupancy Sensors Market Share Forecast by Type (2025-2030)
Figure 65. Global Smart Home Occupancy Sensors Sales Forecast by Application (2025-2030)
Figure 66. Global Smart Home Occupancy Sensors Market Share Forecast by Application (2025-2030)