Smart Card Interface Market Overview
The Smart Card Interface provides a communication interface to a Smart Card.
This report provides a deep insight into the global Smart Card Interface market covering all its essential aspects. This ranges from a macro overview of the market to micro details of the market size, competitive landscape, development trend, niche market, key market drivers and challenges, SWOT analysis, value chain analysis, etc.
The analysis helps the reader to shape the competition within the industries and strategies for the competitive environment to enhance the potential profit. Furthermore, it provides a simple framework for evaluating and accessing the position of the business organization. The report structure also focuses on the competitive landscape of the Global Smart Card Interface Market, this report introduces in detail the market share, market performance, product situation, operation situation, etc. of the main players, which helps the readers in the industry to identify the main competitors and deeply understand the competition pattern of the market.
In a word, this report is a must-read for industry players, investors, researchers, consultants, business strategists, and all those who have any kind of stake or are planning to foray into the Smart Card Interface market in any manner.
Smart Card Interface Market Analysis:
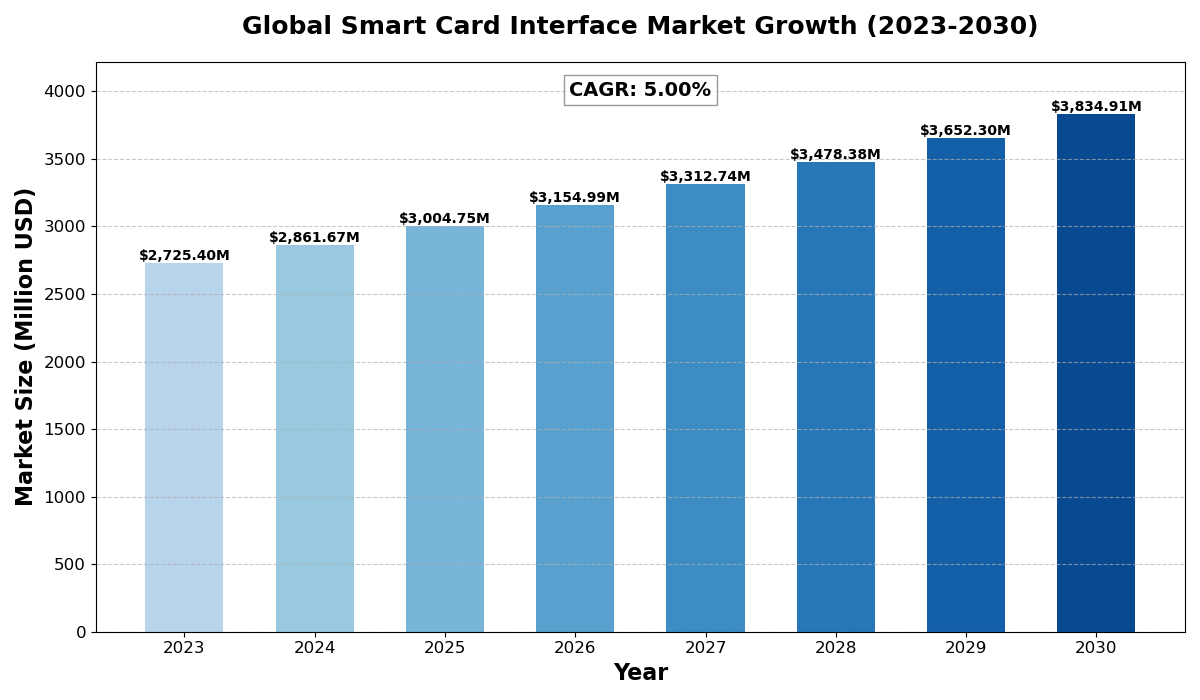
The global Smart Card Interface Market size was estimated at USD 2725.40 million in 2023 and is projected to reach USD 3834.91 million by 2030, exhibiting a CAGR of 5.00% during the forecast period.
North America Smart Card Interface market size was USD 710.16 million in 2023, at a CAGR of 4.29% during the forecast period of 2025 through 2030.
Smart Card Interface Key Market Trends :
- Growing Adoption in Banking and Finance
The demand for secure payment solutions is increasing, leading to the widespread use of Smart Card Interfaces in banking, ATM networks, and POS terminals. - Advancements in Contactless Technology
The rise of NFC and RFID-based contactless payments is pushing the growth of Smart Card Interface technology, enhancing convenience and security. - Integration with IoT and AI
Smart Cards are being integrated with IoT and AI-based applications for enhanced authentication, access control, and data security. - Regulatory Compliance and Security Enhancements
Governments and organizations are implementing stringent security regulations, driving the adoption of high-security Smart Card Interfaces. - Increasing Demand in Telecom and Healthcare
Smart Cards are being widely used in telecommunications (SIM cards) and healthcare (e-health cards) for secure identity verification and data storage.
Smart Card Interface Market Regional Analysis :

-
North America:
Strong demand driven by EVs, 5G infrastructure, and renewable energy, with the U.S. leading the market.
-
Europe:
Growth fueled by automotive electrification, renewable energy, and strong regulatory support, with Germany as a key player.
-
Asia-Pacific:
Dominates the market due to large-scale manufacturing in China and Japan, with growing demand from EVs, 5G, and semiconductors.
-
South America:
Emerging market, driven by renewable energy and EV adoption, with Brazil leading growth.
-
Middle East & Africa:
Gradual growth, mainly due to investments in renewable energy and EV infrastructure, with Saudi Arabia and UAE as key contributors.
Smart Card Interface Market Segmentation :
The research report includes specific segments by region (country), manufacturers, Type, and Application. Market segmentation creates subsets of a market based on product type, end-user or application, Geographic, and other factors. By understanding the market segments, the decision-maker can leverage this targeting in the product, sales, and marketing strategies. Market segments can power your product development cycles by informing how you create product offerings for different segments.
Key Company
- STMicroelectronics
- Maxim
- ON Semiconductor
- Silvaco
- Analog
- TI
- Microchip Technology
- NXP
- Infineon
- 5.0V ±5%, 80mA (max)
- 3.0V ±8%, 65mA (max)
- 1.8V ±10%, 30mA (max)
- Access Control
- Automated Teller Machines
- Banking Applications
- Debit/Credit Payment Terminals
- Pay/Premium Television
- PIN Pads
- POS Terminals
- Telecommunications
Drivers
- Rising Digital Transactions
The global shift towards cashless payments is boosting the adoption of Smart Card Interfaces in financial services and retail sectors. - Government Initiatives for Secure Identification
Many countries are deploying Smart Card-based national ID programs, driving demand for advanced card interfaces. - Expansion of IoT Devices
Smart Card Interfaces are crucial for secure authentication in IoT-connected devices, leading to increased market adoption.
Restraints
- High Initial Deployment Costs
Implementing Smart Card Interface solutions requires significant investment, limiting adoption among small businesses. - Compatibility Issues with Legacy Systems
Integration challenges with existing infrastructure may slow down market penetration. - Cybersecurity Threats
Growing concerns over data breaches and hacking incidents pose a challenge to Smart Card Interface security.
Opportunities
- Emerging Markets Expansion
Developing regions offer significant growth potential due to rising digital transformation initiatives. - Advancements in Biometric Authentication
The integration of fingerprint and facial recognition with Smart Card technology is expected to boost demand. - Growth in E-Governance Applications
Smart Card Interfaces are being increasingly used in e-passports, healthcare, and transportation systems, creating new opportunities.
Challenges
- Rapid Technological Changes
The fast-evolving technology landscape requires continuous updates and innovation in Smart Card Interface systems. - Stringent Regulatory Requirements
Compliance with data protection laws and security standards can be complex and costly. - Competition from Alternative Technologies
Mobile-based authentication solutions pose a potential threat to Smart Card Interface adoption.
Key Benefits of This Market Research:
- Industry drivers, restraints, and opportunities covered in the study
- Neutral perspective on the market performance
- Recent industry trends and developments
- Competitive landscape & strategies of key players
- Potential & niche segments and regions exhibiting promising growth covered
- Historical, current, and projected market size, in terms of value
- In-depth analysis of the Smart Card Interface Market
- Overview of the regional outlook of the Smart Card Interface Market:
Key Reasons to Buy this Report:
- Access to date statistics compiled by our researchers. These provide you with historical and forecast data, which is analyzed to tell you why your market is set to change
- This enables you to anticipate market changes to remain ahead of your competitors
- You will be able to copy data from the Excel spreadsheet straight into your marketing plans, business presentations, or other strategic documents
- The concise analysis, clear graph, and table format will enable you to pinpoint the information you require quickly
- Provision of market value (USD Billion) data for each segment and sub-segment
- Indicates the region and segment that is expected to witness the fastest growth as well as to dominate the market
- Provides insight into the market through Value Chain
- Market dynamics scenario, along with growth opportunities of the market in the years to come
- 6-month post-sales analyst support
Customization of the Report
In case of any queries or customization requirements, please connect with our sales team, who will ensure that your requirements are met.
FAQs
Q: What are the key driving factors and opportunities in the Smart Card Interface market?
A: The market is driven by increasing digital transactions, government initiatives for secure identification, and IoT expansion. Opportunities include growth in emerging markets, biometric authentication, and e-governance applications.
Q: Which region is projected to have the largest market share?
A: North America is expected to hold the largest market share due to high adoption rates in banking, telecom, and government ID programs.
Q: Who are the top players in the global Smart Card Interface market?
A: Leading companies include STMicroelectronics, Maxim, ON Semiconductor, Silvaco, Analog, TI, Microchip Technology, NXP, and Infineon.
Q: What are the latest technological advancements in the industry?
A: Key advancements include contactless payment solutions, AI and IoT integration, enhanced security features, and biometric authentication in Smart Card Interfaces.
Q: What is the current size of the global Smart Card Interface market?
A: The market was valued at USD 2725.40 million in 2023 and is projected to reach USD 3834.91 million by 2030, growing at a CAGR of 5.00%.

Get Sample Report PDF for Exclusive Insights
Report Sample Includes
- Table of Contents
- List of Tables & Figures
- Charts, Research Methodology, and more...