MARKET INSIGHTS
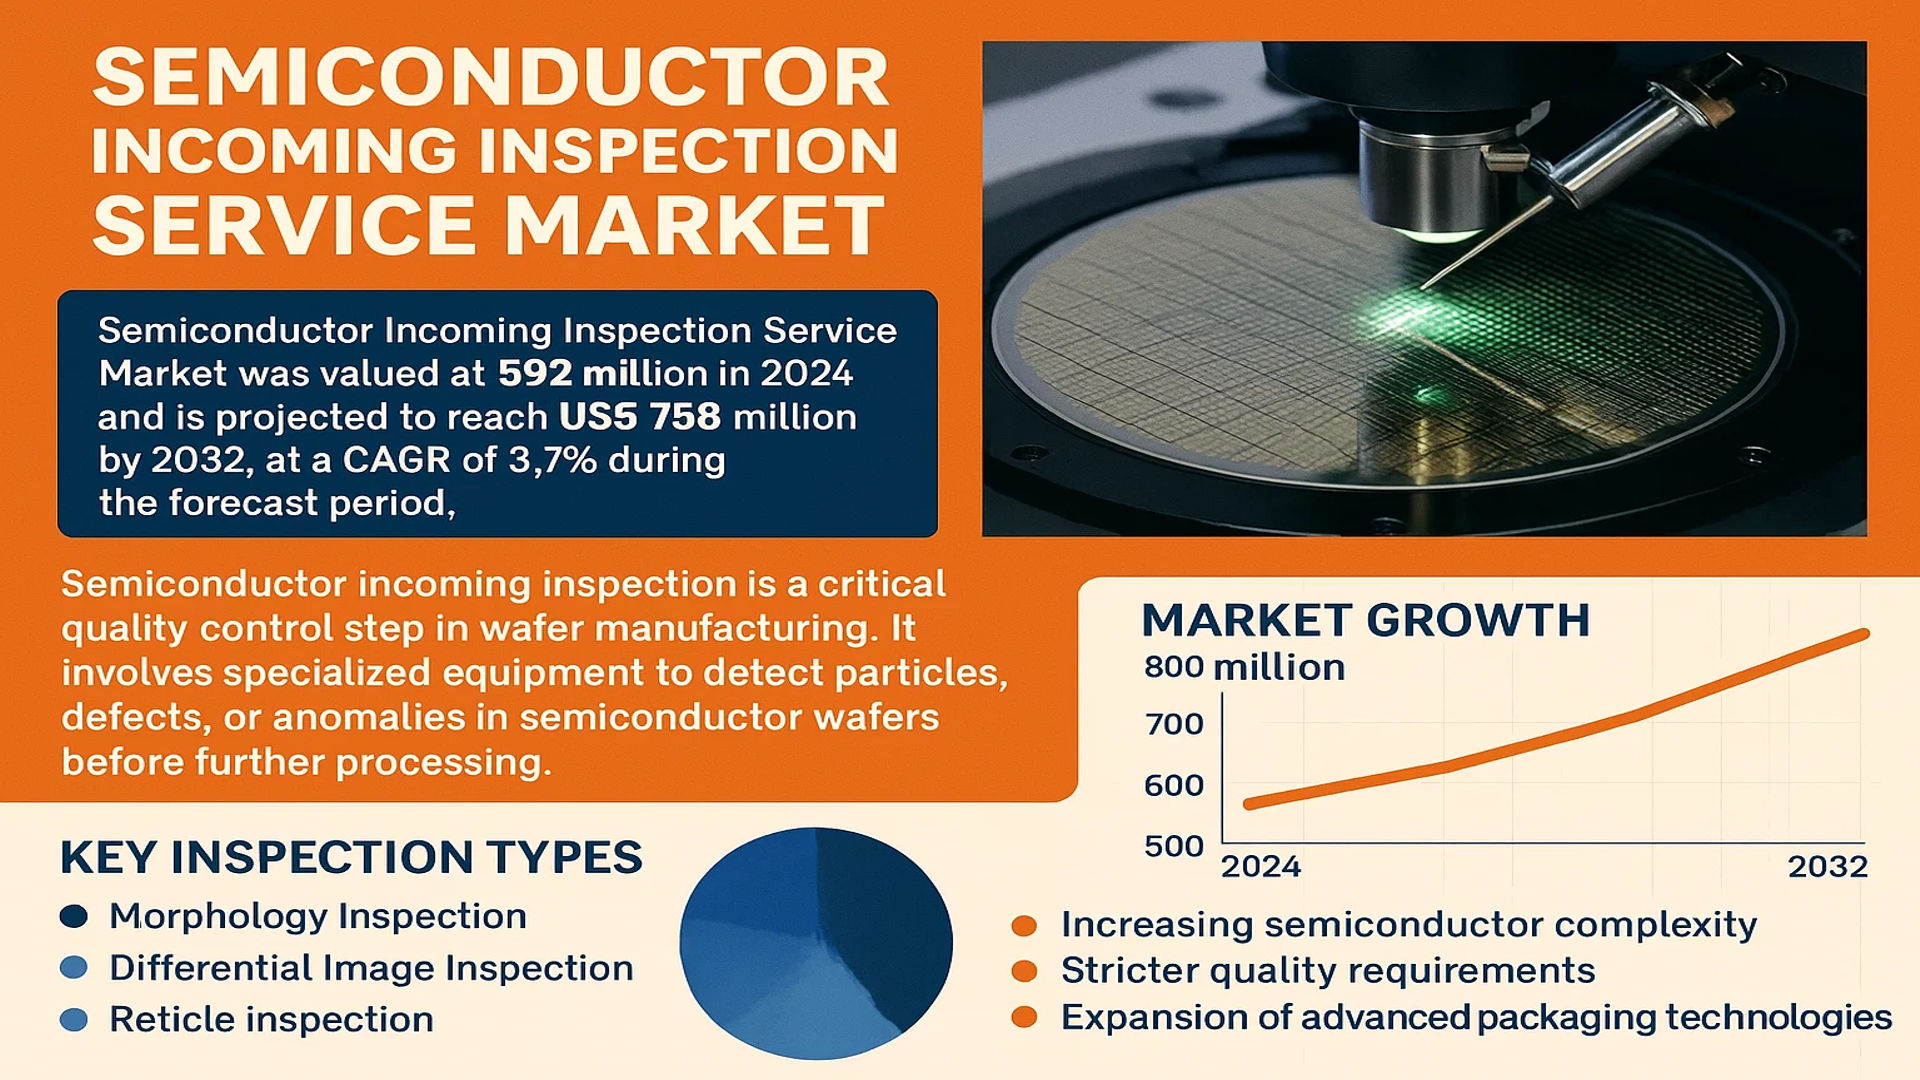
The global Semiconductor Incoming Inspection Service Market was valued at 592 million in 2024 and is projected to reach US$ 758 million by 2032, at a CAGR of 3.7% during the forecast period.
Semiconductor incoming inspection is a critical quality control step in wafer manufacturing. It involves specialized equipment to detect particles, defects, or anomalies in semiconductor wafers before further processing. Key inspection types include morphology inspection, differential image inspection, and reticle inspection, each serving distinct quality assurance purposes across the semiconductor supply chain.
Market growth is driven by increasing semiconductor complexity, stricter quality requirements, and the expansion of advanced packaging technologies. While the broader semiconductor market reached USD 579 billion in 2022 (projected to grow to USD 790 billion by 2029), inspection services remain a niche but essential segment. The rise of IoT applications and automotive semiconductors particularly demands precise inspection protocols, as these sectors require exceptionally high reliability standards.
MARKET DYNAMICS
MARKET DRIVERS
Increasing Semiconductor Manufacturing Complexity to Fuel Inspection Demand
The semiconductor industry is witnessing unprecedented complexity with nodes shrinking below 5nm, driving the need for more sophisticated inspection solutions. As feature sizes approach atomic scales, even nanometer-scale defects can render chips non-functional, making incoming inspection services critical. The global semiconductor market, valued at $579 billion in 2022, is projected to reach $790 billion by 2029, creating parallel growth opportunities for inspection services. With advanced nodes requiring up to 100x more inspection points than mature nodes, foundries and IDMs are increasingly outsourcing these specialized services to maintain yields while controlling capital expenditure.
Rising Quality Standards in Automotive Electronics to Accelerate Adoption
Automotive semiconductor demand, particularly for autonomous driving and electrification systems, requires near-zero defect rates – often below 1 defect per billion units. This stringent quality requirement is driving substantial growth in semiconductor incoming inspection services, as automotive chips undergo exhaustive qualification processes. The shift toward higher-reliability components has led to a 35% increase in inspection intensity for automotive-grade semiconductors compared to consumer electronics applications.
Furthermore, regulatory pressures continue to intensify.
➤ Automotive Safety Integrity Level (ASIL) D certification now mandates particle inspection resolutions below 10nm for critical components in advanced driver-assistance systems (ADAS).
This regulatory landscape is compelling semiconductor suppliers to invest heavily in third-party inspection services to meet automotive OEM requirements while avoiding costly recalls.
Expansion of Advanced Packaging Technologies to Create New Inspection Paradigms
The rapid adoption of 2.5D/3D packaging and chiplet architectures is generating demand for novel inspection methodologies. As die-to-die interconnects and through-silicon vias (TSVs) become more prevalent, traditional inspection techniques often prove inadequate. The market for advanced packaging is growing at 8% annually, requiring inspection service providers to develop new capabilities for detecting microcracks, bonding defects, and thermal stress points in three-dimensional structures.
MARKET RESTRAINTS
High Capital Requirements for Inspection Equipment to Limit Market Expansion
Semiconductor incoming inspection services require multimillion-dollar metrology systems like e-beam inspection tools and hyperspectral imaging platforms, creating significant barriers to market entry. A single advanced inspection system can cost upwards of $10 million, requiring service providers to carefully balance capacity utilization with return on investment. This capital intensity limits the ability of smaller players to compete, potentially constraining market diversity and innovation.
Other Restraints
Technological Obsolescence Risks
The rapid pace of semiconductor process advancements can quickly render inspection methodologies obsolete. Equipment purchased just three years ago may lack the resolution required for cutting-edge nodes, forcing continuous reinvestment. This creates financial pressure on service providers while making long-term planning exceptionally challenging.
Geopolitical Supply Chain Disruptions
Recent trade restrictions have created uncertainties in equipment availability, particularly for inspection systems incorporating advanced optics or specialized sensors. Service providers face extended lead times for critical components, potentially delaying capacity expansions during periods of high demand.
MARKET CHALLENGES
Workforce Shortages to Constrain Service Delivery Capabilities
The semiconductor industry faces an acute shortage of skilled metrology engineers and defect analysis specialists, with estimates suggesting a 40% gap between demand and available talent. Inspection service providers struggle to staff their operations with professionals capable of interpreting complex defect signatures and optimizing inspection recipes for new materials and architectures.
Other Challenges
Data Management Complexities
Modern inspection systems generate terabytes of data daily, requiring sophisticated data infrastructure and analytics capabilities. Many service providers lack the computing resources and AI expertise needed to extract actionable insights from these vast datasets, limiting their value proposition to clients.
Throughput vs. Sensitivity Trade-offs
Balancing inspection speed with defect detection sensitivity remains an ongoing challenge. While hypersensitive inspection can identify critical defects, it often reduces throughput below economically viable levels. Developing inspection strategies that maintain both high sensitivity and throughput requires constant methodology innovation.
MARKET OPPORTUNITIES
AI-Powered Defect Recognition to Transform Inspection Economics
Machine learning algorithms are showing promise in automating defect classification, potentially reducing inspection costs by 30-40%. By training models on millions of defect images, service providers can significantly reduce human analysis time while improving classification accuracy. Early adopters report 20% improvements in false positive rates, directly translating to increased production yields for their clients.
Emerging Materials Innovation to Create Specialized Inspection Niches
The adoption of novel semiconductor materials like gallium nitride (GaN) and silicon carbide (SiC) requires customized inspection approaches. These wide-bandgap materials exhibit unique defect signatures that conventional silicon inspection methodologies often miss. Service providers developing specialized capabilities for compound semiconductors can capture premium pricing in these high-growth segments.
Furthermore, the rapid scaling of photonic chips presents another frontier.
➤ Integrated photonics require inspection solutions capable of evaluating optical performance characteristics in addition to physical defects – a capability few current providers possess.
This creates opportunities for service differentiation through technology partnerships and specialized equipment investments.
Vertical Integration with Failure Analysis to Offer Comprehensive Solutions
Service providers expanding into correlated failure analysis can create significant value for clients by linking incoming inspection results with root-cause failure diagnostics. This integrated approach helps semiconductor manufacturers accelerate yield learning curves while reducing time-to-market for new products. The ability to connect defect observations with electrical performance impacts represents a key differentiator in an increasingly competitive market.
SEMICONDUCTOR INCOMING INSPECTION SERVICE MARKET TRENDS
Growing Semiconductor Complexity Drives Demand for Advanced Inspection Services
The semiconductor incoming inspection service market is experiencing substantial growth due to increasing wafer fabrication complexity and shrinking node sizes. As semiconductor designs shift toward 5nm, 3nm, and even 2nm processes, the precision required for defect detection has intensified. Particle contamination, critical dimension variations, and pattern defects become more significant at these advanced nodes, necessitating sophisticated inspection techniques. The market is projected to grow from $592 million in 2024 to $758 million by 2032, reflecting a steady CAGR of 3.7%. This growth is directly linked to the semiconductor industry’s expansion, which reached $579 billion in 2022 and is forecasted to hit $790 billion by 2029.
Other Trends
Automation and AI-Powered Inspection Solutions
The integration of artificial intelligence (AI) and machine learning (ML) in inspection equipment is revolutionizing the semiconductor incoming inspection process. Automated defect classification (ADC) systems powered by deep learning algorithms now enable real-time anomaly detection with higher accuracy than traditional rule-based methods. These technologies reduce human intervention, minimize false positives, and accelerate inspection throughput, making them indispensable for high-volume manufacturing. Furthermore, AI-driven predictive maintenance of inspection tools reduces downtime, ensuring consistent operational efficiency in wafer fabs.
Shift Toward Hybrid and Outsourced Inspection Models
Semiconductor manufacturers are increasingly adopting hybrid inspection models that combine on-site and outsourced laboratory services. While on-site inspection remains critical for immediate quality control, fabless companies and smaller foundries heavily rely on third-party inspection providers to maintain cost efficiency. The outsourced laboratory services segment is growing rapidly, driven by the need for specialized expertise in advanced imaging techniques such as scanning electron microscopy (SEM) and energy-dispersive X-ray spectroscopy (EDS). Hybrid models also provide access to cutting-edge metrology solutions without the prohibitive capital expenditure of in-house equipment procurement.
Rising Importance of Reticle and Multi-Beam Inspection
With the semiconductor industry moving toward extreme ultraviolet (EUV) lithography, reticle inspection has gained prominence in the incoming inspection workflow. Defects in photomasks can propagate across multiple wafers, making reticle inspection a preventive measure against yield loss. Multi-beam inspection systems are also gaining traction, enabling faster defect detection across larger wafer areas without compromising resolution. This technology is particularly beneficial for high-mix production environments where quick turnaround times are essential.
COMPETITIVE LANDSCAPE
Key Industry Players
Strategic Partnerships and Advanced Inspection Systems Define Market Leadership
The global semiconductor incoming inspection service market displays a moderately consolidated structure, with both specialized service providers and diversified semiconductor equipment companies vying for market share. ASE Global emerges as a dominant player, commanding significant market presence due to its comprehensive inspection capabilities spanning wafer-level packaging, 2.5D/3D ICs, and advanced logic devices. The company reported inspection service revenues exceeding $180 million in 2023, demonstrating its stronghold in the Asian semiconductor ecosystem.
Meanwhile, SGS Group has strategically expanded its semiconductor inspection footprint through multiple laboratory acquisitions across Europe and North America. Their recent $45 million investment in automated optical inspection (AOI) systems underscores their commitment to maintaining technical leadership. Similarly, EAG Laboratories has differentiated itself through niche expertise in failure analysis for compound semiconductors, capturing nearly 12% of the global inspection service market for GaN and SiC devices in 2024.
The competitive intensity continues rising as mid-sized players adopt innovative approaches. MA-tek International for instance, has pioneered AI-driven defect classification systems that reduced inspection cycle times by 30% for 5nm node wafers, according to recent client case studies. Such technological advancements are forcing larger competitors to accelerate their own digital transformation roadmaps.
Industry observers note that successful firms increasingly combine three critical capabilities: multi-technique inspection portfolios covering from macro defects to atomic-scale impurities, regionally distributed service centers to support just-in-time semiconductor manufacturing, and robust data analytics platforms that convert inspection results into actionable process improvements.
List of Key Semiconductor Incoming Inspection Service Providers
- ASE Global (Taiwan)
- SGS Group (Switzerland)
- EAG Laboratories (U.S.)
- MA-tek International (Taiwan)
- TSI Semiconductors (U.S.)
- Newport Wafer Fab (UK)
- Advanced Material Technology Services (Singapore)
Segment Analysis:
By Type
Morphology Inspection Dominates the Market Due to Rising Demand for Defect Detection in Semiconductor Wafers
The market is segmented based on type into:
- Morphology Inspection
- Subtypes: Particle detection, surface roughness analysis, and others
- Differential Image Inspection
- Reticle Inspection
- Subtypes: Photomask inspection, pellicle inspection, and others
- Others
- Subtypes: Electrical testing, chemical analysis, and others
By Application
On-site Service Segment Leads Due to Immediate Quality Control Needs in Semiconductor Manufacturing
The market is segmented based on application into:
- On-site Service
- Outsourced Laboratory Services
- Others
- Subtypes: Third-party verification, remote monitoring services, and others
By End-User
Foundries Segment Dominates Due to High Volume Semiconductor Production Requirements
The market is segmented based on end-user into:
- Integrated Device Manufacturers (IDMs)
- Foundries
- Outsourced Semiconductor Assembly and Test (OSAT) Providers
- Research Institutions
- Others
- Subtypes: Equipment manufacturers, material suppliers, and others
Regional Analysis: Semiconductor Incoming Inspection Service Market
Asia-Pacific
The Asia-Pacific region dominates the global semiconductor incoming inspection service market, accounting for over 48% of the total market share in 2024. This leadership position is driven by the concentration of semiconductor manufacturing giants in countries like China, South Korea, Taiwan, and Japan. China’s aggressive investments in domestic semiconductor production, including the $143 billion support package announced in 2023, are creating substantial demand for inspection services. Taiwan Semiconductor Manufacturing Company (TSMC) alone contributes significantly to regional demand through its advanced process nodes requiring meticulous inspection. While cost competition remains intense, the emergence of local inspection service providers like MA-tek (Taiwan) is challenging traditional Western players. The region benefits from vertically integrated supply chains and government initiatives promoting semiconductor self-sufficiency.
North America
North America represents the second-largest market, with the United States accounting for 82% of regional demand. The market is driven by cutting-edge semiconductor R&D facilities and stringent quality requirements from aerospace/defense applications. The CHIPS and Science Act’s $52.7 billion funding is accelerating domestic semiconductor production, subsequently increasing inspection needs. Major inspection service providers like EAG Laboratories and TSI maintain strong footholds in this high-value market, particularly serving advanced packaging and compound semiconductor segments. However, the region faces challenges from technical workforce shortages and the high cost of next-generation inspection equipment deployment.
Europe
Europe’s market growth is anchored by automotive and industrial semiconductor demand, with Germany and France leading regional adoption. The EU Chips Act’s €43 billion investment is stimulating localized production, particularly for automotive-grade chips requiring rigorous inspection. European firms emphasize metrology accuracy and traceability, aligning with the region’s strong quality management traditions. Companies like SGS have established specialized semiconductor validation centers to serve this need. However, market expansion faces headwinds from energy cost volatility and slower adoption of the latest process nodes compared to Asia-Pacific counterparts.
South America
The South American market remains nascent but shows promise with Brazil’s semiconductor packaging initiatives and Argentina’s focus on power electronics. Limited domestic wafer production currently restricts inspection service demand primarily to imported component validation. Economic instability and infrastructure limitations hinder capital-intensive inspection technology adoption. Nevertheless, the region benefits from proximity to North American supply chains, with some manufacturers establishing basic inspection capabilities to serve regional automotive and consumer electronics markets.
Middle East & Africa
This emerging market is witnessing gradual growth through strategic investments in semiconductor assembly and test facilities, particularly in Israel and the UAE. Israel’s strong fabless semiconductor ecosystem drives demand for specialized inspection services, while Saudi Arabia’s $6 billion semiconductor initiative signals long-term potential. The region faces challenges including limited technical expertise and reliance on imported inspection technologies. However, strategic partnerships with global foundries and government-supported technology transfers are gradually developing local inspection capabilities, particularly for power electronics and MEMS devices.
Report Scope
This market research report provides a comprehensive analysis of the Global Semiconductor Incoming Inspection Service Market, covering the forecast period 2024–2032. It offers detailed insights into market dynamics, technological advancements, competitive landscape, and key trends shaping the industry.
Key focus areas of the report include:
- Market Size & Forecast: Historical data and future projections for revenue, unit shipments, and market value across major regions and segments. The Global Semiconductor Incoming Inspection Service market was valued at USD 592 million in 2024 and is projected to reach USD 758 million by 2032, growing at a CAGR of 3.7%.
- Segmentation Analysis: Detailed breakdown by type (Morphology Inspection, Differential Image Inspection, Reticle Inspection, Others), application (On-site Service, Outsourced Laboratory Services, Others), and end-user industry to identify high-growth segments.
- Regional Outlook: Insights into market performance across North America, Europe, Asia-Pacific, Latin America, and the Middle East & Africa. Asia-Pacific dominates with over 45% market share in 2024 due to semiconductor manufacturing concentration.
- Competitive Landscape: Profiles of leading market participants including ASE, SGS, EAG, MA-tek, TSI, Newport, and AMTS, covering their product offerings, market share, and recent developments.
- Technology Trends & Innovation: Assessment of AI-powered inspection systems, advanced metrology techniques, and Industry 4.0 integration in semiconductor quality control.
- Market Drivers & Restraints: Evaluation of factors like semiconductor industry growth (projected USD 790 billion by 2029), miniaturization trends, and challenges like high equipment costs.
- Stakeholder Analysis: Strategic insights for foundries, IDMs, equipment suppliers, and investors regarding emerging opportunities in advanced packaging and IoT applications.
The report employs primary and secondary research methods, including interviews with industry experts and analysis of verified market data, to ensure accuracy and reliability.
FREQUENTLY ASKED QUESTIONS:
What is the current market size of Global Semiconductor Incoming Inspection Service Market?
-> Semiconductor Incoming Inspection Service Market was valued at 592 million in 2024 and is projected to reach US$ 758 million by 2032, at a CAGR of 3.7% during the forecast period.
Which key companies operate in Global Semiconductor Incoming Inspection Service Market?
-> Key players include ASE, SGS, EAG, MA-tek, TSI, Newport, and AMTS, accounting for over 60% of market share.
What are the key growth drivers?
-> Key drivers include rising semiconductor complexity, stringent quality requirements, and growth in advanced packaging technologies.
Which region dominates the market?
-> Asia-Pacific dominates with over 45% share, driven by semiconductor manufacturing hubs in Taiwan, South Korea, and China.
What are the emerging trends?
-> Emerging trends include AI-powered defect detection, hyperspectral imaging, and automated wafer inspection systems.

Get Sample Report PDF for Exclusive Insights
Report Sample Includes
- Table of Contents
- List of Tables & Figures
- Charts, Research Methodology, and more...


