MARKET INSIGHTS
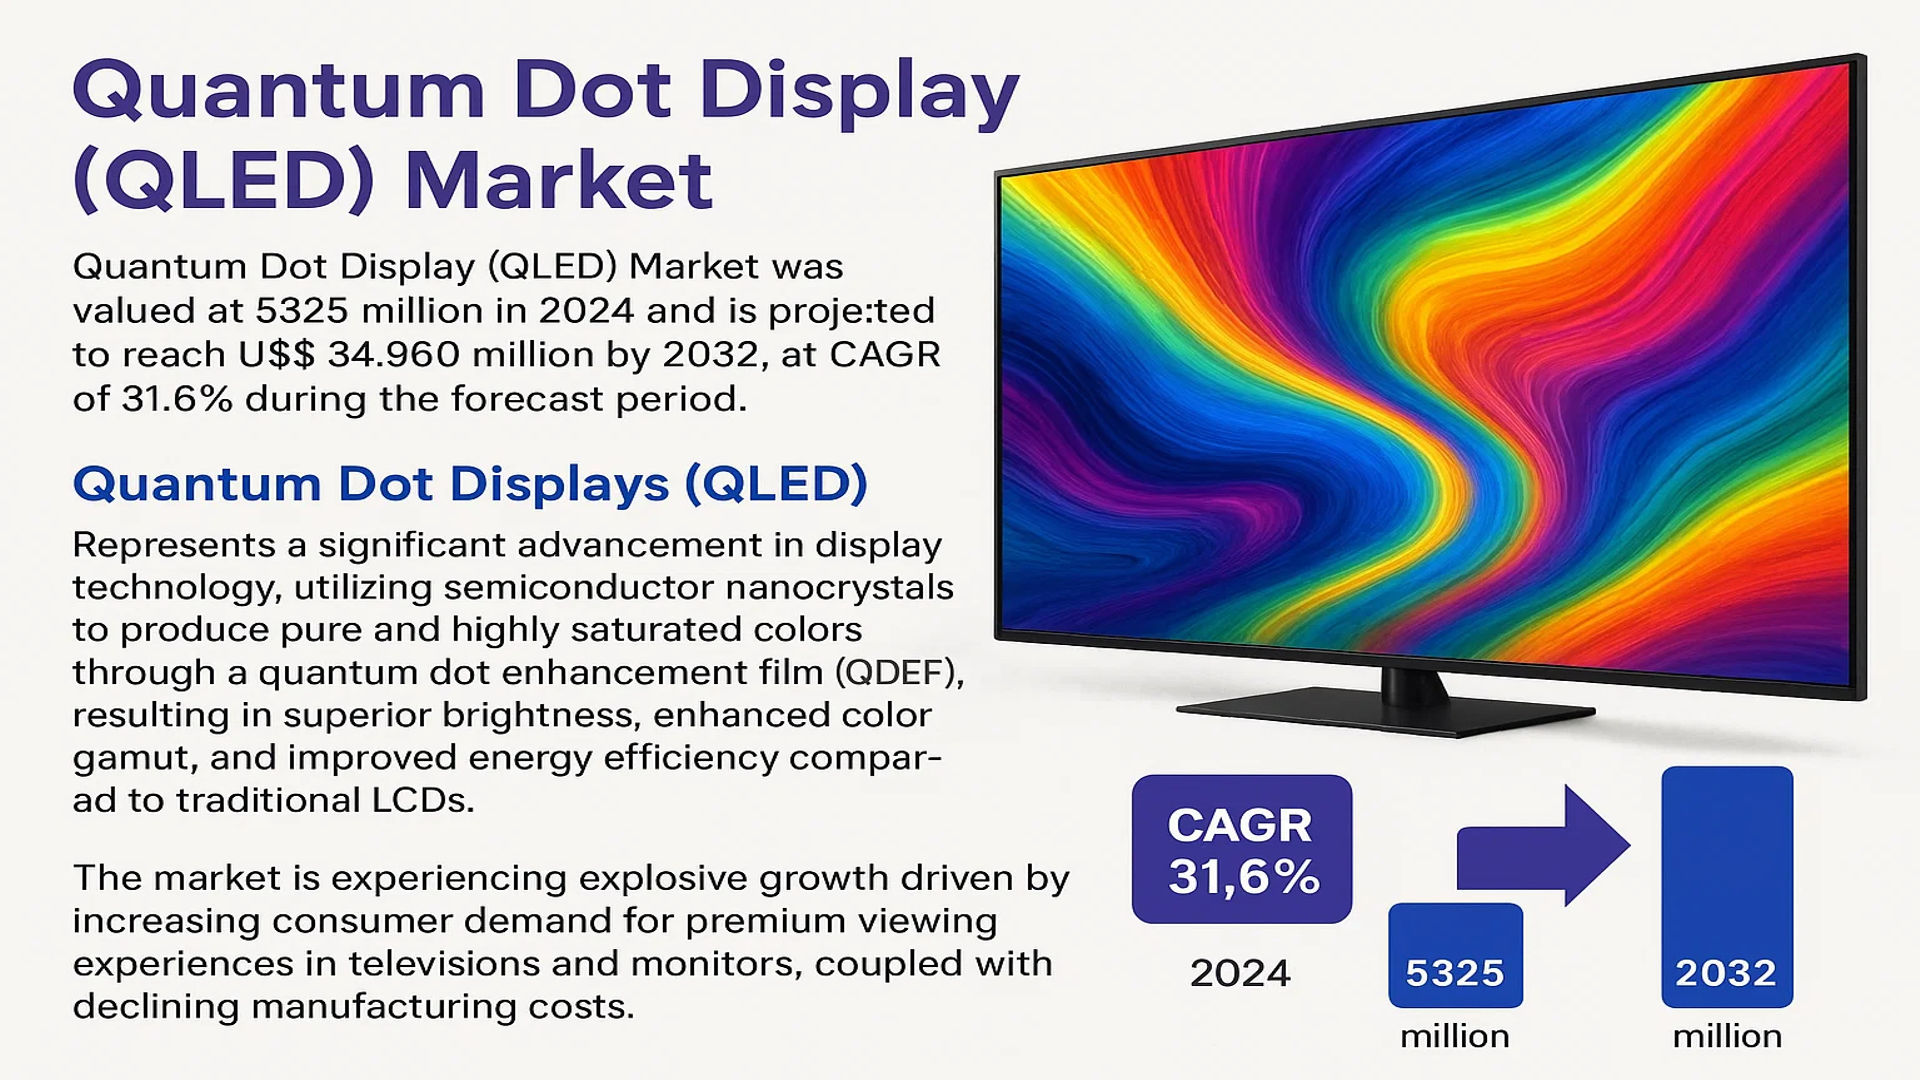
The global Quantum Dot Display (QLED) Market was valued at 5325 million in 2024 and is projected to reach US$ 34960 million by 2032, at a CAGR of 31.6% during the forecast period.
Quantum Dot Displays (QLED) represent a significant advancement in display technology, utilizing semiconductor nanocrystals to produce pure and highly saturated colors. These displays function by converting backlight into pure basic colors through a quantum dot enhancement film (QDEF), resulting in superior brightness, enhanced color gamut, and improved energy efficiency compared to traditional LCDs. The technology is primarily segmented into QDEF and direct-emissive QLED types.
The market is experiencing explosive growth driven by increasing consumer demand for premium viewing experiences in televisions and monitors, coupled with declining manufacturing costs. The television segment dominates the application landscape, holding approximately 70% of the market share. Furthermore, the market is highly concentrated, with the top two players, Samsung and AUO, collectively commanding about 70% of the global revenue. Geographically, Asia is the powerhouse, with China and South Korea alone accounting for nearly 60% of the global market, fueled by their strong manufacturing ecosystems and leading panel producers.
MARKET DYNAMICS
MARKET DRIVERS
Superior Visual Performance and Energy Efficiency Driving Consumer Adoption
Quantum Dot Display technology offers significantly enhanced color gamut, brightness, and energy efficiency compared to traditional LCD displays, making it a preferred choice for premium consumer electronics. QLED TVs achieve over 100% color volume in the DCI-P3 space, providing more vibrant and accurate colors than standard displays. This superior performance is driving consumer demand, particularly in the television segment where screen sizes are increasing and visual quality becomes a primary purchasing factor. The energy efficiency of QLED technology, which consumes approximately 20-30% less power than conventional LCD displays at similar brightness levels, aligns with global sustainability initiatives and reduces operational costs for consumers.
Growing Demand for Larger Screen Sizes and Premium Display Solutions
The global trend toward larger screen sizes in consumer electronics, particularly in the television market, is significantly driving QLED adoption. Market data indicates that 65-inch and larger TVs represent the fastest-growing segment, accounting for nearly 35% of total TV shipments in premium categories. QLED technology’s scalability and performance maintenance across larger panel sizes make it ideal for this market shift. The technology’s ability to maintain color accuracy and brightness uniformity across expansive display surfaces positions it as the leading solution for home entertainment systems seeking cinematic viewing experiences. This trend is further accelerated by declining manufacturing costs, with panel prices for larger QLED displays decreasing by approximately 15% annually since 2020.
Technological Advancements and Manufacturing Scale Improvements
Continuous innovation in quantum dot materials and manufacturing processes is driving down costs while improving performance characteristics. Recent developments in cadmium-free quantum dots have addressed environmental concerns while maintaining optical performance, with new formulations achieving quantum yields exceeding 90%. Manufacturing scale improvements have reduced production costs by approximately 40% since 2018, making QLED technology more accessible across various price segments. The development of electroluminescent QLED (QLED) technology promises further performance enhancements, with prototype displays achieving peak brightness exceeding 2000 nits and significantly improved lifespan characteristics.
MARKET CHALLENGES
High Manufacturing Costs and Complex Production Processes
Despite technological advancements, QLED displays remain more expensive to manufacture than conventional LCD and emerging OLED technologies. The complex deposition processes for quantum dot layers require specialized equipment and controlled environments, increasing capital expenditure by approximately 25-30% compared to standard display production lines. Material costs for high-purity quantum dots remain substantial, with premium quantum dot materials costing nearly 50% more than standard phosphors used in traditional displays. These cost factors create pricing pressure in competitive market segments, particularly in price-sensitive regions where consumers prioritize affordability over premium display features.
Other Challenges
Competition from Alternative Display Technologies
The QLED market faces intense competition from OLED technology, which offers superior contrast ratios and faster response times. OLED displays have achieved significant cost reductions, with manufacturing costs decreasing by approximately 35% over the past three years, narrowing the price gap with QLED products. Additionally, emerging technologies such as MicroLED pose long-term competitive threats, particularly in the premium display segment where performance benchmarks continue to evolve.
Technical Limitations in Certain Applications
QLED technology faces challenges in applications requiring ultra-thin form factors or flexible displays, where OLED technology currently holds advantages. The additional quantum dot layer adds thickness to display assemblies, making integration into slim devices more challenging. Furthermore, current QLED technology struggles to match OLED’s pixel-level contrast capabilities, particularly in dark room viewing scenarios where black levels significantly impact perceived image quality.
MARKET RESTRAINTS
Supply Chain Constraints and Material Availability Issues
The QLED market faces significant supply chain challenges related to the availability and cost of rare earth materials and specialized components. Indium and gallium, essential elements in quantum dot production, have experienced price volatility exceeding 40% annually due to supply chain disruptions and increasing demand across multiple industries. Specialized optical films and barrier layers required for QLED displays face production capacity constraints, with lead times extending to 12-16 weeks for certain components. These supply chain issues create production bottlenecks and cost pressures that limit market expansion and affect product availability across various regions.
Technical Complexity and Manufacturing Yield Challenges
QLED manufacturing involves complex processes with stringent requirements for material purity and layer uniformity, resulting in yield challenges that impact production efficiency. Current manufacturing yields for QLED panels average approximately 85-90% compared to 95%+ yields for mature LCD technology, creating cost disadvantages and production scalability issues. The precision required in quantum dot deposition and encapsulation processes demands highly specialized equipment and skilled technicians, with equipment costs representing nearly 40% of total manufacturing investment. These technical complexities create barriers to entry for new manufacturers and limit production capacity expansion among existing players.
Regulatory Compliance and Environmental Considerations
Stringent environmental regulations regarding heavy metal content, particularly cadmium-based quantum dots, create compliance challenges and additional costs for manufacturers. The transition to cadmium-free alternatives requires significant research and development investment, with material development costs exceeding $50 million for major manufacturers. Recycling and disposal requirements for end-of-life QLED products add compliance costs estimated at 5-7% of product value, affecting overall profitability. These regulatory considerations create additional hurdles for market participants and may slow technology adoption in regions with strict environmental standards.
MARKET OPPORTUNITIES
Expansion into New Application Segments Beyond Television
The QLED market presents significant growth opportunities through expansion into new application segments including automotive displays, gaming monitors, and commercial signage. The automotive display market represents a particularly promising opportunity, with demand for advanced displays growing at approximately 15% annually as vehicles incorporate more digital interfaces. QLED technology’s sunlight readability and wide temperature operation range make it ideal for automotive applications, where display performance requirements exceed consumer electronics standards. The gaming monitor segment offers another growth avenue, with high refresh rate QLED displays gaining traction among professional gamers and enthusiasts willing to pay premium prices for superior visual performance.
Technological Convergence with Emerging Display Formats
Opportunities exist for QLED technology through convergence with emerging display formats including transparent displays, flexible panels, and augmented reality applications. The development of transparent QLED displays enables new applications in retail, automotive, and architectural design, with the transparent display market projected to grow at 25% CAGR through 2030. Flexible QLED technology, while technically challenging, could address current form factor limitations and compete directly with flexible OLED in applications requiring bendable or rollable displays. These technological convergences open new market segments and application possibilities beyond traditional display markets.
Geographical Market Expansion and Emerging Economy Penetration
Significant growth opportunities exist through geographical expansion into emerging economies where display market growth rates exceed 20% annually. Markets in Southeast Asia, Latin America, and Eastern Europe present substantial opportunities as disposable incomes rise and consumers upgrade to premium display technologies. Local manufacturing initiatives in these regions, supported by government incentives and growing technical capabilities, create opportunities for market expansion through regional production partnerships. The increasing availability of streaming content and digital entertainment in these regions drives demand for better display technologies, creating a natural market for QLED products as prices continue to decrease through manufacturing improvements and economies of scale.
QUANTUM DOT DISPLAY (QLED) MARKET TRENDS
Advancements in Quantum Dot Technology and Manufacturing Efficiency
The global Quantum Dot Display (QLED) market is experiencing a significant transformation driven by technological advancements that enhance both performance and production scalability. Recent innovations in cadmium-free quantum dots, particularly those utilizing indium phosphide (InP) and other heavy-metal-free materials, have addressed environmental concerns while maintaining superior color gamut and energy efficiency. These materials now achieve color purity exceeding 100% of the NTSC standard, a critical factor for premium displays. Manufacturing processes have also evolved, with roll-to-roll printing and inkjet deposition techniques reducing production costs by approximately 20-25% over the past three years. This cost reduction is crucial as the market expands beyond high-end televisions into more price-sensitive segments like monitors and mobile devices. Furthermore, integration with mini-LED and micro-LED backlighting systems has created hybrid display technologies that combine the best attributes of both systems, resulting in panels that can achieve peak brightness levels exceeding 2000 nits while maintaining precise color control.
Other Trends
Expansion into New Application Segments
While televisions currently dominate QLED applications with approximately 70% market share, significant growth is occurring in other display categories. The monitor segment is experiencing particularly strong adoption, with year-over-year growth exceeding 40% as professional users and gamers seek higher color accuracy and HDR performance. Smartphone applications, while still nascent, are gaining traction with several flagship models incorporating quantum dot enhancement films to achieve wider color gamuts within power constraints. The automotive display sector represents another emerging opportunity, with quantum dot technology being integrated into digital dashboards and infotainment systems to improve visibility in various lighting conditions. This diversification across applications is creating a more balanced market structure less dependent on the cyclical television replacement cycle.
Regional Manufacturing Dominance and Supply Chain Evolution
The geographical concentration of QLED manufacturing continues to shape global market dynamics, with China and South Korea collectively representing approximately 60% of production capacity. This regional dominance has created both advantages and challenges within the supply chain. While it enables economies of scale and concentrated expertise, it also creates vulnerability to regional disruptions and trade policies. In response, manufacturers are developing more geographically diverse supply networks, with new production facilities emerging in Southeast Asia and Eastern Europe. The market is also seeing increased vertical integration as display panel manufacturers acquire or partner with quantum dot material producers to secure supply and control quality. This trend toward integration is particularly evident among the top two market players who control approximately 70% of global production, allowing them to optimize both material development and panel manufacturing processes simultaneously.
COMPETITIVE LANDSCAPE
Key Industry Players
Technological Innovation and Manufacturing Scale Define Market Leadership
The global Quantum Dot Display (QLED) market exhibits a highly concentrated competitive structure, dominated by a handful of major display panel manufacturers and technology giants. This concentration is primarily due to the significant capital expenditure required for R&D and the establishment of advanced manufacturing facilities. The market is characterized by intense competition where technological superiority, production capacity, and strategic partnerships are key determinants of success.
Samsung Electronics Co., Ltd. stands as the undisputed market leader, commanding a dominant position. This leadership is largely attributable to its pioneering role in commercializing QLED technology for televisions and its vertically integrated supply chain. The company’s significant investment in quantum dot material research and its massive manufacturing scale have allowed it to secure a commanding revenue share of the global market. Its brand strength in consumer electronics, particularly in the high-end TV segment which accounts for approximately 70% of QLED application, further solidifies its top position.
AU Optronics Corp. (AUO) is another pivotal player, holding a substantial market share. The company’s growth is fueled by its strong portfolio of display solutions for a diverse range of applications, including monitors and automotive displays, beyond just televisions. AUO’s continuous innovation in panel design and efficiency, coupled with its established relationships with global electronics brands, has cemented its status as a key supplier in the industry.
Meanwhile, Chinese panel makers are aggressively expanding their influence. Companies like BOE Technology Group Co., Ltd. (BOE), China Star Optoelectronics Technology (CSOT), and Innolux Corporation are strengthening their market presence through massive investments in new production lines and focused R&D initiatives. Their strategy often involves competing on cost-efficiency while rapidly closing the technology gap, making them formidable competitors, especially in the Asia-Pacific region which constitutes a major portion of both production and consumption.
These leading companies are perpetually engaged in strategies to outpace one another. This includes significant investments in next-generation QLED technologies, such as electroluminescent Quantum Dot displays (QD-EL), which promise even better picture quality. Geographical expansion, particularly into emerging markets, and the formation of strategic alliances with material suppliers and end-device manufacturers are also critical tactics being employed to capture greater market share in this rapidly growing industry.
List of Key Quantum Dot Display (QLED) Companies Profiled
- Samsung Electronics Co., Ltd. (South Korea)
- AU Optronics Corp. (AUO) (Taiwan)
- BOE Technology Group Co., Ltd. (China)
- China Star Optoelectronics Technology (CSOT) (China)
- Innolux Corporation (Taiwan)
Segment Analysis:
By Type
QDEF Segment Dominates the Market Due to its Superior Color Performance and Cost-Effectiveness in Backlight Units
The market is segmented based on type into:
- QDEF (Quantum Dot Enhancement Film)
- Subtypes: Film-based, Tube-based, and others
- QLED (Quantum Dot Light Emitting Diode)
- Others
By Application
TV Segment Leads Due to High Consumer Demand for Premium Viewing Experiences and Larger Screen Sizes
The market is segmented based on application into:
- TV
- Monitor
- Smartphone
- Others
By End User
Consumer Electronics Segment Leads Due to Mass Adoption in Home Entertainment and Personal Computing Devices
The market is segmented based on end user into:
- Consumer Electronics
- Healthcare
- Automotive
- Retail and Advertising
- Others
By Technology
Cadmium-Based QDs Segment Leads Due to Established Manufacturing Processes and High Quantum Yield, Though Cadmium-Free is Gaining Traction
The market is segmented based on technology into:
- Cadmium-Based Quantum Dots
- Cadmium-Free Quantum Dots
- Subtypes: Indium Phosphide, Silicon, and others
Regional Analysis: Quantum Dot Display (QLED) Market
Asia-Pacific
The Asia-Pacific region is the undisputed leader in the global QLED market, accounting for approximately 60% of its total value. This dominance is primarily driven by the colossal manufacturing ecosystems and technological prowess of South Korea and China. South Korea, home to Samsung, the market leader with a dominant share, serves as the epicenter of QLED innovation and high-volume production. China follows closely, with massive domestic panel manufacturers like BOE, CSOT, and Innolux aggressively expanding their QLED production capacities to cater to both local and international demand. The region’s strength is further amplified by its extensive consumer electronics supply chain, high consumer adoption rates for premium televisions, and significant investments in R&D. While the market is overwhelmingly led by the QDEF type for television applications, there is a growing push towards developing self-emissive QLED technologies to compete directly with OLED.
North America
North America represents a highly valuable, mature market characterized by strong consumer demand for premium, large-screen displays. The United States is the key revenue generator, with consumers showing a high willingness to adopt cutting-edge television technology. Demand is primarily fueled by the replacement cycle of older LCD TVs and the desire for enhanced viewing experiences with features like 4K/8K resolution, high dynamic range (HDR), and superior color gamut that QLED provides. While the region has limited local manufacturing, it is a critical market for sales and distribution. Major brands like Samsung and Hisense have a strong retail presence, and marketing efforts are intensely focused on highlighting the technological advantages of QLED over conventional displays. The market is also seeing growing application in high-end monitors for professional and gaming use.
Europe
Similar to North America, Europe is a significant and high-value market for QLED displays, though it is slightly more fragmented due to diverse consumer preferences across its member states. Western European nations, including Germany, the UK, and France, exhibit the strongest demand, driven by high disposable incomes and a keen interest in premium home entertainment systems. The market is highly competitive, with all major global brands vying for shelf space. European consumers are particularly attentive to energy efficiency ratings and product sustainability, which influences manufacturer offerings and marketing strategies. While television sets remain the primary application, there is a notable and growing segment for QLED technology in professional monitors for design, photography, and video editing, where color accuracy is paramount.
South America
The QLED market in South America is emerging but faces challenges due to economic volatility and currency fluctuations, which can make premium electronics like QLED TVs less accessible to a broad consumer base. Brazil is the largest market in the region, with a growing middle class that is increasingly interested in advanced consumer electronics. However, price sensitivity remains a significant factor, often leading to a longer replacement cycle for televisions and a market where mid-tier LCD models still hold substantial share. Despite these hurdles, major international brands maintain a presence, and the long-term potential for growth is recognized as economic conditions stabilize and disposable incomes rise, gradually driving adoption of newer display technologies.
Middle East & Africa
This region presents a nascent but promising market for QLED technology, with growth largely concentrated in more affluent Gulf Cooperation Council (GCC) nations like the United Arab Emirates and Saudi Arabia. In these markets, there is a strong demand for luxury goods and state-of-the-art home electronics, making them key targets for high-end QLED television models. The value proposition of a superior viewing experience aligns well with the consumer base in these countries. Conversely, in other parts of the region, market development is slower, constrained by lower average incomes and less developed retail infrastructure. Nonetheless, as urbanization continues and economies diversify, the broader Middle East and Africa region is expected to represent a growing opportunity for market expansion in the long term.
Report Scope
This market research report provides a comprehensive analysis of the global Quantum Dot Display (QLED) market, covering the forecast period 2025–2032. It offers detailed insights into market dynamics, technological advancements, competitive landscape, and key trends shaping the industry.
Key focus areas of the report include:
- Market Size & Forecast: Historical data and future projections for revenue, unit shipments, and market value across major regions and segments.
- Segmentation Analysis: Detailed breakdown by product type, technology, application, and end-user industry to identify high-growth segments and investment opportunities.
- Regional Outlook: Insights into market performance across North America, Europe, Asia-Pacific, Latin America, and the Middle East & Africa, including country-level analysis where relevant.
- Competitive Landscape: Profiles of leading market participants, including their product offerings, R&D focus, manufacturing capacity, pricing strategies, and recent developments such as mergers, acquisitions, and partnerships.
- Technology Trends & Innovation: Assessment of emerging technologies, integration of AI/IoT, semiconductor design trends, fabrication techniques, and evolving industry standards.
- Market Drivers & Restraints: Evaluation of factors driving market growth along with challenges, supply chain constraints, regulatory issues, and market-entry barriers.
- Stakeholder Analysis: Insights for component suppliers, OEMs, system integrators, investors, and policymakers regarding the evolving ecosystem and strategic opportunities.
Primary and secondary research methods are employed, including interviews with industry experts, data from verified sources, and real-time market intelligence to ensure the accuracy and reliability of the insights presented.
FREQUENTLY ASKED QUESTIONS:
What is the current market size of Global Quantum Dot Display (QLED) Market?
-> Quantum Dot Display (QLED) Market was valued at 5325 million in 2024 and is projected to reach US$ 34960 million by 2032, at a CAGR of 31.6% during the forecast period.
Which key companies operate in Global Quantum Dot Display (QLED) Market?
-> Key players include Samsung, AUO, CSOT, Innolux, and BOE, among others.
What are the key growth drivers?
-> Key growth drivers include superior color performance, energy efficiency, increasing demand for high-resolution displays, and rising adoption in consumer electronics.
Which region dominates the market?
-> Asia-Pacific is the dominant region, with China and South Korea accounting for approximately 60% of the global market share.
What are the emerging trends?
-> Emerging trends include advancements in QLED technology, integration with IoT and smart devices, development of flexible and transparent displays, and increasing R&D investments in nanomaterials.

Get Sample Report PDF for Exclusive Insights
Report Sample Includes
- Table of Contents
- List of Tables & Figures
- Charts, Research Methodology, and more...
 Download Sample Report PDF