Picmove Interferometer Market Overview
The picmove interferometer is based on the integration of a single chip in an advanced housing, enabling ultra-low noise vibration measurements. The human eye safe operating wavelength of 1.55µm provides compatibility with commercial telecommunication laser sources. The sensor design can also handle visible wavelengths to simplify beam alignment. The electrical part of the measurement system.
This report provides a deep insight into the global Picmove Interferometer market covering all its essential aspects. This ranges from a macro overview of the market to micro details of the market size, competitive landscape, development trend, niche market, key market drivers and challenges, SWOT analysis, value chain analysis, etc.
The analysis helps the reader to shape the competition within the industries and strategies for the competitive environment to enhance the potential profit. Furthermore, it provides a simple framework for evaluating and accessing the position of the business organization. The report structure also focuses on the competitive landscape of the Global Picmove Interferometer Market, this report introduces in detail the market share, market performance, product situation, operation situation, etc. of the main players, which helps the readers in the industry to identify the main competitors and deeply understand the competition pattern of the market.
In a word, this report is a must-read for industry players, investors, researchers, consultants, business strategists, and all those who have any kind of stake or are planning to foray into the Picmove Interferometer market in any manner.
Picmove Interferometer Market Analysis:
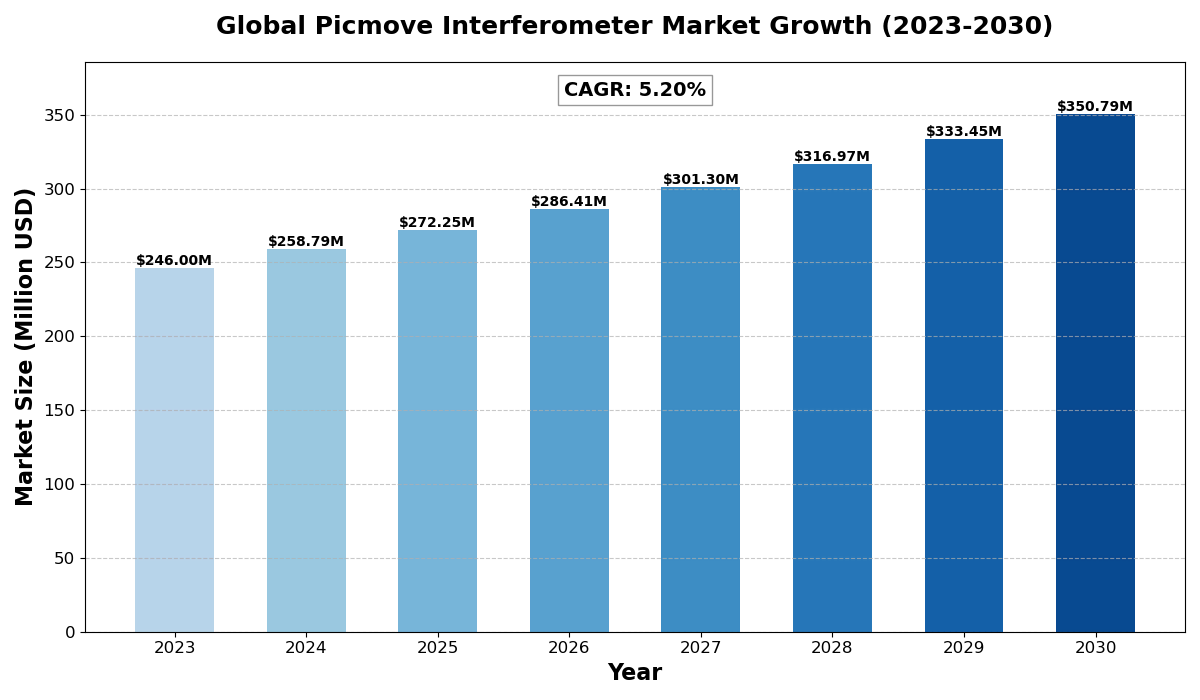
The global Picmove Interferometer Market size was estimated at USD 246 million in 2023 and is projected to reach USD 350.79 million by 2030, exhibiting a CAGR of 5.20% during the forecast period.
North America Picmove Interferometer market size was USD 64.10 million in 2023, at a CAGR of 4.46% during the forecast period of 2025 through 2030.
Picmove Interferometer Key Market Trends :
- Rising Demand in Aerospace & Automotive – Increasing applications in high-precision measurement are driving market expansion in aerospace and automotive industries.
- Integration with AI and Automation – Smart interferometers powered by AI and automation enhance measurement accuracy and efficiency.
- Advancements in Optical Technology – Innovations in optical components are improving performance, reducing costs, and expanding applications.
- Growing Adoption in Medical Technology – The use of interferometers in medical imaging and diagnostics is increasing due to their precision.
- Expansion in Asia-Pacific – The rapid industrialization in China, Japan, and India is fueling market growth in the Asia-Pacific region.
Picmove Interferometer Market Regional Analysis :

North America:
Strong demand driven by EVs, 5G infrastructure, and renewable energy, with the U.S. leading the market.
Europe:
Growth fueled by automotive electrification, renewable energy, and strong regulatory support, with Germany as a key player.
Asia-Pacific:
Dominates the market due to large-scale manufacturing in China and Japan, with growing demand from EVs, 5G, and semiconductors.
South America:
Emerging market, driven by renewable energy and EV adoption, with Brazil leading growth.
Middle East & Africa:
Gradual growth, mainly due to investments in renewable energy and EV infrastructure, with Saudi Arabia and UAE as key contributors.
Picmove Interferometer Market Segmentation :
The research report includes specific segments by region (country), manufacturers, Type, and Application. Market segmentation creates subsets of a market based on product type, end-user or application, Geographic, and other factors. By understanding the market segments, the decision-maker can leverage this targeting in the product, sales, and marketing strategies. Market segments can power your product development cycles by informing how you create product offerings for different segments.
Key Company
- Anger Associates Inc.
- attocube
- COSA Xentaur Corp.
- Lapmaster Wolters
- Micro Epsilon
- MotionX
- NTT Advanced Technology Corporation
- OptiPro Systems
- Optotech
- Phasics
- Physik Instrumente
- Pratt & Whitney Measurement Systems
- Inc.
- Precision Surfacing Solutions
- Teem Photonics
- Tipteh
- Warren-Knight Instrument Co.
Market Segmentation (by Type)
- Single Path Interferometer
- Multi Path Interferometer
Market Segmentation (by Application)
- Mechanical Engineering
- Automotive Industry
- Aerospace
- Oil And Gas
- Chemical Industry
- Medical Technology
- Electrical Industry
Drivers
- Increasing Demand for Precision Measurement – Industries like aerospace, automotive, and medical rely on highly accurate measurement tools, driving the adoption of interferometers.
- Technological Advancements – Continuous improvements in laser technology, sensors, and AI integration enhance efficiency and usability.
- Expansion in Emerging Markets – Developing economies are investing in industrial automation and precision engineering, contributing to market growth.
Restraints
- High Initial Investment – The cost of advanced Picmove Interferometers can be a barrier for small and medium enterprises.
- Complex Integration Process – Implementing interferometers requires technical expertise and system compatibility, limiting adoption.
- Availability of Alternative Measurement Tools – Other measurement techniques, such as coordinate measuring machines (CMM), compete with interferometers in some applications.
Opportunities
- Growing Applications in Medical and Biotechnology – Expanding use in optical coherence tomography (OCT) and other medical imaging fields.
- Rising Demand for Semiconductor Inspection – Increased need for high-precision inspection in semiconductor manufacturing.
- Development of Portable and Cost-Effective Solutions – Innovations in compact and affordable interferometers can expand market reach.
Challenges
- Technological Complexity – Continuous advancements require companies to invest in R&D to stay competitive.
- Supply Chain Disruptions – Dependency on specialized optical components can lead to manufacturing delays.
- Regulatory Compliance Issues – Different regions have varying safety and performance regulations that manufacturers must adhere to.
Key Benefits of This Market Research:
- Industry drivers, restraints, and opportunities covered in the study
- Neutral perspective on the market performance
- Recent industry trends and developments
- Competitive landscape & strategies of key players
- Potential & niche segments and regions exhibiting promising growth covered
- Historical, current, and projected market size, in terms of value
- In-depth analysis of the Picmove Interferometer Market
- Overview of the regional outlook of the Picmove Interferometer Market:
Key Reasons to Buy this Report:
- Access to date statistics compiled by our researchers. These provide you with historical and forecast data, which is analyzed to tell you why your market is set to change
- This enables you to anticipate market changes to remain ahead of your competitors
- You will be able to copy data from the Excel spreadsheet straight into your marketing plans, business presentations, or other strategic documents
- The concise analysis, clear graph, and table format will enable you to pinpoint the information you require quickly
- Provision of market value (USD Billion) data for each segment and sub-segment
- Indicates the region and segment that is expected to witness the fastest growth as well as to dominate the market
- Analysis by geography highlighting the consumption of the product/service in the region as well as indicating the factors that are affecting the market within each region
- Competitive landscape which incorporates the market ranking of the major players, along with new service/product launches, partnerships, business expansions, and acquisitions in the past five years of companies profiled
- Provides insight into the market through Value Chain
- Market dynamics scenario, along with growth opportunities of the market in the years to come
- 6-month post-sales analyst support
Customization of the Report
In case of any queries or customization requirements, please connect with our sales team, who will ensure that your requirements are met.
FAQs
Q: What are the key driving factors and opportunities in the Picmove Interferometer market?
A: The key drivers include increasing demand for precision measurement, technological advancements, and expansion in emerging markets. Opportunities lie in medical applications, semiconductor inspection, and the development of portable interferometers.
Q: Which region is projected to have the largest market share?
A: The Asia-Pacific region is expected to have the largest market share due to rapid industrialization, growth in the semiconductor sector, and increased investment in automation technologies.
Q: Who are the top players in the global Picmove Interferometer market?
A: Leading companies include Anger Associates Inc., attocube, COSA Xentaur Corp., Micro Epsilon, NTT Advanced Technology Corporation, OptiPro Systems, and Physik Instrumente, among others.
Q: What are the latest technological advancements in the industry?
A: Advancements include AI-driven interferometers, improved optical sensor technology, enhanced automation features, and miniaturized, portable interferometer designs for broader applications.
Q: What is the current size of the global Picmove Interferometer market?
A: The market was valued at USD 246 million in 2023 and is projected to reach USD 350.79 million by 2030, with a CAGR of 5.20% during the forecast period.

Get Sample Report PDF for Exclusive Insights
Report Sample Includes
- Table of Contents
- List of Tables & Figures
- Charts, Research Methodology, and more...


