PCB & PCBA Market, Global Business Strategies 2026-2033

PCB & PCBA Market was valued at USD 70,810 million in 2025 and is projected to reach USD 90,010 million by 2033, exhibiting a CAGR of 3.6% during the forecast period.

PDF Icon Download Sample Report PDF
  • Quick Dispatch

    All Orders

  • Secure Payment

    100% Secure Payment

Price range: $1,500.00 through $4,250.00

Clear

Market Insights

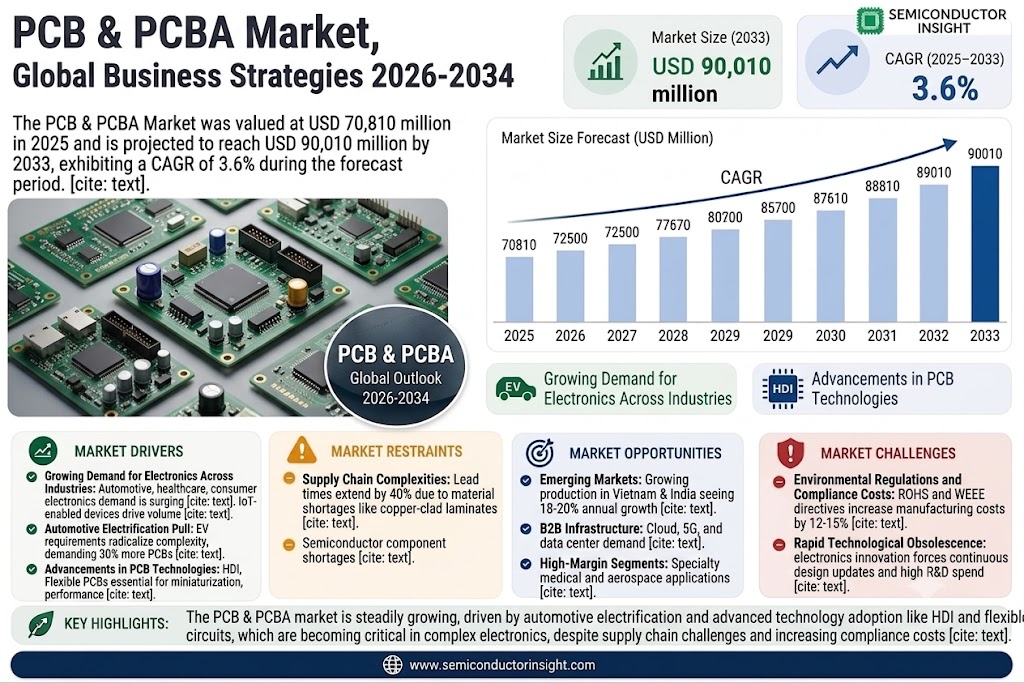
Global PCB & PCBA Market was valued at USD 70,810 million in 2025 and is projected to reach USD 90,010 million by 2033, exhibiting a CAGR of 3.6% during the forecast period.

A printed circuit board (PCB) mechanically supports and electrically connects electronic components using conductive tracks, pads, and other features etched from copper sheets laminated onto a non-conductive substrate. Components such as capacitors, resistors, or active devices are generally soldered onto the PCB. PCBA refers to Printed Circuit Board Assembly, where the bare board is populated with electronic components to form a functional printed circuit assembly (PCA), commonly called a printed circuit board assembly (PCBA).

The market growth is driven by increasing demand for consumer electronics, automotive electronics, and advancements in communication technologies. China dominates the market with a share of approximately 50%, followed by Taiwan and South Korea, which collectively hold around 25%. Standard Multilayer PCBs account for the largest product segment at 35%, while communications represent the leading application segment.

Xyz market size & forecast
 

MARKET DRIVERS

Growing Demand for Electronics Across Industries

PCB & PCBA Market is experiencing significant growth due to increasing demand across automotive, healthcare, and consumer electronics sectors. The rise of smart devices and IoT-enabled products has created unprecedented demand for high-quality printed circuit boards. Global PCB production has grown by 8.3% annually since 2020.

Advancements in PCB Technologies

Innovations in high-density interconnect (HDI) and flexible PCB technologies are driving market expansion. The shift toward miniaturization and higher performance in electronics has made advanced PCB solutions essential. Global HDI PCB market is projected to reach USD 15.7 billion by 2026.

Automotive electrification represents another key driver, with EV manufacturers requiring 30% more PCBs per vehicle compared to traditional automobiles.

MARKET CHALLENGES

Supply Chain Complexities

PCB & PCBA Market faces significant challenges from global supply chain disruptions. Raw material shortages, particularly for copper-clad laminates and semiconductor components, have caused lead times to extend by 40% since 2021.

Other Challenges

Rapid Technological Obsolescence
The fast pace of innovation in electronics requires continuous PCB design updates, creating production inefficiencies and increasing R&D costs for manufacturers.

MARKET RESTRAINTS

Environmental Regulations and Compliance Costs

Stringent environmental regulations regarding hazardous materials in PCB production have increased manufacturing costs by 12-15%. Compliance with RoHS and WEEE directives requires significant investment in alternative materials and processes.

MARKET OPPORTUNITIES

Expansion in Emerging Markets

Growing electronics manufacturing in Southeast Asia presents lucrative opportunities for PCB & PCBA providers. Countries like Vietnam and India are experiencing 18-20% annual growth in PCB consumption as production shifts from China.

Automotive Electronics Boom

The automotive PCB market is projected to grow at 9.4% CAGR through 2030, driven by increasing ADAS implementations and vehicle electrification. Premium vehicles now contain over 100 PCBs compared to just 30 a decade ago.
PCB & PCBA Market Trends

Steady Growth in PCB & PCBA Market Projected Through 2033

Global PCB & PCBA Market is experiencing consistent expansion, with current valuations at USD 70.8 billion in 2025 and projected to reach USD 90 billion by 2033. This represents a compound annual growth rate of 3.6%, driven by increasing demand across communication, automotive, and consumer electronics sectors. China dominates the landscape with 50% market share, while Taiwan and South Korea collectively account for 25%.

Other Trends

Standard Multilayer PCBs Lead Product Segments

Standard multilayer PCBs currently hold 35% of the market share due to their widespread use in complex electronic devices. The segment is expected to maintain dominance as manufacturers seek balance between performance and cost-effectiveness for mid-range applications.

Regional Market Dynamics

Asia-Pacific continues as the production epicenter, accounting for over 75% of global PCB & PCBA output. North America and Europe are focusing on high-value specialized applications like aerospace and medical electronics, creating opportunities for premium PCB solutions.

Emerging Applications Drive Innovation

Automotive electrification and 5G infrastructure development are creating new demand vectors for advanced PCB technologies. The industry is responding with innovations in HDI and flexible circuit designs to meet these specialized requirements.

Competitive Landscape Consolidation

The top five manufacturers control more than 10% of the global PCB & PCBA Market, with companies like Nippon Mektron and Unimicron leading through technological differentiation and scaled production capabilities. Strategic acquisitions are expected to intensify as players seek to expand geographic and technical portfolios.

COMPETITIVE LANDSCAPE

Key Industry Players

Asia-Pacific Dominates with Over 75% Market Share in PCB & PCBA Production

Global PCB & PCBA Market is highly concentrated with the top 5 manufacturers holding over 10% market share collectively. Nippon Mektron leads the industry with strong capabilities in HDI and flexible PCBs, followed closely by Taiwan’s Unimicron which specializes in high-layer count PCBs for advanced applications. These players maintain dominance through continuous R&D investments in advanced packaging technologies and strategic partnerships with global electronics OEMs.

Regional players like China’s ZDT and Tripod are gaining market share through cost-competitive manufacturing and expanding automotive electronics portfolios. South Korean firms SEMCO and Daeduck Group excel in high-density interconnect (HDI) boards for smartphones, while European specialist AT&S maintains leadership in IC substrates for semiconductor packaging. The market sees increasing competition from emerging players like TopCB and Kinwong, who are rapidly scaling up production capacities.

List of Key PCB & PCBA Companies Profiled

  • Nippon Mektron
  • Unimicron
  • SEMCO
  • Young Poong Group
  • Ibiden
  • ZDT
  • Tripod
  • TTM Technologies
  • Shinko Electric Ind
  • Daeduck Group
  • HannStar Board (GBM)
  • AT&S
  • Kingboard
  • Compeq
  • MEIKO ELECTRONICS

Segment Analysis:

Segment Category Sub-Segments Key Insights
By Type
  • Standard Multilayer
  • HDI, Microvia or Build-Up
  • Flexible Circuits
  • Rigid Flex
  • IC Substrate
Standard Multilayer dominates due to its widespread adoption across industries

  • Preferred for cost-effectiveness and reliability in mid-complexity applications
  • HDI and flexible circuits show highest growth potential with miniaturization trends
  • Rigid-flex solutions gaining traction in aerospace and medical applications
By Application
  • Communications
  • Consumer Electronics
  • Automotive
  • Industrial/Medical
  • Military/Aerospace
Communications leads demand driven by 5G infrastructure and IoT devices

  • Automotive sector shows accelerated adoption with electric vehicle production growth
  • Medical applications require specialized high-reliability boards with strict certifications
  • Military/aerospace segment demands ruggedized solutions with extended lifecycle support
By End User
  • OEMs (Original Equipment Manufacturers)
  • EMS Providers (Electronic Manufacturing Services)
  • ODMs (Original Design Manufacturers)
EMS Providers demonstrate strongest growth as outsourcing trends accelerate

  • Increasing complexity drives more OEMs to leverage specialized manufacturing partners
  • ODMs continue to capture mid-volume production with integrated design services
  • Supply chain diversification creates opportunities for regional EMS providers
By Complexity Level
  • Low Complexity (1-4 layer)
  • Medium Complexity (5-12 layer)
  • High Complexity (13+ layer)
Medium Complexity boards generate highest revenue across industries

  • High complexity designs seeing increased demand from networking and computing applications
  • Low complexity boards remain essential for cost-sensitive consumer products
  • Layer count requirements continue rising with higher performance needs
By Production Process
  • Etching
  • Plating
  • Lamination
  • Solder Mask
Etching Process remains fundamental to PCB manufacturing

  • Advanced plating techniques becoming critical for high-density interconnects
  • Lamination processes evolving to accommodate more layers in complex boards
  • Solder mask technology improvements driven by environmental regulations

Regional Analysis: PCB & PCBA Market

Asia-Pacific

The Asia-Pacific region dominates the PCB & PCBA Market with its robust electronics manufacturing ecosystem, led by China, Japan, South Korea, and Taiwan. This region benefits from established semiconductor supply chains, government incentives for electronics production, and growing domestic demand for consumer electronics. China’s Pearl River Delta remains the global hub for PCB fabrication, while Taiwan excels in advanced packaging technologies. Southeast Asian nations are emerging as key players for lower-cost PCBA production, supported by favorable trade policies and skilled workforce development programs. The region’s PCB & PCBA sector continues to evolve with investments in high-density interconnect (HDI) and flexible PCB technologies to meet demands from 5G infrastructure and automotive electronics sectors.

China’s Manufacturing Leadership
China maintains PCB & PCBA dominance through vertically integrated electronics clusters in Shenzhen and Kunshan, supported by comprehensive component supply networks and advanced SMT capabilities that enable rapid prototyping and mass production.
Japan’s Technological Edge
Japanese PCB manufacturers lead in high-reliability boards for automotive and industrial applications, with specialty materials and precision manufacturing techniques that command premium pricing in the PCB & PCBA Market.
Southeast Asia Growth
Malaysia, Vietnam, and Thailand are attracting PCB & PCBA investments with competitive labor costs and free trade agreements, developing into important secondary hubs for consumer electronics assembly and testing operations.
India’s Emerging Market
India’s PCB & PCBA sector is growing through smartphone manufacturing initiatives and defense electronics localization policies, though still faces challenges in developing comprehensive domestic supply chains for advanced substrates and components.

North America
The North American PCB & PCBA Market focuses on high-value, low-volume production for aerospace, defense, and medical applications. U.S. manufacturers lead in advanced packaging technologies and quick-turn prototyping services, supported by strong R&D ecosystems in Silicon Valley and Boston’s Route 128 corridor. Recent reshoring initiatives and CHIPS Act funding are strengthening domestic PCB capabilities, particularly for military-grade and high-frequency RF applications. The region maintains leadership in PCB design software and testing equipment, influencing global PCB & PCBA standards and manufacturing practices.

Europe
Europe’s PCB & PCBA Market emphasizes automotive and industrial applications, with Germany at the forefront of automotive electronics manufacturing. The region maintains strict quality standards and specializes in high-reliability multilayer boards for automotive systems and industrial automation. Eastern European countries are developing as cost-effective alternatives for PCBA services, while Western European firms invest in sustainable manufacturing practices and lead-free soldering technologies to meet stringent environmental regulations.

South America
The South American PCB & PCBA Market remains relatively small but shows growth potential in Brazil and Mexico, supported by expanding consumer electronics markets and proximity to North American supply chains. Local manufacturers primarily serve domestic demand, with limited capabilities in high-volume production. Regional trade agreements are helping develop more integrated electronics manufacturing ecosystems, though infrastructure challenges continue to constrain large-scale PCB fabrication investments.

Middle East & Africa
The Middle East & Africa region is developing PCB & PCBA capabilities through technology transfer initiatives and economic diversification programs. Israel leads in specialized military and telecommunications applications, while Gulf Cooperation Council countries are investing in electronics manufacturing zones. African nations show emerging potential for PCB assembly operations, particularly in North Africa, though the regional market remains highly dependent on imports for advanced PCB substrates and components.

Report Scope

This market research report provides a comprehensive analysis of the PCB & PCBA Market , covering the forecast period 2025–2033. It offers detailed insights into market dynamics, technological advancements, competitive landscape, and key trends shaping the industry.

Key focus areas of the report include:

  • Market Overview: The report begins with an overview outlining its current market scenario, key growth indicators, and industry transformation drivers. It discusses macroeconomic factors, demand–supply balance, regulatory landscape, and the strategic role of semiconductors in powering advancements across industries such as automotive, telecommunications, consumer electronics, and industrial automation.
  • Market Size & Forecast: Historical data and future projections for revenue, unit shipments, and market value across major regions and segments.
  • Segmentation Analysis: Detailed breakdown by product type, technology, application, and end-user industry to identify high-growth segments and investment opportunities.
  • Regional Insights: Insights into market performance across North America, Europe, Asia-Pacific, Latin America, and the Middle East & Africa, including country-level analysis where relevant.
  • Competitive Landscape: Profiles of leading market participants, including their product offerings, R&D focus, manufacturing capacity, pricing strategies, and recent developments such as mergers, acquisitions, and partnerships.
  • Technology Trends & Innovation: Assessment of emerging technologies, integration of AI/IoT, semiconductor design trends, fabrication techniques, and evolving industry standards.
  • Market Drivers & Restraints: Evaluation of factors driving market growth along with challenges, supply chain constraints, regulatory issues, and market-entry barriers.
  • Stakeholder Insights: Insights for component suppliers, OEMs, system integrators, investors, and policymakers regarding the evolving ecosystem and strategic opportunities.

Primary and secondary research methods are employed, including interviews with industry experts, data from verified sources, and real-time market intelligence to ensure the accuracy and reliability of the insights presented.

FREQUENTLY ASKED QUESTIONS:

What is the current market size of PCB & PCBA Market?

-> PCB & PCBA Market was valued at USD 70,810 million in 2025 and is projected to reach USD 90,010 million by 2033, exhibiting a CAGR of 3.6% during the forecast period.

Which key companies operate in PCB & PCBA Market?

-> Key players include Nippon Mektron, Unimicron, SEMCO, Young Poong Group, Ibiden, ZDT, Tripod, TTM, SEI, Daeduck Group, among others. Global top five manufacturers hold a share over 10%.

What are the key growth drivers?

-> Key growth drivers include increasing demand from communications and consumer electronics sectors, technological advancements in PCB manufacturing, and rising automotive electronics applications.

Which region dominates the market?

-> China is the largest market with about 50% share, followed by China Taiwan and South Korea with about 25% combined share.

What are the emerging trends?

-> Emerging trends include growth in HDI and flexible PCBs, increasing adoption of IC substrates, and rising demand for PCBAs in IoT devices.

PCB & PCBA Market, Global Business Strategies 2026-2033

Get Sample Report PDF for Exclusive Insights

Report Sample Includes

  • Table of Contents
  • List of Tables & Figures
  • Charts, Research Methodology, and more...
PDF Icon Download Sample Report PDF

Download Sample Report

Table of Content

1 Introduction to Research & Analysis Reports
1.1 PCB & PCBA Market Definition
1.2 Market Segments
1.2.1 Segment by Type
1.2.2 Segment by Application
1.3 Global PCB & PCBA Market Overview
1.4 Features & Benefits of This Report
1.5 Methodology & Sources of Information
1.5.1 Research Methodology
1.5.2 Research Process
1.5.3 Base Year
1.5.4 Report Assumptions & Caveats
2 Global PCB & PCBA Overall Market Size
2.1 Global PCB & PCBA Market Size: 2024 VS 2032
2.2 Global PCB & PCBA Market Size, Prospects & Forecasts: 2020-2032
2.3 Global PCB & PCBA Sales: 2020-2032
3 Company Landscape
3.1 Top PCB & PCBA Players in Global Market
3.2 Top Global PCB & PCBA Companies Ranked by Revenue
3.3 Global PCB & PCBA Revenue by Companies
3.4 Global PCB & PCBA Sales by Companies
3.5 Global PCB & PCBA Price by Manufacturer (2020-2025)
3.6 Top 3 and Top 5 PCB & PCBA Companies in Global Market, by Revenue in 2024
3.7 Global Manufacturers PCB & PCBA Product Type
3.8 Tier 1, Tier 2, and Tier 3 PCB & PCBA Players in Global Market
3.8.1 List of Global Tier 1 PCB & PCBA Companies
3.8.2 List of Global Tier 2 and Tier 3 PCB & PCBA Companies
4 Sights by Product
4.1 Overview
4.1.1 Segment by Type – Global PCB & PCBA Market Size Markets, 2024 & 2032
4.1.2 Rigid 1-2Sided
4.1.3 Standard Multilayer
4.1.4 HDI, Microvia or Build-Up
4.1.5 IC Substrate
4.1.6 Flexible Circuits
4.1.7 Rigid Flex
4.1.8 Others
4.2 Segment by Type – Global PCB & PCBA Revenue & Forecasts
4.2.1 Segment by Type – Global PCB & PCBA Revenue, 2020-2025
4.2.2 Segment by Type – Global PCB & PCBA Revenue, 2026-2032
4.2.3 Segment by Type – Global PCB & PCBA Revenue Market Share, 2020-2032
4.3 Segment by Type – Global PCB & PCBA Sales & Forecasts
4.3.1 Segment by Type – Global PCB & PCBA Sales, 2020-2025
4.3.2 Segment by Type – Global PCB & PCBA Sales, 2026-2032
4.3.3 Segment by Type – Global PCB & PCBA Sales Market Share, 2020-2032
4.4 Segment by Type – Global PCB & PCBA Price (Manufacturers Selling Prices), 2020-2032
5 Sights by Application
5.1 Overview
5.1.1 Segment by Application – Global PCB & PCBA Market Size, 2024 & 2032
5.1.2 Consumer Electronics
5.1.3 Computer
5.1.4 Communications
5.1.5 Industrial or Medical
5.1.6 Automotive
5.1.7 Military or Aerospace
5.1.8 Others
5.2 Segment by Application – Global PCB & PCBA Revenue & Forecasts
5.2.1 Segment by Application – Global PCB & PCBA Revenue, 2020-2025
5.2.2 Segment by Application – Global PCB & PCBA Revenue, 2026-2032
5.2.3 Segment by Application – Global PCB & PCBA Revenue Market Share, 2020-2032
5.3 Segment by Application – Global PCB & PCBA Sales & Forecasts
5.3.1 Segment by Application – Global PCB & PCBA Sales, 2020-2025
5.3.2 Segment by Application – Global PCB & PCBA Sales, 2026-2032
5.3.3 Segment by Application – Global PCB & PCBA Sales Market Share, 2020-2032
5.4 Segment by Application – Global PCB & PCBA Price (Manufacturers Selling Prices), 2020-2032
6 Sights by Region
6.1 By Region – Global PCB & PCBA Market Size, 2024 & 2032
6.2 By Region – Global PCB & PCBA Revenue & Forecasts
6.2.1 By Region – Global PCB & PCBA Revenue, 2020-2025
6.2.2 By Region – Global PCB & PCBA Revenue, 2026-2032
6.2.3 By Region – Global PCB & PCBA Revenue Market Share, 2020-2032
6.3 By Region – Global PCB & PCBA Sales & Forecasts
6.3.1 By Region – Global PCB & PCBA Sales, 2020-2025
6.3.2 By Region – Global PCB & PCBA Sales, 2026-2032
6.3.3 By Region – Global PCB & PCBA Sales Market Share, 2020-2032
6.4 North America
6.4.1 By Country – North America PCB & PCBA Revenue, 2020-2032
6.4.2 By Country – North America PCB & PCBA Sales, 2020-2032
6.4.3 United States PCB & PCBA Market Size, 2020-2032
6.4.4 Canada PCB & PCBA Market Size, 2020-2032
6.4.5 Mexico PCB & PCBA Market Size, 2020-2032
6.5 Europe
6.5.1 By Country – Europe PCB & PCBA Revenue, 2020-2032
6.5.2 By Country – Europe PCB & PCBA Sales, 2020-2032
6.5.3 Germany PCB & PCBA Market Size, 2020-2032
6.5.4 France PCB & PCBA Market Size, 2020-2032
6.5.5 U.K. PCB & PCBA Market Size, 2020-2032
6.5.6 Italy PCB & PCBA Market Size, 2020-2032
6.5.7 Russia PCB & PCBA Market Size, 2020-2032
6.5.8 Nordic Countries PCB & PCBA Market Size, 2020-2032
6.5.9 Benelux PCB & PCBA Market Size, 2020-2032
6.6 Asia
6.6.1 By Region – Asia PCB & PCBA Revenue, 2020-2032
6.6.2 By Region – Asia PCB & PCBA Sales, 2020-2032
6.6.3 China PCB & PCBA Market Size, 2020-2032
6.6.4 Japan PCB & PCBA Market Size, 2020-2032
6.6.5 South Korea PCB & PCBA Market Size, 2020-2032
6.6.6 Southeast Asia PCB & PCBA Market Size, 2020-2032
6.6.7 India PCB & PCBA Market Size, 2020-2032
6.7 South America
6.7.1 By Country – South America PCB & PCBA Revenue, 2020-2032
6.7.2 By Country – South America PCB & PCBA Sales, 2020-2032
6.7.3 Brazil PCB & PCBA Market Size, 2020-2032
6.7.4 Argentina PCB & PCBA Market Size, 2020-2032
6.8 Middle East & Africa
6.8.1 By Country – Middle East & Africa PCB & PCBA Revenue, 2020-2032
6.8.2 By Country – Middle East & Africa PCB & PCBA Sales, 2020-2032
6.8.3 Turkey PCB & PCBA Market Size, 2020-2032
6.8.4 Israel PCB & PCBA Market Size, 2020-2032
6.8.5 Saudi Arabia PCB & PCBA Market Size, 2020-2032
6.8.6 UAE PCB & PCBA Market Size, 2020-2032
7 Manufacturers & Brands Profiles
7.1 Nippon Mektron
7.1.1 Nippon Mektron Company Summary
7.1.2 Nippon Mektron Business Overview
7.1.3 Nippon Mektron PCB & PCBA Major Product Offerings
7.1.4 Nippon Mektron PCB & PCBA Sales and Revenue in Global (2020-2025)
7.1.5 Nippon Mektron Key News & Latest Developments
7.2 Unimicron
7.2.1 Unimicron Company Summary
7.2.2 Unimicron Business Overview
7.2.3 Unimicron PCB & PCBA Major Product Offerings
7.2.4 Unimicron PCB & PCBA Sales and Revenue in Global (2020-2025)
7.2.5 Unimicron Key News & Latest Developments
7.3 SEMCO
7.3.1 SEMCO Company Summary
7.3.2 SEMCO Business Overview
7.3.3 SEMCO PCB & PCBA Major Product Offerings
7.3.4 SEMCO PCB & PCBA Sales and Revenue in Global (2020-2025)
7.3.5 SEMCO Key News & Latest Developments
7.4 Young Poong Group
7.4.1 Young Poong Group Company Summary
7.4.2 Young Poong Group Business Overview
7.4.3 Young Poong Group PCB & PCBA Major Product Offerings
7.4.4 Young Poong Group PCB & PCBA Sales and Revenue in Global (2020-2025)
7.4.5 Young Poong Group Key News & Latest Developments
7.5 Ibiden
7.5.1 Ibiden Company Summary
7.5.2 Ibiden Business Overview
7.5.3 Ibiden PCB & PCBA Major Product Offerings
7.5.4 Ibiden PCB & PCBA Sales and Revenue in Global (2020-2025)
7.5.5 Ibiden Key News & Latest Developments
7.6 ZDT
7.6.1 ZDT Company Summary
7.6.2 ZDT Business Overview
7.6.3 ZDT PCB & PCBA Major Product Offerings
7.6.4 ZDT PCB & PCBA Sales and Revenue in Global (2020-2025)
7.6.5 ZDT Key News & Latest Developments
7.7 Tripod
7.7.1 Tripod Company Summary
7.7.2 Tripod Business Overview
7.7.3 Tripod PCB & PCBA Major Product Offerings
7.7.4 Tripod PCB & PCBA Sales and Revenue in Global (2020-2025)
7.7.5 Tripod Key News & Latest Developments
7.8 TTM
7.8.1 TTM Company Summary
7.8.2 TTM Business Overview
7.8.3 TTM PCB & PCBA Major Product Offerings
7.8.4 TTM PCB & PCBA Sales and Revenue in Global (2020-2025)
7.8.5 TTM Key News & Latest Developments
7.9 SEI
7.9.1 SEI Company Summary
7.9.2 SEI Business Overview
7.9.3 SEI PCB & PCBA Major Product Offerings
7.9.4 SEI PCB & PCBA Sales and Revenue in Global (2020-2025)
7.9.5 SEI Key News & Latest Developments
7.10 Daeduck Group
7.10.1 Daeduck Group Company Summary
7.10.2 Daeduck Group Business Overview
7.10.3 Daeduck Group PCB & PCBA Major Product Offerings
7.10.4 Daeduck Group PCB & PCBA Sales and Revenue in Global (2020-2025)
7.10.5 Daeduck Group Key News & Latest Developments
7.11 HannStar Board (GBM)
7.11.1 HannStar Board (GBM) Company Summary
7.11.2 HannStar Board (GBM) Business Overview
7.11.3 HannStar Board (GBM) PCB & PCBA Major Product Offerings
7.11.4 HannStar Board (GBM) PCB & PCBA Sales and Revenue in Global (2020-2025)
7.11.5 HannStar Board (GBM) Key News & Latest Developments
7.12 Nanya PCB
7.12.1 Nanya PCB Company Summary
7.12.2 Nanya PCB Business Overview
7.12.3 Nanya PCB PCB & PCBA Major Product Offerings
7.12.4 Nanya PCB PCB & PCBA Sales and Revenue in Global (2020-2025)
7.12.5 Nanya PCB Key News & Latest Developments
7.13 CMK Corporation
7.13.1 CMK Corporation Company Summary
7.13.2 CMK Corporation Business Overview
7.13.3 CMK Corporation PCB & PCBA Major Product Offerings
7.13.4 CMK Corporation PCB & PCBA Sales and Revenue in Global (2020-2025)
7.13.5 CMK Corporation Key News & Latest Developments
7.14 Shinko Electric Ind
7.14.1 Shinko Electric Ind Company Summary
7.14.2 Shinko Electric Ind Business Overview
7.14.3 Shinko Electric Ind PCB & PCBA Major Product Offerings
7.14.4 Shinko Electric Ind PCB & PCBA Sales and Revenue in Global (2020-2025)
7.14.5 Shinko Electric Ind Key News & Latest Developments
7.15 Compeq
7.15.1 Compeq Company Summary
7.15.2 Compeq Business Overview
7.15.3 Compeq PCB & PCBA Major Product Offerings
7.15.4 Compeq PCB & PCBA Sales and Revenue in Global (2020-2025)
7.15.5 Compeq Key News & Latest Developments
7.16 AT&S
7.16.1 AT&S Company Summary
7.16.2 AT&S Business Overview
7.16.3 AT&S PCB & PCBA Major Product Offerings
7.16.4 AT&S PCB & PCBA Sales and Revenue in Global (2020-2025)
7.16.5 AT&S Key News & Latest Developments
7.17 Kingboard
7.17.1 Kingboard Company Summary
7.17.2 Kingboard Business Overview
7.17.3 Kingboard PCB & PCBA Major Product Offerings
7.17.4 Kingboard PCB & PCBA Sales and Revenue in Global (2020-2025)
7.17.5 Kingboard Key News & Latest Developments
7.18 Ellington
7.18.1 Ellington Company Summary
7.18.2 Ellington Business Overview
7.18.3 Ellington PCB & PCBA Major Product Offerings
7.18.4 Ellington PCB & PCBA Sales and Revenue in Global (2020-2025)
7.18.5 Ellington Key News & Latest Developments
7.19 Topcb
7.19.1 Topcb Company Summary
7.19.2 Topcb Business Overview
7.19.3 Topcb PCB & PCBA Major Product Offerings
7.19.4 Topcb PCB & PCBA Sales and Revenue in Global (2020-2025)
7.19.5 Topcb Key News & Latest Developments
7.20 DSBJ
7.20.1 DSBJ Company Summary
7.20.2 DSBJ Business Overview
7.20.3 DSBJ PCB & PCBA Major Product Offerings
7.20.4 DSBJ PCB & PCBA Sales and Revenue in Global (2020-2025)
7.20.5 DSBJ Key News & Latest Developments
7.21 Kinwong
7.21.1 Kinwong Company Summary
7.21.2 Kinwong Business Overview
7.21.3 Kinwong PCB & PCBA Major Product Offerings
7.21.4 Kinwong PCB & PCBA Sales and Revenue in Global (2020-2025)
7.21.5 Kinwong Key News & Latest Developments
7.22 Samsung
7.22.1 Samsung Company Summary
7.22.2 Samsung Business Overview
7.22.3 Samsung PCB & PCBA Major Product Offerings
7.22.4 Samsung PCB & PCBA Sales and Revenue in Global (2020-2025)
7.22.5 Samsung Key News & Latest Developments
7.23 Wus
7.23.1 Wus Company Summary
7.23.2 Wus Business Overview
7.23.3 Wus PCB & PCBA Major Product Offerings
7.23.4 Wus PCB & PCBA Sales and Revenue in Global (2020-2025)
7.23.5 Wus Key News & Latest Developments
7.24 Fujikura
7.24.1 Fujikura Company Summary
7.24.2 Fujikura Business Overview
7.24.3 Fujikura PCB & PCBA Major Product Offerings
7.24.4 Fujikura PCB & PCBA Sales and Revenue in Global (2020-2025)
7.24.5 Fujikura Key News & Latest Developments
7.25 MEIKO ELECTRONICS
7.25.1 MEIKO ELECTRONICS Company Summary
7.25.2 MEIKO ELECTRONICS Business Overview
7.25.3 MEIKO ELECTRONICS PCB & PCBA Major Product Offerings
7.25.4 MEIKO ELECTRONICS PCB & PCBA Sales and Revenue in Global (2020-2025)
7.25.5 MEIKO ELECTRONICS Key News & Latest Developments
7.26 SCC
7.26.1 SCC Company Summary
7.26.2 SCC Business Overview
7.26.3 SCC PCB & PCBA Major Product Offerings
7.26.4 SCC PCB & PCBA Sales and Revenue in Global (2020-2025)
7.26.5 SCC Key News & Latest Developments
8 Global PCB & PCBA Production Capacity, Analysis
8.1 Global PCB & PCBA Production Capacity, 2020-2032
8.2 PCB & PCBA Production Capacity of Key Manufacturers in Global Market
8.3 Global PCB & PCBA Production by Region
9 Key Market Trends, Opportunity, Drivers and Restraints
9.1 Market Opportunities & Trends
9.2 Market Drivers
9.3 Market Restraints
10 PCB & PCBA Supply Chain Analysis
10.1 PCB & PCBA Industry Value Chain
10.2 PCB & PCBA Upstream Market
10.3 PCB & PCBA Downstream and Clients
10.4 Marketing Channels Analysis
10.4.1 Marketing Channels
10.4.2 PCB & PCBA Distributors and Sales Agents in Global
11 Conclusion
12 Appendix
12.1 Note
12.2 Examples of Clients
12.3 DisclaimerList of Tables
Table 1. Key Players of PCB & PCBA in Global Market
Table 2. Top PCB & PCBA Players in Global Market, Ranking by Revenue (2024)
Table 3. Global PCB & PCBA Revenue by Companies, (US$, Mn), 2020-2025
Table 4. Global PCB & PCBA Revenue Share by Companies, 2020-2025
Table 5. Global PCB & PCBA Sales by Companies, (K Sqm), 2020-2025
Table 6. Global PCB & PCBA Sales Share by Companies, 2020-2025
Table 7. Key Manufacturers PCB & PCBA Price (2020-2025) & (USD/sqm)
Table 8. Global Manufacturers PCB & PCBA Product Type
Table 9. List of Global Tier 1 PCB & PCBA Companies, Revenue (US$, Mn) in 2024 and Market Share
Table 10. List of Global Tier 2 and Tier 3 PCB & PCBA Companies, Revenue (US$, Mn) in 2024 and Market Share
Table 11. Segment by Type – Global PCB & PCBA Revenue, (US$, Mn), 2024 & 2032
Table 12. Segment by Type – Global PCB & PCBA Revenue (US$, Mn), 2020-2025
Table 13. Segment by Type – Global PCB & PCBA Revenue (US$, Mn), 2026-2032
Table 14. Segment by Type – Global PCB & PCBA Sales (K Sqm), 2020-2025
Table 15. Segment by Type – Global PCB & PCBA Sales (K Sqm), 2026-2032
Table 16. Segment by Application – Global PCB & PCBA Revenue, (US$, Mn), 2024 & 2032
Table 17. Segment by Application – Global PCB & PCBA Revenue, (US$, Mn), 2020-2025
Table 18. Segment by Application – Global PCB & PCBA Revenue, (US$, Mn), 2026-2032
Table 19. Segment by Application – Global PCB & PCBA Sales, (K Sqm), 2020-2025
Table 20. Segment by Application – Global PCB & PCBA Sales, (K Sqm), 2026-2032
Table 21. By Region – Global PCB & PCBA Revenue, (US$, Mn), 2025-2032
Table 22. By Region – Global PCB & PCBA Revenue, (US$, Mn), 2020-2025
Table 23. By Region – Global PCB & PCBA Revenue, (US$, Mn), 2026-2032
Table 24. By Region – Global PCB & PCBA Sales, (K Sqm), 2020-2025
Table 25. By Region – Global PCB & PCBA Sales, (K Sqm), 2026-2032
Table 26. By Country – North America PCB & PCBA Revenue, (US$, Mn), 2020-2025
Table 27. By Country – North America PCB & PCBA Revenue, (US$, Mn), 2026-2032
Table 28. By Country – North America PCB & PCBA Sales, (K Sqm), 2020-2025
Table 29. By Country – North America PCB & PCBA Sales, (K Sqm), 2026-2032
Table 30. By Country – Europe PCB & PCBA Revenue, (US$, Mn), 2020-2025
Table 31. By Country – Europe PCB & PCBA Revenue, (US$, Mn), 2026-2032
Table 32. By Country – Europe PCB & PCBA Sales, (K Sqm), 2020-2025
Table 33. By Country – Europe PCB & PCBA Sales, (K Sqm), 2026-2032
Table 34. By Region – Asia PCB & PCBA Revenue, (US$, Mn), 2020-2025
Table 35. By Region – Asia PCB & PCBA Revenue, (US$, Mn), 2026-2032
Table 36. By Region – Asia PCB & PCBA Sales, (K Sqm), 2020-2025
Table 37. By Region – Asia PCB & PCBA Sales, (K Sqm), 2026-2032
Table 38. By Country – South America PCB & PCBA Revenue, (US$, Mn), 2020-2025
Table 39. By Country – South America PCB & PCBA Revenue, (US$, Mn), 2026-2032
Table 40. By Country – South America PCB & PCBA Sales, (K Sqm), 2020-2025
Table 41. By Country – South America PCB & PCBA Sales, (K Sqm), 2026-2032
Table 42. By Country – Middle East & Africa PCB & PCBA Revenue, (US$, Mn), 2020-2025
Table 43. By Country – Middle East & Africa PCB & PCBA Revenue, (US$, Mn), 2026-2032
Table 44. By Country – Middle East & Africa PCB & PCBA Sales, (K Sqm), 2020-2025
Table 45. By Country – Middle East & Africa PCB & PCBA Sales, (K Sqm), 2026-2032
Table 46. Nippon Mektron Company Summary
Table 47. Nippon Mektron PCB & PCBA Product Offerings
Table 48. Nippon Mektron PCB & PCBA Sales (K Sqm), Revenue (US$, Mn) and Average Price (USD/sqm) & (2020-2025)
Table 49. Nippon Mektron Key News & Latest Developments
Table 50. Unimicron Company Summary
Table 51. Unimicron PCB & PCBA Product Offerings
Table 52. Unimicron PCB & PCBA Sales (K Sqm), Revenue (US$, Mn) and Average Price (USD/sqm) & (2020-2025)
Table 53. Unimicron Key News & Latest Developments
Table 54. SEMCO Company Summary
Table 55. SEMCO PCB & PCBA Product Offerings
Table 56. SEMCO PCB & PCBA Sales (K Sqm), Revenue (US$, Mn) and Average Price (USD/sqm) & (2020-2025)
Table 57. SEMCO Key News & Latest Developments
Table 58. Young Poong Group Company Summary
Table 59. Young Poong Group PCB & PCBA Product Offerings
Table 60. Young Poong Group PCB & PCBA Sales (K Sqm), Revenue (US$, Mn) and Average Price (USD/sqm) & (2020-2025)
Table 61. Young Poong Group Key News & Latest Developments
Table 62. Ibiden Company Summary
Table 63. Ibiden PCB & PCBA Product Offerings
Table 64. Ibiden PCB & PCBA Sales (K Sqm), Revenue (US$, Mn) and Average Price (USD/sqm) & (2020-2025)
Table 65. Ibiden Key News & Latest Developments
Table 66. ZDT Company Summary
Table 67. ZDT PCB & PCBA Product Offerings
Table 68. ZDT PCB & PCBA Sales (K Sqm), Revenue (US$, Mn) and Average Price (USD/sqm) & (2020-2025)
Table 69. ZDT Key News & Latest Developments
Table 70. Tripod Company Summary
Table 71. Tripod PCB & PCBA Product Offerings
Table 72. Tripod PCB & PCBA Sales (K Sqm), Revenue (US$, Mn) and Average Price (USD/sqm) & (2020-2025)
Table 73. Tripod Key News & Latest Developments
Table 74. TTM Company Summary
Table 75. TTM PCB & PCBA Product Offerings
Table 76. TTM PCB & PCBA Sales (K Sqm), Revenue (US$, Mn) and Average Price (USD/sqm) & (2020-2025)
Table 77. TTM Key News & Latest Developments
Table 78. SEI Company Summary
Table 79. SEI PCB & PCBA Product Offerings
Table 80. SEI PCB & PCBA Sales (K Sqm), Revenue (US$, Mn) and Average Price (USD/sqm) & (2020-2025)
Table 81. SEI Key News & Latest Developments
Table 82. Daeduck Group Company Summary
Table 83. Daeduck Group PCB & PCBA Product Offerings
Table 84. Daeduck Group PCB & PCBA Sales (K Sqm), Revenue (US$, Mn) and Average Price (USD/sqm) & (2020-2025)
Table 85. Daeduck Group Key News & Latest Developments
Table 86. HannStar Board (GBM) Company Summary
Table 87. HannStar Board (GBM) PCB & PCBA Product Offerings
Table 88. HannStar Board (GBM) PCB & PCBA Sales (K Sqm), Revenue (US$, Mn) and Average Price (USD/sqm) & (2020-2025)
Table 89. HannStar Board (GBM) Key News & Latest Developments
Table 90. Nanya PCB Company Summary
Table 91. Nanya PCB PCB & PCBA Product Offerings
Table 92. Nanya PCB PCB & PCBA Sales (K Sqm), Revenue (US$, Mn) and Average Price (USD/sqm) & (2020-2025)
Table 93. Nanya PCB Key News & Latest Developments
Table 94. CMK Corporation Company Summary
Table 95. CMK Corporation PCB & PCBA Product Offerings
Table 96. CMK Corporation PCB & PCBA Sales (K Sqm), Revenue (US$, Mn) and Average Price (USD/sqm) & (2020-2025)
Table 97. CMK Corporation Key News & Latest Developments
Table 98. Shinko Electric Ind Company Summary
Table 99. Shinko Electric Ind PCB & PCBA Product Offerings
Table 100. Shinko Electric Ind PCB & PCBA Sales (K Sqm), Revenue (US$, Mn) and Average Price (USD/sqm) & (2020-2025)
Table 101. Shinko Electric Ind Key News & Latest Developments
Table 102. Compeq Company Summary
Table 103. Compeq PCB & PCBA Product Offerings
Table 104. Compeq PCB & PCBA Sales (K Sqm), Revenue (US$, Mn) and Average Price (USD/sqm) & (2020-2025)
Table 105. Compeq Key News & Latest Developments
Table 106. AT&S Company Summary
Table 107. AT&S PCB & PCBA Product Offerings
Table 108. AT&S PCB & PCBA Sales (K Sqm), Revenue (US$, Mn) and Average Price (USD/sqm) & (2020-2025)
Table 109. AT&S Key News & Latest Developments
Table 110. Kingboard Company Summary
Table 111. Kingboard PCB & PCBA Product Offerings
Table 112. Kingboard PCB & PCBA Sales (K Sqm), Revenue (US$, Mn) and Average Price (USD/sqm) & (2020-2025)
Table 113. Kingboard Key News & Latest Developments
Table 114. Ellington Company Summary
Table 115. Ellington PCB & PCBA Product Offerings
Table 116. Ellington PCB & PCBA Sales (K Sqm), Revenue (US$, Mn) and Average Price (USD/sqm) & (2020-2025)
Table 117. Ellington Key News & Latest Developments
Table 118. Topcb Company Summary
Table 119. Topcb PCB & PCBA Product Offerings
Table 120. Topcb PCB & PCBA Sales (K Sqm), Revenue (US$, Mn) and Average Price (USD/sqm) & (2020-2025)
Table 121. Topcb Key News & Latest Developments
Table 122. DSBJ Company Summary
Table 123. DSBJ PCB & PCBA Product Offerings
Table 124. DSBJ PCB & PCBA Sales (K Sqm), Revenue (US$, Mn) and Average Price (USD/sqm) & (2020-2025)
Table 125. DSBJ Key News & Latest Developments
Table 126. Kinwong Company Summary
Table 127. Kinwong PCB & PCBA Product Offerings
Table 128. Kinwong PCB & PCBA Sales (K Sqm), Revenue (US$, Mn) and Average Price (USD/sqm) & (2020-2025)
Table 129. Kinwong Key News & Latest Developments
Table 130. Samsung Company Summary
Table 131. Samsung PCB & PCBA Product Offerings
Table 132. Samsung PCB & PCBA Sales (K Sqm), Revenue (US$, Mn) and Average Price (USD/sqm) & (2020-2025)
Table 133. Samsung Key News & Latest Developments
Table 134. Wus Company Summary
Table 135. Wus PCB & PCBA Product Offerings
Table 136. Wus PCB & PCBA Sales (K Sqm), Revenue (US$, Mn) and Average Price (USD/sqm) & (2020-2025)
Table 137. Wus Key News & Latest Developments
Table 138. Fujikura Company Summary
Table 139. Fujikura PCB & PCBA Product Offerings
Table 140. Fujikura PCB & PCBA Sales (K Sqm), Revenue (US$, Mn) and Average Price (USD/sqm) & (2020-2025)
Table 141. Fujikura Key News & Latest Developments
Table 142. MEIKO ELECTRONICS Company Summary
Table 143. MEIKO ELECTRONICS PCB & PCBA Product Offerings
Table 144. MEIKO ELECTRONICS PCB & PCBA Sales (K Sqm), Revenue (US$, Mn) and Average Price (USD/sqm) & (2020-2025)
Table 145. MEIKO ELECTRONICS Key News & Latest Developments
Table 146. SCC Company Summary
Table 147. SCC PCB & PCBA Product Offerings
Table 148. SCC PCB & PCBA Sales (K Sqm), Revenue (US$, Mn) and Average Price (USD/sqm) & (2020-2025)
Table 149. SCC Key News & Latest Developments
Table 150. PCB & PCBA Capacity of Key Manufacturers in Global Market, 2023-2025 (K Sqm)
Table 151. Global PCB & PCBA Capacity Market Share of Key Manufacturers, 2023-2025
Table 152. Global PCB & PCBA Production by Region, 2020-2025 (K Sqm)
Table 153. Global PCB & PCBA Production by Region, 2026-2032 (K Sqm)
Table 154. PCB & PCBA Market Opportunities & Trends in Global Market
Table 155. PCB & PCBA Market Drivers in Global Market
Table 156. PCB & PCBA Market Restraints in Global Market
Table 157. PCB & PCBA Raw Materials
Table 158. PCB & PCBA Raw Materials Suppliers in Global Market
Table 159. Typical PCB & PCBA Downstream
Table 160. PCB & PCBA Downstream Clients in Global Market
Table 161. PCB & PCBA Distributors and Sales Agents in Global Market

List of Figures
Figure 1. PCB & PCBA Product Picture
Figure 2. PCB & PCBA Segment by Type in 2024
Figure 3. PCB & PCBA Segment by Application in 2024
Figure 4. Global PCB & PCBA Market Overview: 2024
Figure 5. Key Caveats
Figure 6. Global PCB & PCBA Market Size: 2024 VS 2032 (US$, Mn)
Figure 7. Global PCB & PCBA Revenue: 2020-2032 (US$, Mn)
Figure 8. PCB & PCBA Sales in Global Market: 2020-2032 (K Sqm)
Figure 9. The Top 3 and 5 Players Market Share by PCB & PCBA Revenue in 2024
Figure 10. Segment by Type – Global PCB & PCBA Revenue, (US$, Mn), 2024 & 2032
Figure 11. Segment by Type – Global PCB & PCBA Revenue Market Share, 2020-2032
Figure 12. Segment by Type – Global PCB & PCBA Sales Market Share, 2020-2032
Figure 13. Segment by Type – Global PCB & PCBA Price (USD/sqm), 2020-2032
Figure 14. Segment by Application – Global PCB & PCBA Revenue, (US$, Mn), 2024 & 2032
Figure 15. Segment by Application – Global PCB & PCBA Revenue Market Share, 2020-2032
Figure 16. Segment by Application – Global PCB & PCBA Sales Market Share, 2020-2032
Figure 17. Segment by Application -Global PCB & PCBA Price (USD/sqm), 2020-2032
Figure 18. By Region – Global PCB & PCBA Revenue, (US$, Mn), 2025 & 2032
Figure 19. By Region – Global PCB & PCBA Revenue Market Share, 2020 VS 2024 VS 2032
Figure 20. By Region – Global PCB & PCBA Revenue Market Share, 2020-2032
Figure 21. By Region – Global PCB & PCBA Sales Market Share, 2020-2032
Figure 22. By Country – North America PCB & PCBA Revenue Market Share, 2020-2032
Figure 23. By Country – North America PCB & PCBA Sales Market Share, 2020-2032
Figure 24. United States PCB & PCBA Revenue, (US$, Mn), 2020-2032
Figure 25. Canada PCB & PCBA Revenue, (US$, Mn), 2020-2032
Figure 26. Mexico PCB & PCBA Revenue, (US$, Mn), 2020-2032
Figure 27. By Country – Europe PCB & PCBA Revenue Market Share, 2020-2032
Figure 28. By Country – Europe PCB & PCBA Sales Market Share, 2020-2032
Figure 29. Germany PCB & PCBA Revenue, (US$, Mn), 2020-2032
Figure 30. France PCB & PCBA Revenue, (US$, Mn), 2020-2032
Figure 31. U.K. PCB & PCBA Revenue, (US$, Mn), 2020-2032
Figure 32. Italy PCB & PCBA Revenue, (US$, Mn), 2020-2032
Figure 33. Russia PCB & PCBA Revenue, (US$, Mn), 2020-2032
Figure 34. Nordic Countries PCB & PCBA Revenue, (US$, Mn), 2020-2032
Figure 35. Benelux PCB & PCBA Revenue, (US$, Mn), 2020-2032
Figure 36. By Region – Asia PCB & PCBA Revenue Market Share, 2020-2032
Figure 37. By Region – Asia PCB & PCBA Sales Market Share, 2020-2032
Figure 38. China PCB & PCBA Revenue, (US$, Mn), 2020-2032
Figure 39. Japan PCB & PCBA Revenue, (US$, Mn), 2020-2032
Figure 40. South Korea PCB & PCBA Revenue, (US$, Mn), 2020-2032
Figure 41. Southeast Asia PCB & PCBA Revenue, (US$, Mn), 2020-2032
Figure 42. India PCB & PCBA Revenue, (US$, Mn), 2020-2032
Figure 43. By Country – South America PCB & PCBA Revenue Market Share, 2020-2032
Figure 44. By Country – South America PCB & PCBA Sales, Market Share, 2020-2032
Figure 45. Brazil PCB & PCBA Revenue, (US$, Mn), 2020-2032
Figure 46. Argentina PCB & PCBA Revenue, (US$, Mn), 2020-2032
Figure 47. By Country – Middle East & Africa PCB & PCBA Revenue, Market Share, 2020-2032
Figure 48. By Country – Middle East & Africa PCB & PCBA Sales, Market Share, 2020-2032
Figure 49. Turkey PCB & PCBA Revenue, (US$, Mn), 2020-2032
Figure 50. Israel PCB & PCBA Revenue, (US$, Mn), 2020-2032
Figure 51. Saudi Arabia PCB & PCBA Revenue, (US$, Mn), 2020-2032
Figure 52. UAE PCB & PCBA Revenue, (US$, Mn), 2020-2032
Figure 53. Global PCB & PCBA Production Capacity (K Sqm), 2020-2032
Figure 54. The Percentage of Production PCB & PCBA by Region, 2024 VS 2032
Figure 55. PCB & PCBA Industry Value Chain
Figure 56. Marketing Channels