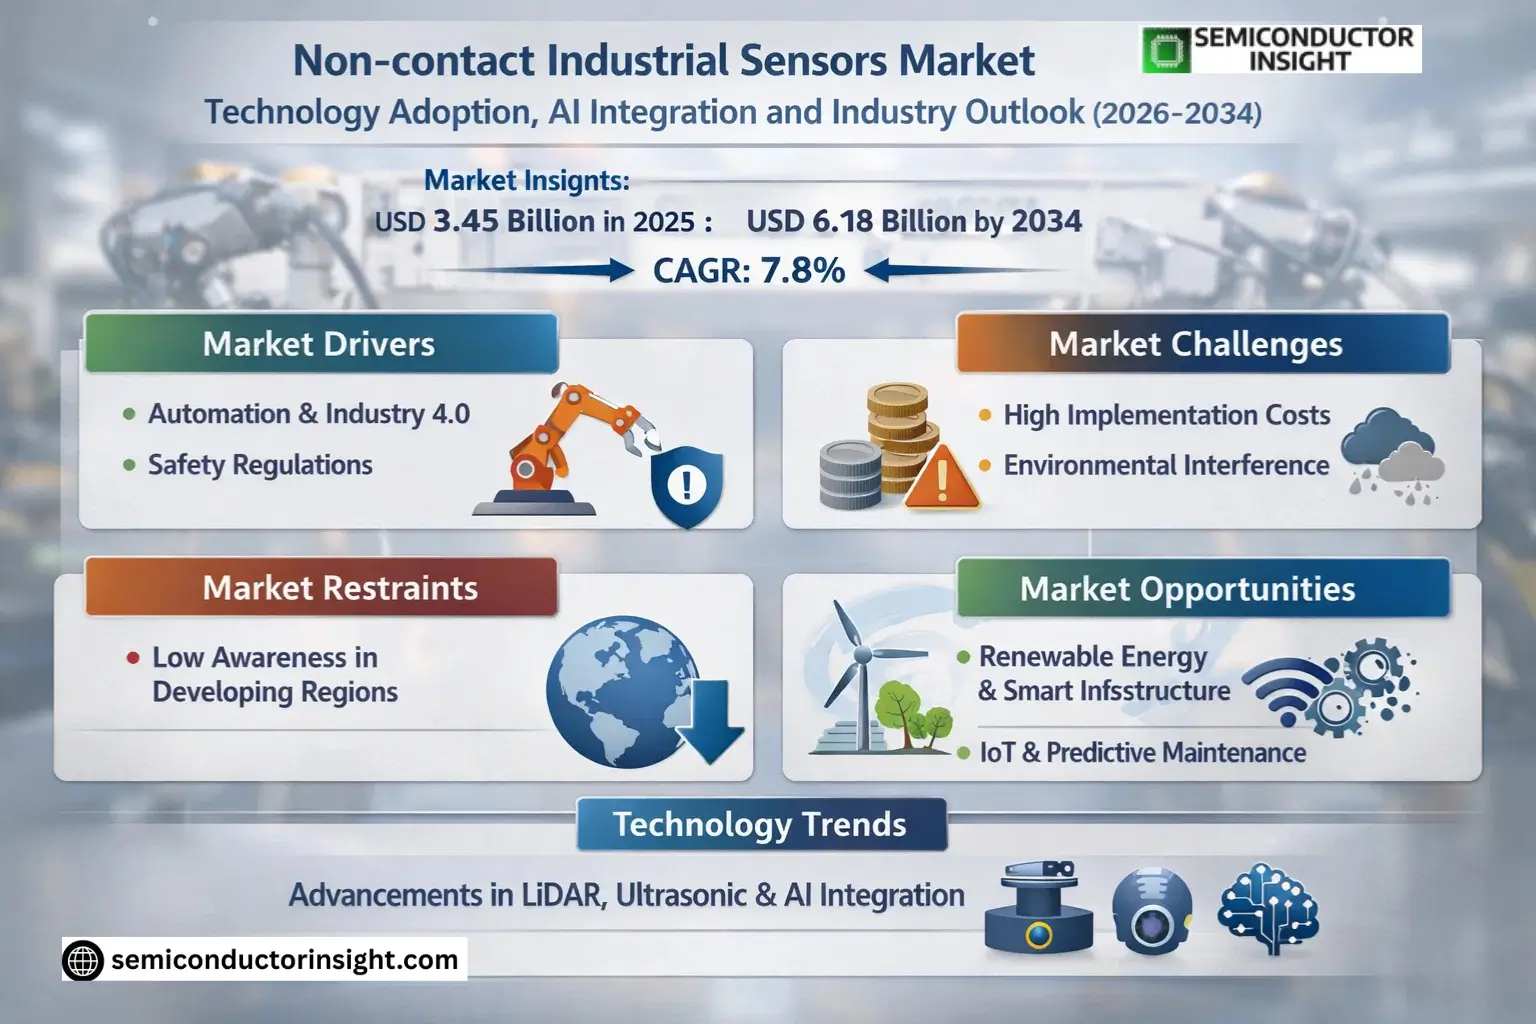
Non-contact Industrial Sensors Market Technology Adoption, AI Integration and Industry Outlook (2026-2034)

Non-contact Industrial Sensors Market size was valued at USD 3.45 billion in 2025. The market is projected to grow from USD 3.72 billion in 2026 to USD 6.18 billion by 2034, exhibiting a CAGR of 7.8% during the forecast period.

PDF Icon Download Sample Report PDF
  • Quick Dispatch

    All Orders

  • Secure Payment

    100% Secure Payment

Price range: $1,500.00 through $4,250.00

Clear

Market Insights

Global Non-contact Industrial Sensors Market size was valued at USD 3.45 billion in 2025. The market is projected to grow from USD 3.72 billion in 2026 to USD 6.18 billion by 2034, exhibiting a CAGR of 7.8% during the forecast period.

Non-contact industrial sensors are advanced devices used to detect and measure physical parameters such as distance, temperature, pressure, and motion without direct physical contact with the target object. These sensors include technologies like ultrasonic, infrared, capacitive, inductive, and optical sensors, which are widely employed in automation, manufacturing, and process control applications.

The market is experiencing robust growth due to increasing demand for automation across industries such as automotive, aerospace, and pharmaceuticals. Furthermore, advancements in Industry 4.0 and IoT integration are accelerating adoption rates. Key players like Rockwell Automation, Honeywell, and Siemens are driving innovation through strategic collaborations and product enhancements to meet evolving industry requirements.

Non-contact Industrial Sensors Market Size & Forecast

MARKET DRIVERS

Growing Demand for Automation in Manufacturing

The increasing adoption of Industry 4.0 technologies is driving significant growth in the Non-contact Industrial Sensors Market. Manufacturers are investing heavily in automation to improve efficiency, precision, and productivity. Non-contact sensors enable real-time monitoring without physical interference, reducing downtime and maintenance costs.

Stringent Safety Regulations

Government regulations mandating workplace safety and equipment monitoring are accelerating deployment of non-contact sensing solutions. These sensors help prevent accidents by detecting proximity, temperature, and abnormal vibrations in hazardous environments.

Advancements in sensor technologies, including LiDAR and ultrasonic sensing, are further expanding application possibilities across industries.

MARKET CHALLENGES

High Initial Implementation Costs

The sophisticated technology behind Non-contact Industrial Sensors often comes with premium pricing, creating barriers for small and medium enterprises. Integration with existing systems requires additional investment in compatible infrastructure.

Other Challenges

Environmental Interference
Non-contact sensors can be affected by dust, extreme temperatures, or electromagnetic fields in harsh industrial environments, potentially impacting accuracy.

Technical Complexity
Deploying and calibrating advanced sensing systems requires specialized expertise, creating a skills gap challenge for many organizations.

MARKET RESTRAINTS

Limited Awareness in Developing Regions

While mature markets rapidly adopt Non-contact Industrial Sensors, emerging economies show slower uptake due to limited technical knowledge and preference for traditional contact-based solutions. This regional imbalance temporarily restricts market expansion.

MARKET OPPORTUNITIES

Expansion in Emerging Applications

Non-contact Industrial Sensors Market is finding new growth avenues in renewable energy systems, smart infrastructure, and autonomous material handling. Predictive maintenance applications alone are expected to create USD 2.3 billion in sensor demand by 2028.

Miniaturization and IoT Integration

Development of compact, wireless sensor nodes compatible with Industrial IoT platforms presents significant opportunities. These innovations enable cost-effective deployment across distributed manufacturing networks.

Non-contact Industrial Sensors Market Trends
Advancements in Sensor Technology Driving Market Growth

Non-contact Industrial Sensors Market is witnessing significant growth due to technological advancements in sensing capabilities. Manufacturers are developing sensors with higher precision, faster response times, and improved reliability for harsh industrial environments. Key players like Rockwell Automation and Siemens are investing heavily in R&D to integrate IoT connectivity and AI-based analytics into their sensor solutions.

Other Trends

Increasing Adoption in Pharmaceuticals and Chemicals

The pharmaceuticals and chemicals industries are rapidly adopting non-contact sensors for process monitoring and quality control. These sectors demand contamination-free measurement solutions that can maintain sterile environments while providing accurate real-time data. Temperature sensors and level sensors are particularly crucial for maintaining strict production standards in these sensitive applications.

Expansion in Emerging Markets

Developing economies in Asia, particularly China and India, are showing strong growth potential for Non-contact Industrial Sensors. The expansion of manufacturing facilities and increasing automation in these regions is driving demand. Local governments are implementing policies to encourage smart manufacturing, creating favorable conditions for sensor technology adoption across various industrial segments.

Integration with Industrial IoT Platforms

A key development in the Non-contact Industrial Sensors market is the seamless integration with Industrial IoT (IIoT) platforms. Leading manufacturers are offering sensors with built-in connectivity options that enable predictive maintenance and remote monitoring capabilities. This integration is transforming traditional manufacturing processes by providing actionable insights from sensor data analytics.

Focus on Energy Efficiency and Sustainability

Industries are increasingly prioritizing energy-efficient solutions, driving innovation in Non-contact Industrial Sensors. New sensor designs consume less power while maintaining high accuracy, helping manufacturers reduce their overall energy consumption. This trend aligns with global sustainability initiatives and makes sensor technology more appealing to environmentally conscious industries.

COMPETITIVE LANDSCAPE

Key Industry Players

Global Non-contact Sensor Market Dominated by Multinational Industrial Giants

Non-contact Industrial Sensors Market is led by established industrial automation and semiconductor players, with Rockwell Automation, Honeywell, and Siemens holding significant market shares. These companies leverage their extensive distribution networks and integrated industrial solutions to maintain dominance. The market exhibits moderate consolidation, with the top five players accounting for approximately 40% of global revenue, while specialized sensor manufacturers capture niche applications through advanced technologies.

Niche players like Sensirion and Omega Engineering compete through specialized offerings in precision measurement and harsh environment applications. Semiconductor companies including STMicroelectronics and Texas Instruments provide critical components, while measurement specialists like Dwyer Instruments focus on vertical-specific solutions. Recent years have seen increased competition from Asian manufacturers expanding their technological capabilities in cost-sensitive markets.

List of Key Non-contact Industrial Sensor Companies Profiled

Segment Analysis:

Segment Category Sub-Segments Key Insights
By Type
  • Level Sensor
  • Temperature Sensor
  • Pressure Sensor
  • Others
Level Sensors dominate the market due to:

  • Critical role in automated liquid level monitoring across industries
  • Wide adoption in hazardous environments where contact sensors are unsuitable
  • Technological innovations enabling higher accuracy and reliability
By Application
  • Manufacturing
  • Oil & Gas
  • Chemicals
  • Pharmaceuticals
  • Others
shows strongest adoption:

  • Essential for Industry 4.0 automation and smart factory implementations
  • Growing demand for quality control and process optimization
  • Increasing use in robotic applications requiring precise non-contact measurement
By End User
  • Process Industries
  • Discrete Manufacturing
  • Utilities
  • Others
Process Industries lead in deployment:

  • Requirement for continuous monitoring in harsh environments
  • Stringent safety regulations driving adoption of non-contact solutions
  • Superior performance in corrosive/explosive environments compared to contact sensors
By Technology
  • Ultrasonic
  • Infrared
  • Laser
  • Capacitive
Ultrasonic sensors show prominent growth:

  • Cost-effective solution with reliable performance across diverse applications
  • Ability to function in dusty or opaque environments where optical sensors fail
  • Continuous improvements in range and accuracy expanding application areas
By Detection Range
  • Short Range
  • Medium Range
  • Long Range
Medium Range sensors dominate demand:

  • Optimal balance between accuracy and working distance for most industrial applications
  • Wider applicability across process monitoring and quality control needs
  • Technological advancements reducing the price-performance gap with short-range variants

Regional Analysis: Global Non-contact Industrial Sensors Market

Asia-Pacific

The Asia-Pacific region dominates the Non-contact Industrial Sensors Market, driven by rapid industrialization and strong adoption of Industry 4.0 technologies. Countries like China, Japan, and South Korea lead in smart manufacturing initiatives, creating robust demand for advanced non-contact sensing solutions. The region benefits from thriving automotive and electronics sectors that extensively utilize proximity and infrared sensors for quality control. Government investments in industrial automation across Southeast Asia further propel market growth. Local manufacturers are increasingly integrating AI-powered vision systems with non-contact sensors to enhance production efficiency. The region’s competitive labor costs and growing focus on operational excellence make it the innovation hub for sensor technologies.

China’s Manufacturing Leadership
China accounts for nearly 40% of the region’s non-contact sensor demand, driven by its vast electronics assembly lines and automotive plants adopting laser displacement sensors and ultrasonic detectors for precision measurement.
Japan’s Technological Edge
Japanese manufacturers lead in MEMS-based non-contact sensors, with strong R&D investments in capacitive and inductive sensing technologies for robotics and semiconductor manufacturing applications.
India’s Emerging Market
India shows accelerating adoption of non-contact sensors in pharmaceuticals and automotive sectors, supported by government initiatives like Make in India and increasing automation in manufacturing facilities.
Southeast Asia Growth
Vietnam, Thailand, and Malaysia are witnessing rapid deployment of vision-based non-contact sensors in electronics manufacturing as multinationals establish production bases in these cost-competitive markets.

North America
The North American Non-contact Industrial Sensors Market thrives on advanced manufacturing capabilities and stringent quality standards. The United States leads in adopting LiDAR and thermal imaging sensors for aerospace and defense applications. Canada shows growing demand in automotive and food processing sectors. Regional sensor manufacturers focus on developing AI-integrated smart sensors with predictive maintenance capabilities. Strong presence of technology providers and early Industry 4.0 adoption creates favorable conditions for non-contact sensor innovation and deployment.

Europe
Europe maintains technological leadership in high-precision non-contact sensors for automotive and medical device manufacturing. Germany’s Industrie 4.0 initiative drives adoption of optical and capacitive sensors in smart factories. The region emphasizes energy-efficient sensor solutions with strict compliance to industrial safety regulations. Scandinavian countries show increasing implementation of non-contact temperature sensors in renewable energy applications, while Eastern Europe emerges as a cost-effective manufacturing hub deploying basic proximity sensors.

South America
South America presents emerging opportunities in mining and oil & gas sectors utilizing rugged non-contact sensors for harsh environment applications. Brazil leads regional adoption in automotive production, while Chile and Peru invest in sensor technologies for mineral processing. Infrastructure limitations and economic volatility currently restrain broader adoption, but the market shows steady growth potential as industrial automation gains traction across the region.

Middle East & Africa
The MEA region demonstrates growing demand for non-contact sensors in oil refineries and petrochemical plants, particularly for flame detection and gas monitoring applications. UAE and Saudi Arabia invest in smart city projects utilizing infrared and ultrasonic sensors. South Africa shows potential in mining sector automation, while North African countries gradually adopt basic proximity sensors in manufacturing facilities. The market remains at nascent stage but holds long-term growth prospects.

Report Scope

This market research report provides a comprehensive analysis of the Non-contact Industrial Sensors Market, covering the forecast period 2025–2034. It offers detailed insights into market dynamics, technological advancements, competitive landscape, and key trends shaping the industry.

Key focus areas of the report include:

  • Market Overview: The report begins with an overview outlining its current market scenario, key growth indicators, and industry transformation drivers. It discusses macroeconomic factors, demand–supply balance, regulatory landscape, and the strategic role of non-contact sensors in powering advancements across industries such as manufacturing, oil & gas, chemicals, pharmaceuticals, and industrial automation.
  • Market Size & Forecast: Historical data and future projections for revenue, unit shipments, and market value across major regions and segments.
  • Segmentation Analysis: Detailed breakdown by product type, technology, application, and end-user industry to identify high-growth segments and investment opportunities.
  • Regional Insights: Insights into market performance across North America, Europe, Asia-Pacific, Latin America, and the Middle East & Africa, including country-level analysis where relevant.
  • Competitive Landscape: Profiles of leading market participants, including their product offerings, R&D focus, manufacturing capacity, pricing strategies, and recent developments such as mergers, acquisitions, and partnerships.
  • Technology Trends & Innovation: Assessment of emerging technologies, integration of AI/IoT, sensor design trends, fabrication techniques, and evolving industry standards.
  • Market Drivers & Restraints: Evaluation of factors driving market growth along with challenges, supply chain constraints, regulatory issues, and market-entry barriers.
  • Stakeholder Insights: Insights for component suppliers, OEMs, system integrators, investors, and policymakers regarding the evolving ecosystem and strategic opportunities.

Primary and secondary research methods are employed, including interviews with industry experts, data from verified sources, and real-time market intelligence to ensure the accuracy and reliability of the insights presented.

FREQUENTLY ASKED QUESTIONS:

What is the current market size of Non-contact Industrial Sensors Market?

-> Non-contact Industrial Sensors Market size was valued at USD 3.45 billion in 2025. The market is projected to grow from USD 3.72 billion in 2026 to USD 6.18 billion by 2034, exhibiting a CAGR of 7.8% during the forecast period.

Which key companies operate in Non-contact Industrial Sensors Market?

-> Key players include Rockwell Automation, Honeywell, Panasonic, Texas Instruments, STMicroelectronics, TE Connectivity, Siemens, Amphenol Corporation, Dwyer Instruments, and Bosch Sensortec, among others. In 2025, the global top five players held approximately % revenue share.

What are the key growth drivers?

-> Key growth drivers include increasing demand for automation in manufacturing, adoption in oil & gas and chemical industries, and technological advancements in sensor accuracy.

Which region dominates the market?

-> Asia is the fastest-growing region, with China projected to reach USD million by 2034, while North America remains a significant market.

What are the key segments in this market?

-> Product segments include Level Sensors, Temperature Sensors, and others, while key applications are Manufacturing, Oil & Gas, Chemicals, Pharmaceuticals, and others. The Level Sensor segment is projected to reach USD million by 2034.

Non-contact Industrial Sensors Market Technology Adoption, AI Integration and Industry Outlook (2026-2034)

Get Sample Report PDF for Exclusive Insights

Report Sample Includes

  • Table of Contents
  • List of Tables & Figures
  • Charts, Research Methodology, and more...
PDF Icon Download Sample Report PDF

Table of Content

1 Introduction to Research & Analysis Reports
1.1 Non-contact Industrial Sensors Market Definition
1.2 Market Segments
1.2.1 Segment by Type
1.2.2 Segment by Application
1.3 Global Non-contact Industrial Sensors Market Overview
1.4 Features & Benefits of This Report
1.5 Methodology & Sources of Information
1.5.1 Research Methodology
1.5.2 Research Process
1.5.3 Base Year
1.5.4 Report Assumptions & Caveats
2 Global Non-contact Industrial Sensors Overall Market Size
2.1 Global Non-contact Industrial Sensors Market Size: 2025 VS 2034
2.2 Global Non-contact Industrial Sensors Market Size, Prospects & Forecasts: 2021-2034
2.3 Global Non-contact Industrial Sensors Sales: 2021-2034
3 Company Landscape
3.1 Top Non-contact Industrial Sensors Players in Global Market
3.2 Top Global Non-contact Industrial Sensors Companies Ranked by Revenue
3.3 Global Non-contact Industrial Sensors Revenue by Companies
3.4 Global Non-contact Industrial Sensors Sales by Companies
3.5 Global Non-contact Industrial Sensors Price by Manufacturer (2021-2026)
3.6 Top 3 and Top 5 Non-contact Industrial Sensors Companies in Global Market, by Revenue in 2025
3.7 Global Manufacturers Non-contact Industrial Sensors Product Type
3.8 Tier 1, Tier 2, and Tier 3 Non-contact Industrial Sensors Players in Global Market
3.8.1 List of Global Tier 1 Non-contact Industrial Sensors Companies
3.8.2 List of Global Tier 2 and Tier 3 Non-contact Industrial Sensors Companies
4 Sights by Type
4.1 Overview
4.1.1 Segment by Type – Global Non-contact Industrial Sensors Market Size Markets, 2025 & 2034
4.1.2 Level Sensor
4.1.3 Temperature Sensor
4.1.4 Others
4.2 Segment by Type – Global Non-contact Industrial Sensors Revenue & Forecasts
4.2.1 Segment by Type – Global Non-contact Industrial Sensors Revenue, 2021-2026
4.2.2 Segment by Type – Global Non-contact Industrial Sensors Revenue, 2027-2034
4.2.3 Segment by Type – Global Non-contact Industrial Sensors Revenue Market Share, 2021-2034
4.3 Segment by Type – Global Non-contact Industrial Sensors Sales & Forecasts
4.3.1 Segment by Type – Global Non-contact Industrial Sensors Sales, 2021-2026
4.3.2 Segment by Type – Global Non-contact Industrial Sensors Sales, 2027-2034
4.3.3 Segment by Type – Global Non-contact Industrial Sensors Sales Market Share, 2021-2034
4.4 Segment by Type – Global Non-contact Industrial Sensors Price (Manufacturers Selling Prices), 2021-2034
5 Sights by Application
5.1 Overview
5.1.1 Segment by Application – Global Non-contact Industrial Sensors Market Size, 2025 & 2034
5.1.2 Manufacturing
5.1.3 Oil & Gas
5.1.4 Chemicals
5.1.5 Pharmaceuticals
5.1.6 Others
5.2 Segment by Application – Global Non-contact Industrial Sensors Revenue & Forecasts
5.2.1 Segment by Application – Global Non-contact Industrial Sensors Revenue, 2021-2026
5.2.2 Segment by Application – Global Non-contact Industrial Sensors Revenue, 2027-2034
5.2.3 Segment by Application – Global Non-contact Industrial Sensors Revenue Market Share, 2021-2034
5.3 Segment by Application – Global Non-contact Industrial Sensors Sales & Forecasts
5.3.1 Segment by Application – Global Non-contact Industrial Sensors Sales, 2021-2026
5.3.2 Segment by Application – Global Non-contact Industrial Sensors Sales, 2027-2034
5.3.3 Segment by Application – Global Non-contact Industrial Sensors Sales Market Share, 2021-2034
5.4 Segment by Application – Global Non-contact Industrial Sensors Price (Manufacturers Selling Prices), 2021-2034
6 Sights Region
6.1 By Region – Global Non-contact Industrial Sensors Market Size, 2025 & 2034
6.2 By Region – Global Non-contact Industrial Sensors Revenue & Forecasts
6.2.1 By Region – Global Non-contact Industrial Sensors Revenue, 2021-2026
6.2.2 By Region – Global Non-contact Industrial Sensors Revenue, 2027-2034
6.2.3 By Region – Global Non-contact Industrial Sensors Revenue Market Share, 2021-2034
6.3 By Region – Global Non-contact Industrial Sensors Sales & Forecasts
6.3.1 By Region – Global Non-contact Industrial Sensors Sales, 2021-2026
6.3.2 By Region – Global Non-contact Industrial Sensors Sales, 2027-2034
6.3.3 By Region – Global Non-contact Industrial Sensors Sales Market Share, 2021-2034
6.4 North America
6.4.1 By Country – North America Non-contact Industrial Sensors Revenue, 2021-2034
6.4.2 By Country – North America Non-contact Industrial Sensors Sales, 2021-2034
6.4.3 United States Non-contact Industrial Sensors Market Size, 2021-2034
6.4.4 Canada Non-contact Industrial Sensors Market Size, 2021-2034
6.4.5 Mexico Non-contact Industrial Sensors Market Size, 2021-2034
6.5 Europe
6.5.1 By Country – Europe Non-contact Industrial Sensors Revenue, 2021-2034
6.5.2 By Country – Europe Non-contact Industrial Sensors Sales, 2021-2034
6.5.3 Germany Non-contact Industrial Sensors Market Size, 2021-2034
6.5.4 France Non-contact Industrial Sensors Market Size, 2021-2034
6.5.5 U.K. Non-contact Industrial Sensors Market Size, 2021-2034
6.5.6 Italy Non-contact Industrial Sensors Market Size, 2021-2034
6.5.7 Russia Non-contact Industrial Sensors Market Size, 2021-2034
6.5.8 Nordic Countries Non-contact Industrial Sensors Market Size, 2021-2034
6.5.9 Benelux Non-contact Industrial Sensors Market Size, 2021-2034
6.6 Asia
6.6.1 By Region – Asia Non-contact Industrial Sensors Revenue, 2021-2034
6.6.2 By Region – Asia Non-contact Industrial Sensors Sales, 2021-2034
6.6.3 China Non-contact Industrial Sensors Market Size, 2021-2034
6.6.4 Japan Non-contact Industrial Sensors Market Size, 2021-2034
6.6.5 South Korea Non-contact Industrial Sensors Market Size, 2021-2034
6.6.6 Southeast Asia Non-contact Industrial Sensors Market Size, 2021-2034
6.6.7 India Non-contact Industrial Sensors Market Size, 2021-2034
6.7 South America
6.7.1 By Country – South America Non-contact Industrial Sensors Revenue, 2021-2034
6.7.2 By Country – South America Non-contact Industrial Sensors Sales, 2021-2034
6.7.3 Brazil Non-contact Industrial Sensors Market Size, 2021-2034
6.7.4 Argentina Non-contact Industrial Sensors Market Size, 2021-2034
6.8 Middle East & Africa
6.8.1 By Country – Middle East & Africa Non-contact Industrial Sensors Revenue, 2021-2034
6.8.2 By Country – Middle East & Africa Non-contact Industrial Sensors Sales, 2021-2034
6.8.3 Turkey Non-contact Industrial Sensors Market Size, 2021-2034
6.8.4 Israel Non-contact Industrial Sensors Market Size, 2021-2034
6.8.5 Saudi Arabia Non-contact Industrial Sensors Market Size, 2021-2034
6.8.6 UAE Non-contact Industrial Sensors Market Size, 2021-2034
7 Manufacturers & Brands Profiles
7.1 Rockwell Automation
7.1.1 Rockwell Automation Company Summary
7.1.2 Rockwell Automation Business Overview
7.1.3 Rockwell Automation Non-contact Industrial Sensors Major Product Offerings
7.1.4 Rockwell Automation Non-contact Industrial Sensors Sales and Revenue in Global (2021-2026)
7.1.5 Rockwell Automation Key News & Latest Developments
7.2 Honeywell
7.2.1 Honeywell Company Summary
7.2.2 Honeywell Business Overview
7.2.3 Honeywell Non-contact Industrial Sensors Major Product Offerings
7.2.4 Honeywell Non-contact Industrial Sensors Sales and Revenue in Global (2021-2026)
7.2.5 Honeywell Key News & Latest Developments
7.3 Panasonic
7.3.1 Panasonic Company Summary
7.3.2 Panasonic Business Overview
7.3.3 Panasonic Non-contact Industrial Sensors Major Product Offerings
7.3.4 Panasonic Non-contact Industrial Sensors Sales and Revenue in Global (2021-2026)
7.3.5 Panasonic Key News & Latest Developments
7.4 Texas Instruments
7.4.1 Texas Instruments Company Summary
7.4.2 Texas Instruments Business Overview
7.4.3 Texas Instruments Non-contact Industrial Sensors Major Product Offerings
7.4.4 Texas Instruments Non-contact Industrial Sensors Sales and Revenue in Global (2021-2026)
7.4.5 Texas Instruments Key News & Latest Developments
7.5 STMicroelectronics
7.5.1 STMicroelectronics Company Summary
7.5.2 STMicroelectronics Business Overview
7.5.3 STMicroelectronics Non-contact Industrial Sensors Major Product Offerings
7.5.4 STMicroelectronics Non-contact Industrial Sensors Sales and Revenue in Global (2021-2026)
7.5.5 STMicroelectronics Key News & Latest Developments
7.6 TE Connectivity
7.6.1 TE Connectivity Company Summary
7.6.2 TE Connectivity Business Overview
7.6.3 TE Connectivity Non-contact Industrial Sensors Major Product Offerings
7.6.4 TE Connectivity Non-contact Industrial Sensors Sales and Revenue in Global (2021-2026)
7.6.5 TE Connectivity Key News & Latest Developments
7.7 Siemens
7.7.1 Siemens Company Summary
7.7.2 Siemens Business Overview
7.7.3 Siemens Non-contact Industrial Sensors Major Product Offerings
7.7.4 Siemens Non-contact Industrial Sensors Sales and Revenue in Global (2021-2026)
7.7.5 Siemens Key News & Latest Developments
7.8 Amphenol Corporation
7.8.1 Amphenol Corporation Company Summary
7.8.2 Amphenol Corporation Business Overview
7.8.3 Amphenol Corporation Non-contact Industrial Sensors Major Product Offerings
7.8.4 Amphenol Corporation Non-contact Industrial Sensors Sales and Revenue in Global (2021-2026)
7.8.5 Amphenol Corporation Key News & Latest Developments
7.9 Dwyer Instruments
7.9.1 Dwyer Instruments Company Summary
7.9.2 Dwyer Instruments Business Overview
7.9.3 Dwyer Instruments Non-contact Industrial Sensors Major Product Offerings
7.9.4 Dwyer Instruments Non-contact Industrial Sensors Sales and Revenue in Global (2021-2026)
7.9.5 Dwyer Instruments Key News & Latest Developments
7.10 Bosch Sensortec
7.10.1 Bosch Sensortec Company Summary
7.10.2 Bosch Sensortec Business Overview
7.10.3 Bosch Sensortec Non-contact Industrial Sensors Major Product Offerings
7.10.4 Bosch Sensortec Non-contact Industrial Sensors Sales and Revenue in Global (2021-2026)
7.10.5 Bosch Sensortec Key News & Latest Developments
7.11 Omega Engineering
7.11.1 Omega Engineering Company Summary
7.11.2 Omega Engineering Business Overview
7.11.3 Omega Engineering Non-contact Industrial Sensors Major Product Offerings
7.11.4 Omega Engineering Non-contact Industrial Sensors Sales and Revenue in Global (2021-2026)
7.11.5 Omega Engineering Key News & Latest Developments
7.12 Sensirion
7.12.1 Sensirion Company Summary
7.12.2 Sensirion Business Overview
7.12.3 Sensirion Non-contact Industrial Sensors Major Product Offerings
7.12.4 Sensirion Non-contact Industrial Sensors Sales and Revenue in Global (2021-2026)
7.12.5 Sensirion Key News & Latest Developments
7.13 ams-OSRAM
7.13.1 ams-OSRAM Company Summary
7.13.2 ams-OSRAM Business Overview
7.13.3 ams-OSRAM Non-contact Industrial Sensors Major Product Offerings
7.13.4 ams-OSRAM Non-contact Industrial Sensors Sales and Revenue in Global (2021-2026)
7.13.5 ams-OSRAM Key News & Latest Developments
7.14 ABB
7.14.1 ABB Company Summary
7.14.2 ABB Business Overview
7.14.3 ABB Non-contact Industrial Sensors Major Product Offerings
7.14.4 ABB Non-contact Industrial Sensors Sales and Revenue in Global (2021-2026)
7.14.5 ABB Key News & Latest Developments
7.15 NXP Semiconductors
7.15.1 NXP Semiconductors Company Summary
7.15.2 NXP Semiconductors Business Overview
7.15.3 NXP Semiconductors Non-contact Industrial Sensors Major Product Offerings
7.15.4 NXP Semiconductors Non-contact Industrial Sensors Sales and Revenue in Global (2021-2026)
7.15.5 NXP Semiconductors Key News & Latest Developments
7.16 Safran
7.16.1 Safran Company Summary
7.16.2 Safran Business Overview
7.16.3 Safran Non-contact Industrial Sensors Major Product Offerings
7.16.4 Safran Non-contact Industrial Sensors Sales and Revenue in Global (2021-2026)
7.16.5 Safran Key News & Latest Developments
7.17 Infineon Technologies
7.17.1 Infineon Technologies Company Summary
7.17.2 Infineon Technologies Business Overview
7.17.3 Infineon Technologies Non-contact Industrial Sensors Major Product Offerings
7.17.4 Infineon Technologies Non-contact Industrial Sensors Sales and Revenue in Global (2021-2026)
7.17.5 Infineon Technologies Key News & Latest Developments
7.18 Analog Devices
7.18.1 Analog Devices Company Summary
7.18.2 Analog Devices Business Overview
7.18.3 Analog Devices Non-contact Industrial Sensors Major Product Offerings
7.18.4 Analog Devices Non-contact Industrial Sensors Sales and Revenue in Global (2021-2026)
7.18.5 Analog Devices Key News & Latest Developments
8 Global Non-contact Industrial Sensors Production Capacity, Analysis
8.1 Global Non-contact Industrial Sensors Production Capacity, 2021-2034
8.2 Non-contact Industrial Sensors Production Capacity of Key Manufacturers in Global Market
8.3 Global Non-contact Industrial Sensors Production by Region
9 Key Market Trends, Opportunity, Drivers and Restraints
9.1 Market Opportunities & Trends
9.2 Market Drivers
9.3 Market Restraints
10 Non-contact Industrial Sensors Supply Chain Analysis
10.1 Non-contact Industrial Sensors Industry Value Chain
10.2 Non-contact Industrial Sensors Upstream Market
10.3 Non-contact Industrial Sensors Downstream and Clients
10.4 Marketing Channels Analysis
10.4.1 Marketing Channels
10.4.2 Non-contact Industrial Sensors Distributors and Sales Agents in Global
11 Conclusion
12 Appendix
12.1 Note
12.2 Examples of Clients
12.3 DisclaimerList of Tables
Table 1. Key Players of Non-contact Industrial Sensors in Global Market
Table 2. Top Non-contact Industrial Sensors Players in Global Market, Ranking by Revenue (2025)
Table 3. Global Non-contact Industrial Sensors Revenue by Companies, (US$, Mn), 2021-2026
Table 4. Global Non-contact Industrial Sensors Revenue Share by Companies, 2021-2026
Table 5. Global Non-contact Industrial Sensors Sales by Companies, (K Units), 2021-2026
Table 6. Global Non-contact Industrial Sensors Sales Share by Companies, 2021-2026
Table 7. Key Manufacturers Non-contact Industrial Sensors Price (2021-2026) & (US$/Unit)
Table 8. Global Manufacturers Non-contact Industrial Sensors Product Type
Table 9. List of Global Tier 1 Non-contact Industrial Sensors Companies, Revenue (US$, Mn) in 2025 and Market Share
Table 10. List of Global Tier 2 and Tier 3 Non-contact Industrial Sensors Companies, Revenue (US$, Mn) in 2025 and Market Share
Table 11. Segment by Type – Global Non-contact Industrial Sensors Revenue, (US$, Mn), 2025 & 2034
Table 12. Segment by Type – Global Non-contact Industrial Sensors Revenue (US$, Mn), 2021-2026
Table 13. Segment by Type – Global Non-contact Industrial Sensors Revenue (US$, Mn), 2027-2034
Table 14. Segment by Type – Global Non-contact Industrial Sensors Sales (K Units), 2021-2026
Table 15. Segment by Type – Global Non-contact Industrial Sensors Sales (K Units), 2027-2034
Table 16. Segment by Application – Global Non-contact Industrial Sensors Revenue, (US$, Mn), 2025 & 2034
Table 17. Segment by Application – Global Non-contact Industrial Sensors Revenue, (US$, Mn), 2021-2026
Table 18. Segment by Application – Global Non-contact Industrial Sensors Revenue, (US$, Mn), 2027-2034
Table 19. Segment by Application – Global Non-contact Industrial Sensors Sales, (K Units), 2021-2026
Table 20. Segment by Application – Global Non-contact Industrial Sensors Sales, (K Units), 2027-2034
Table 21. By Region – Global Non-contact Industrial Sensors Revenue, (US$, Mn), 2025 & 2034
Table 22. By Region – Global Non-contact Industrial Sensors Revenue, (US$, Mn), 2021-2026
Table 23. By Region – Global Non-contact Industrial Sensors Revenue, (US$, Mn), 2027-2034
Table 24. By Region – Global Non-contact Industrial Sensors Sales, (K Units), 2021-2026
Table 25. By Region – Global Non-contact Industrial Sensors Sales, (K Units), 2027-2034
Table 26. By Country – North America Non-contact Industrial Sensors Revenue, (US$, Mn), 2021-2026
Table 27. By Country – North America Non-contact Industrial Sensors Revenue, (US$, Mn), 2027-2034
Table 28. By Country – North America Non-contact Industrial Sensors Sales, (K Units), 2021-2026
Table 29. By Country – North America Non-contact Industrial Sensors Sales, (K Units), 2027-2034
Table 30. By Country – Europe Non-contact Industrial Sensors Revenue, (US$, Mn), 2021-2026
Table 31. By Country – Europe Non-contact Industrial Sensors Revenue, (US$, Mn), 2027-2034
Table 32. By Country – Europe Non-contact Industrial Sensors Sales, (K Units), 2021-2026
Table 33. By Country – Europe Non-contact Industrial Sensors Sales, (K Units), 2027-2034
Table 34. By Region – Asia Non-contact Industrial Sensors Revenue, (US$, Mn), 2021-2026
Table 35. By Region – Asia Non-contact Industrial Sensors Revenue, (US$, Mn), 2027-2034
Table 36. By Region – Asia Non-contact Industrial Sensors Sales, (K Units), 2021-2026
Table 37. By Region – Asia Non-contact Industrial Sensors Sales, (K Units), 2027-2034
Table 38. By Country – South America Non-contact Industrial Sensors Revenue, (US$, Mn), 2021-2026
Table 39. By Country – South America Non-contact Industrial Sensors Revenue, (US$, Mn), 2027-2034
Table 40. By Country – South America Non-contact Industrial Sensors Sales, (K Units), 2021-2026
Table 41. By Country – South America Non-contact Industrial Sensors Sales, (K Units), 2027-2034
Table 42. By Country – Middle East & Africa Non-contact Industrial Sensors Revenue, (US$, Mn), 2021-2026
Table 43. By Country – Middle East & Africa Non-contact Industrial Sensors Revenue, (US$, Mn), 2027-2034
Table 44. By Country – Middle East & Africa Non-contact Industrial Sensors Sales, (K Units), 2021-2026
Table 45. By Country – Middle East & Africa Non-contact Industrial Sensors Sales, (K Units), 2027-2034
Table 46. Rockwell Automation Company Summary
Table 47. Rockwell Automation Non-contact Industrial Sensors Product Offerings
Table 48. Rockwell Automation Non-contact Industrial Sensors Sales (K Units), Revenue (US$, Mn) and Average Price (US$/Unit) & (2021-2026)
Table 49. Rockwell Automation Key News & Latest Developments
Table 50. Honeywell Company Summary
Table 51. Honeywell Non-contact Industrial Sensors Product Offerings
Table 52. Honeywell Non-contact Industrial Sensors Sales (K Units), Revenue (US$, Mn) and Average Price (US$/Unit) & (2021-2026)
Table 53. Honeywell Key News & Latest Developments
Table 54. Panasonic Company Summary
Table 55. Panasonic Non-contact Industrial Sensors Product Offerings
Table 56. Panasonic Non-contact Industrial Sensors Sales (K Units), Revenue (US$, Mn) and Average Price (US$/Unit) & (2021-2026)
Table 57. Panasonic Key News & Latest Developments
Table 58. Texas Instruments Company Summary
Table 59. Texas Instruments Non-contact Industrial Sensors Product Offerings
Table 60. Texas Instruments Non-contact Industrial Sensors Sales (K Units), Revenue (US$, Mn) and Average Price (US$/Unit) & (2021-2026)
Table 61. Texas Instruments Key News & Latest Developments
Table 62. STMicroelectronics Company Summary
Table 63. STMicroelectronics Non-contact Industrial Sensors Product Offerings
Table 64. STMicroelectronics Non-contact Industrial Sensors Sales (K Units), Revenue (US$, Mn) and Average Price (US$/Unit) & (2021-2026)
Table 65. STMicroelectronics Key News & Latest Developments
Table 66. TE Connectivity Company Summary
Table 67. TE Connectivity Non-contact Industrial Sensors Product Offerings
Table 68. TE Connectivity Non-contact Industrial Sensors Sales (K Units), Revenue (US$, Mn) and Average Price (US$/Unit) & (2021-2026)
Table 69. TE Connectivity Key News & Latest Developments
Table 70. Siemens Company Summary
Table 71. Siemens Non-contact Industrial Sensors Product Offerings
Table 72. Siemens Non-contact Industrial Sensors Sales (K Units), Revenue (US$, Mn) and Average Price (US$/Unit) & (2021-2026)
Table 73. Siemens Key News & Latest Developments
Table 74. Amphenol Corporation Company Summary
Table 75. Amphenol Corporation Non-contact Industrial Sensors Product Offerings
Table 76. Amphenol Corporation Non-contact Industrial Sensors Sales (K Units), Revenue (US$, Mn) and Average Price (US$/Unit) & (2021-2026)
Table 77. Amphenol Corporation Key News & Latest Developments
Table 78. Dwyer Instruments Company Summary
Table 79. Dwyer Instruments Non-contact Industrial Sensors Product Offerings
Table 80. Dwyer Instruments Non-contact Industrial Sensors Sales (K Units), Revenue (US$, Mn) and Average Price (US$/Unit) & (2021-2026)
Table 81. Dwyer Instruments Key News & Latest Developments
Table 82. Bosch Sensortec Company Summary
Table 83. Bosch Sensortec Non-contact Industrial Sensors Product Offerings
Table 84. Bosch Sensortec Non-contact Industrial Sensors Sales (K Units), Revenue (US$, Mn) and Average Price (US$/Unit) & (2021-2026)
Table 85. Bosch Sensortec Key News & Latest Developments
Table 86. Omega Engineering Company Summary
Table 87. Omega Engineering Non-contact Industrial Sensors Product Offerings
Table 88. Omega Engineering Non-contact Industrial Sensors Sales (K Units), Revenue (US$, Mn) and Average Price (US$/Unit) & (2021-2026)
Table 89. Omega Engineering Key News & Latest Developments
Table 90. Sensirion Company Summary
Table 91. Sensirion Non-contact Industrial Sensors Product Offerings
Table 92. Sensirion Non-contact Industrial Sensors Sales (K Units), Revenue (US$, Mn) and Average Price (US$/Unit) & (2021-2026)
Table 93. Sensirion Key News & Latest Developments
Table 94. ams-OSRAM Company Summary
Table 95. ams-OSRAM Non-contact Industrial Sensors Product Offerings
Table 96. ams-OSRAM Non-contact Industrial Sensors Sales (K Units), Revenue (US$, Mn) and Average Price (US$/Unit) & (2021-2026)
Table 97. ams-OSRAM Key News & Latest Developments
Table 98. ABB Company Summary
Table 99. ABB Non-contact Industrial Sensors Product Offerings
Table 100. ABB Non-contact Industrial Sensors Sales (K Units), Revenue (US$, Mn) and Average Price (US$/Unit) & (2021-2026)
Table 101. ABB Key News & Latest Developments
Table 102. NXP Semiconductors Company Summary
Table 103. NXP Semiconductors Non-contact Industrial Sensors Product Offerings
Table 104. NXP Semiconductors Non-contact Industrial Sensors Sales (K Units), Revenue (US$, Mn) and Average Price (US$/Unit) & (2021-2026)
Table 105. NXP Semiconductors Key News & Latest Developments
Table 106. Safran Company Summary
Table 107. Safran Non-contact Industrial Sensors Product Offerings
Table 108. Safran Non-contact Industrial Sensors Sales (K Units), Revenue (US$, Mn) and Average Price (US$/Unit) & (2021-2026)
Table 109. Safran Key News & Latest Developments
Table 110. Infineon Technologies Company Summary
Table 111. Infineon Technologies Non-contact Industrial Sensors Product Offerings
Table 112. Infineon Technologies Non-contact Industrial Sensors Sales (K Units), Revenue (US$, Mn) and Average Price (US$/Unit) & (2021-2026)
Table 113. Infineon Technologies Key News & Latest Developments
Table 114. Analog Devices Company Summary
Table 115. Analog Devices Non-contact Industrial Sensors Product Offerings
Table 116. Analog Devices Non-contact Industrial Sensors Sales (K Units), Revenue (US$, Mn) and Average Price (US$/Unit) & (2021-2026)
Table 117. Analog Devices Key News & Latest Developments
Table 118. Non-contact Industrial Sensors Capacity of Key Manufacturers in Global Market, 2024-2026 (K Units)
Table 119. Global Non-contact Industrial Sensors Capacity Market Share of Key Manufacturers, 2024-2026
Table 120. Global Non-contact Industrial Sensors Production by Region, 2021-2026 (K Units)
Table 121. Global Non-contact Industrial Sensors Production by Region, 2027-2034 (K Units)
Table 122. Non-contact Industrial Sensors Market Opportunities & Trends in Global Market
Table 123. Non-contact Industrial Sensors Market Drivers in Global Market
Table 124. Non-contact Industrial Sensors Market Restraints in Global Market
Table 125. Non-contact Industrial Sensors Raw Materials
Table 126. Non-contact Industrial Sensors Raw Materials Suppliers in Global Market
Table 127. Typical Non-contact Industrial Sensors Downstream
Table 128. Non-contact Industrial Sensors Downstream Clients in Global Market
Table 129. Non-contact Industrial Sensors Distributors and Sales Agents in Global Market

List of Figures
Figure 1. Non-contact Industrial Sensors Product Picture
Figure 2. Non-contact Industrial Sensors Segment by Type in 2025
Figure 3. Non-contact Industrial Sensors Segment by Application in 2025
Figure 4. Global Non-contact Industrial Sensors Market Overview: 2025
Figure 5. Key Caveats
Figure 6. Global Non-contact Industrial Sensors Market Size: 2025 VS 2034 (US$, Mn)
Figure 7. Global Non-contact Industrial Sensors Revenue: 2021-2034 (US$, Mn)
Figure 8. Non-contact Industrial Sensors Sales in Global Market: 2021-2034 (K Units)
Figure 9. The Top 3 and 5 Players Market Share by Non-contact Industrial Sensors Revenue in 2025
Figure 10. Segment by Type – Global Non-contact Industrial Sensors Revenue, (US$, Mn), 2025 & 2034
Figure 11. Segment by Type – Global Non-contact Industrial Sensors Revenue Market Share, 2021-2034
Figure 12. Segment by Type – Global Non-contact Industrial Sensors Sales Market Share, 2021-2034
Figure 13. Segment by Type – Global Non-contact Industrial Sensors Price (US$/Unit), 2021-2034
Figure 14. Segment by Application – Global Non-contact Industrial Sensors Revenue, (US$, Mn), 2025 & 2034
Figure 15. Segment by Application – Global Non-contact Industrial Sensors Revenue Market Share, 2021-2034
Figure 16. Segment by Application – Global Non-contact Industrial Sensors Sales Market Share, 2021-2034
Figure 17. Segment by Application -Global Non-contact Industrial Sensors Price (US$/Unit), 2021-2034
Figure 18. By Region – Global Non-contact Industrial Sensors Revenue, (US$, Mn), 2025 & 2034
Figure 19. By Region – Global Non-contact Industrial Sensors Revenue Market Share, 2021 VS 2025 VS 2034
Figure 20. By Region – Global Non-contact Industrial Sensors Revenue Market Share, 2021-2034
Figure 21. By Region – Global Non-contact Industrial Sensors Sales Market Share, 2021-2034
Figure 22. By Country – North America Non-contact Industrial Sensors Revenue Market Share, 2021-2034
Figure 23. By Country – North America Non-contact Industrial Sensors Sales Market Share, 2021-2034
Figure 24. United States Non-contact Industrial Sensors Revenue, (US$, Mn), 2021-2034
Figure 25. Canada Non-contact Industrial Sensors Revenue, (US$, Mn), 2021-2034
Figure 26. Mexico Non-contact Industrial Sensors Revenue, (US$, Mn), 2021-2034
Figure 27. By Country – Europe Non-contact Industrial Sensors Revenue Market Share, 2021-2034
Figure 28. By Country – Europe Non-contact Industrial Sensors Sales Market Share, 2021-2034
Figure 29. Germany Non-contact Industrial Sensors Revenue, (US$, Mn), 2021-2034
Figure 30. France Non-contact Industrial Sensors Revenue, (US$, Mn), 2021-2034
Figure 31. U.K. Non-contact Industrial Sensors Revenue, (US$, Mn), 2021-2034
Figure 32. Italy Non-contact Industrial Sensors Revenue, (US$, Mn), 2021-2034
Figure 33. Russia Non-contact Industrial Sensors Revenue, (US$, Mn), 2021-2034
Figure 34. Nordic Countries Non-contact Industrial Sensors Revenue, (US$, Mn), 2021-2034
Figure 35. Benelux Non-contact Industrial Sensors Revenue, (US$, Mn), 2021-2034
Figure 36. By Region – Asia Non-contact Industrial Sensors Revenue Market Share, 2021-2034
Figure 37. By Region – Asia Non-contact Industrial Sensors Sales Market Share, 2021-2034
Figure 38. China Non-contact Industrial Sensors Revenue, (US$, Mn), 2021-2034
Figure 39. Japan Non-contact Industrial Sensors Revenue, (US$, Mn), 2021-2034
Figure 40. South Korea Non-contact Industrial Sensors Revenue, (US$, Mn), 2021-2034
Figure 41. Southeast Asia Non-contact Industrial Sensors Revenue, (US$, Mn), 2021-2034
Figure 42. India Non-contact Industrial Sensors Revenue, (US$, Mn), 2021-2034
Figure 43. By Country – South America Non-contact Industrial Sensors Revenue Market Share, 2021-2034
Figure 44. By Country – South America Non-contact Industrial Sensors Sales, Market Share, 2021-2034
Figure 45. Brazil Non-contact Industrial Sensors Revenue, (US$, Mn), 2021-2034
Figure 46. Argentina Non-contact Industrial Sensors Revenue, (US$, Mn), 2021-2034
Figure 47. By Country – Middle East & Africa Non-contact Industrial Sensors Revenue, Market Share, 2021-2034
Figure 48. By Country – Middle East & Africa Non-contact Industrial Sensors Sales, Market Share, 2021-2034
Figure 49. Turkey Non-contact Industrial Sensors Revenue, (US$, Mn), 2021-2034
Figure 50. Israel Non-contact Industrial Sensors Revenue, (US$, Mn), 2021-2034
Figure 51. Saudi Arabia Non-contact Industrial Sensors Revenue, (US$, Mn), 2021-2034
Figure 52. UAE Non-contact Industrial Sensors Revenue, (US$, Mn), 2021-2034
Figure 53. Global Non-contact Industrial Sensors Production Capacity (K Units), 2021-2034
Figure 54. The Percentage of Production Non-contact Industrial Sensors by Region, 2025 VS 2034
Figure 55. Non-contact Industrial Sensors Industry Value Chain
Figure 56. Marketing Channels