MARKET INSIGHTS
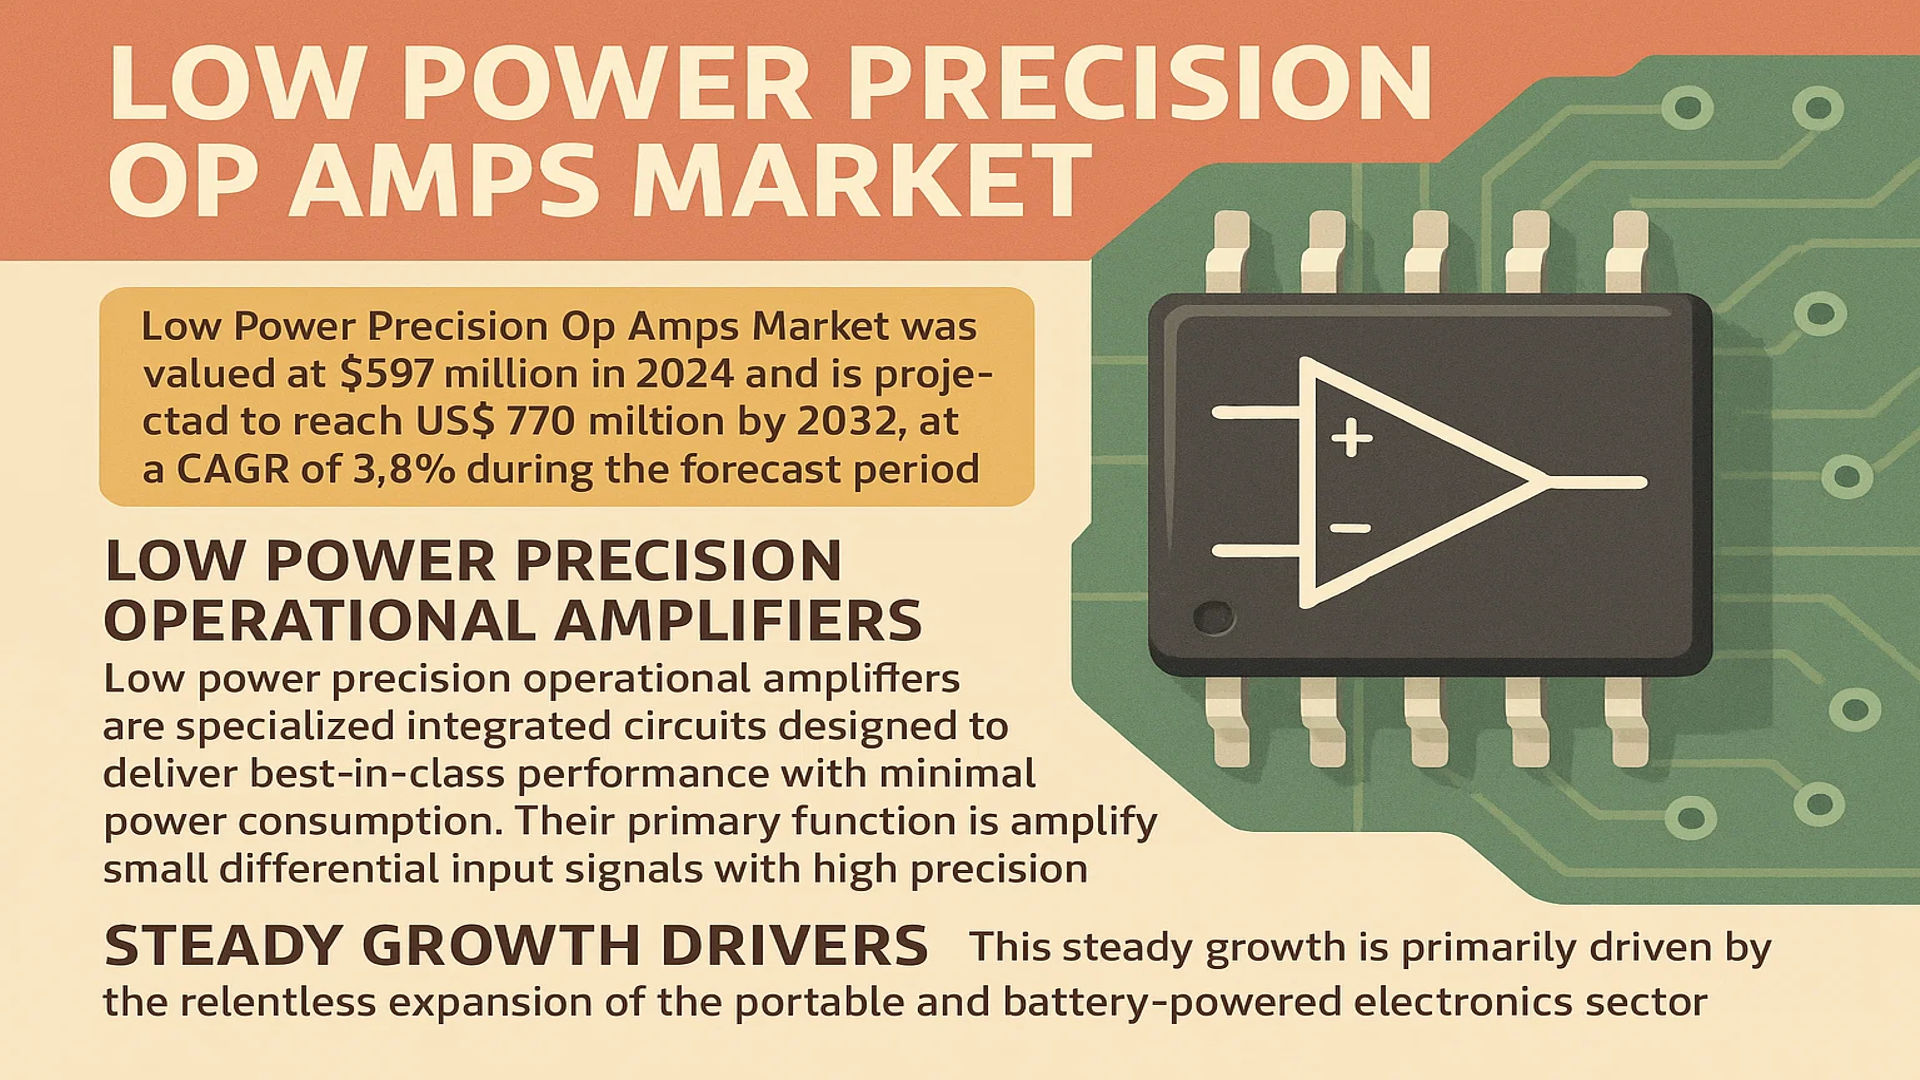
The global Low Power Precision Op Amps Market was valued at 597 million in 2024 and is projected to reach US$ 770 million by 2032, at a CAGR of 3.8% during the forecast period.
Low power precision operational amplifiers are specialized integrated circuits designed to deliver best-in-class performance with minimal power consumption. These components are engineered to achieve low offset voltages, low noise, and high accuracy while operating at very low supply currents, typically in the microampere range. Their primary function is to amplify small differential input signals with high precision, making them indispensable in applications where both power efficiency and signal integrity are paramount.
This steady growth is primarily driven by the relentless expansion of the portable and battery-powered electronics sector. The proliferation of IoT devices, wearable health monitors, and industrial sensors necessitates components that can operate for extended periods on limited power. Furthermore, advancements in automotive electronics, particularly in electric vehicles and advanced driver-assistance systems (ADAS), are creating significant demand for these highly efficient and reliable amplifiers.
MARKET DYNAMICS
MARKET DRIVERS
Proliferation of Portable Medical Devices Accelerating Market Adoption
The global healthcare sector’s shift toward portable and wearable medical devices is significantly driving demand for low power precision op amps. These components are critical for maintaining high accuracy while minimizing power consumption in devices such as portable ECG monitors, glucose meters, and wearable health trackers. The medical wearable device market is projected to exceed 60 billion dollars by 2029, creating substantial demand for energy-efficient signal conditioning components. Recent technological advancements have enabled op amps to operate at supply currents below 50 μA while maintaining offset voltages under 100 μV, making them ideal for battery-powered medical applications where both precision and longevity are paramount.
Expansion of IoT and Edge Computing Infrastructure Fueling Market Growth
The rapid deployment of Internet of Things (IoT) devices and edge computing infrastructure represents a major growth driver for low power precision op amps. These components are essential for sensor signal conditioning in smart city applications, industrial IoT systems, and environmental monitoring networks where power constraints are critical. The global IoT market is expected to surpass 1.5 trillion dollars by 2030, with industrial applications accounting for approximately 25% of this market. Low power precision op amps enable extended battery life in remote sensors while maintaining measurement accuracy, with typical devices achieving quiescent currents below 100 μA and offset voltages under 250 μV. This performance combination is particularly valuable in applications where maintenance access is limited and long-term reliability is essential.
Furthermore, the increasing adoption of energy harvesting technologies in IoT applications creates additional demand for ultra-low-power components that can operate effectively with limited available power.
➤ For instance, recent developments in energy harvesting systems for wireless sensor networks require op amps that can operate with supply currents as low as 10 μA while maintaining precision performance characteristics.
The convergence of these technological trends with growing environmental sustainability requirements continues to drive innovation and adoption in the low power precision op amp market.
MARKET RESTRAINTS
Design Complexity and Performance Trade-offs Limiting Market Penetration
While low power precision op amps offer significant advantages, their implementation involves substantial design challenges that restrain market growth. Achieving both low power consumption and high precision requires sophisticated circuit design techniques and advanced semiconductor processes, often resulting in higher component costs compared to standard op amps. The typical price premium for precision low power op amps ranges from 30% to 100% over conventional components, making them less attractive for cost-sensitive applications. Additionally, designers must navigate performance trade-offs between power consumption, bandwidth, noise, and offset voltage, which complicates the selection process and increases development time.
These design challenges are particularly pronounced in high-volume consumer applications where both cost and performance requirements are stringent, limiting adoption in price-sensitive market segments.
Thermal Management and Stability Issues in High-Density Applications
Thermal management presents significant challenges for low power precision op amps in high-density electronic systems. Despite their low power consumption, these components must maintain thermal stability across varying environmental conditions to preserve precision characteristics. Temperature coefficients typically range between 0.5 μV/°C and 5 μV/°C for offset voltage, requiring careful thermal design in applications where temperature fluctuations are common. This constraint becomes particularly problematic in automotive and industrial applications where operating temperatures can span from -40°C to 125°C, necessitating additional design measures that increase system complexity and cost.
The combination of thermal challenges and the need for stable performance under varying conditions continues to restrain market growth in certain application segments.
MARKET OPPORTUNITIES
Emerging Automotive Electronics Applications Creating New Growth Frontiers
The automotive industry’s transition toward electrification and advanced driver assistance systems (ADAS) presents substantial opportunities for low power precision op amps. Modern vehicles incorporate numerous sensor systems for battery management, position sensing, and environmental monitoring that require precision signal conditioning with minimal power consumption. The automotive electronics market is projected to reach 400 billion dollars by 2030, with sensor systems accounting for approximately 15% of this value. Low power precision op amps are particularly valuable in electric vehicle battery management systems where they enable accurate voltage and current monitoring while minimizing quiescent current to preserve battery life.
Recent advancements in automotive-grade components that meet AEC-Q100 qualifications while maintaining supply currents below 100 μA are opening new application areas in next-generation vehicle systems.
Growth in Energy Harvesting and Wireless Sensor Networks Expanding Addressable Market
The expanding market for energy harvesting systems and self-powered wireless sensors creates significant opportunities for ultra-low-power precision op amps. These applications require components that can operate with minimal power while maintaining measurement accuracy, driving demand for op amps with quiescent currents below 10 μA. The energy harvesting system market is expected to grow at a compound annual growth rate of approximately 15% through 2030, creating substantial demand for compatible electronic components. Recent product developments have achieved offset voltages under 150 μV with supply currents as low as 5 μA, enabling new applications in remote monitoring and infrastructure management.
These technological advancements are particularly relevant for environmental monitoring, smart agriculture, and industrial automation applications where maintenance-free operation is essential.
MARKET CHALLENGES
Supply Chain Constraints and Semiconductor Shortages Impacting Market Stability
The low power precision op amp market faces significant challenges from ongoing semiconductor supply chain disruptions and material shortages. These components require specialized semiconductor processes and high-quality materials that have been affected by global supply chain issues, leading to extended lead times and price volatility. Average lead times for precision analog components increased from 8-12 weeks to 20-30 weeks during recent supply constraints, creating design and production challenges for equipment manufacturers. The specialized nature of these components limits alternative sourcing options, exacerbating supply chain vulnerabilities.
These supply chain challenges are particularly acute for automotive and medical applications where component qualifications and long-term availability are critical considerations.
Other Challenges
Technological Obsolescence and Rapid Innovation Cycles
The rapid pace of technological innovation in semiconductor design creates challenges for both manufacturers and users of low power precision op amps. New process technologies and design techniques continually redefine performance benchmarks, making existing products obsolete more quickly than in traditional analog markets. This accelerated innovation cycle requires substantial ongoing research and development investment from manufacturers while creating design uncertainty for end users who must balance current requirements against future technology developments.
Testing and Validation Complexity
The precision characteristics of these components require extensive testing and validation procedures that increase manufacturing costs and time-to-market. Parameter testing for offset voltage, noise, and temperature drift requires sophisticated automated test equipment and environmental chambers, adding significant cost to the manufacturing process. This testing complexity becomes particularly challenging for high-volume production where test time directly impacts manufacturing efficiency and product cost.
LOW POWER PRECISION OP AMPS MARKET TRENDS
Proliferation of IoT and Portable Medical Devices Driving Market Expansion
The explosive growth of the Internet of Things (IoT) ecosystem is a primary catalyst for the low power precision op amp market. Billions of connected sensors and edge devices require signal conditioning with minimal energy consumption to maximize battery life, often for years without maintenance. This demand is particularly acute in industrial IoT and smart agriculture, where devices are deployed in remote locations. Concurrently, the portable medical device sector, valued in the tens of billions globally, is a major consumer. Devices such as continuous glucose monitors (CGMs), portable ECG systems, and wearable health patches rely on these components to achieve high accuracy while operating on tiny coin-cell or rechargeable batteries. The shift towards remote patient monitoring and decentralized healthcare is accelerating this trend, pushing manufacturers to develop op amps with supply currents below 10µA while maintaining microvolt-level offset and low noise performance.
Other Trends
Automotive Electrification and Advanced Driver-Assistance Systems (ADAS)
The automotive industry’s rapid transition towards electrification and higher levels of autonomy is creating substantial demand for robust, low-power precision components. Modern electric vehicles (EVs) incorporate hundreds of sensors to monitor battery management systems (BMS), thermal management, and motor control, all requiring precise voltage and current sensing with minimal quiescent current to avoid draining the high-voltage battery when the vehicle is idle. Furthermore, Advanced Driver-Assistance Systems (ADAS) such as LiDAR, radar, and camera modules depend on high-fidelity signal chains to process data accurately. The need for always-on safety systems that must function reliably in all conditions necessitates op amps that combine precision with extremely low power consumption, a technical challenge that leading semiconductor companies are actively addressing with new product families.
Technological Innovations in Semiconductor Design and Packaging
Continuous innovation in semiconductor processes and packaging technologies is fundamentally enabling the performance leaps seen in modern low power precision op amps. The adoption of advanced CMOS and BiCMOS processes allows for the integration of complex trimming and calibration circuits on-die, which actively compensate for offset and drift over temperature and time, thereby achieving precision specifications previously unattainable at such low power levels. Packaging advancements are equally critical; the use of wafer-level packaging (WLP) and chip-scale packages (CSP) minimizes parasitic effects and allows for a drastically smaller footprint, which is essential for space-constrained applications like hearing aids and miniaturized consumer electronics. These innovations are not merely incremental; they represent a paradigm shift that allows designers to overcome the traditional trade-off between power consumption, accuracy, size, and cost, opening new application vistas across industrial, automotive, and consumer segments.
COMPETITIVE LANDSCAPE
Key Industry Players
Companies Focus on Innovation and Miniaturization to Gain Competitive Edge
The global competitive landscape for low power precision op amps is fragmented yet dominated by a handful of established semiconductor giants, alongside several specialized analog IC manufacturers. This market structure is driven by the high barriers to entry associated with advanced semiconductor design and fabrication processes. Texas Instruments Incorporated is widely recognized as the market leader, commanding a significant portion of the global revenue share. Their dominance is attributed to an extensive and deeply entrenched product portfolio, including industry-standard parts like the OPA388 series, and a robust global distribution network that serves a vast array of industrial and consumer electronics customers.
Analog Devices, Inc. and STMicroelectronics are also major forces, each holding considerable market share. The sustained growth of these companies is powered by their relentless focus on research and development, enabling them to produce op amps with exceptionally low offset voltage (often below 10µV) and quiescent current consumption in the microampere range, which is critical for battery-powered applications. Furthermore, their expansion is bolstered by strategic acquisitions, such as Analog Devices’ purchase of Maxim Integrated, which expanded its precision analog offerings.
These leading players are continuously engaged in growth initiatives, including geographical expansions into high-growth regions like Asia-Pacific and the launch of innovative new products. For instance, recent product developments focus on enhancing power efficiency without compromising on precision, a key requirement for the burgeoning Internet of Things (IoT) and portable medical device markets. Such launches are anticipated to significantly bolster their market positions over the coming years.
Meanwhile, other key players like Microchip Technology Inc. and Renesas Electronics Corporation are strengthening their presence through significant investments in developing highly integrated solutions. These companies often combine precision op amps with microcontrollers or other analog components on a single chip, providing complete signal chain solutions that reduce overall system size, cost, and power consumption for their clients.
List of Key Companies Profiled
- Texas Instruments Incorporated (U.S.)
- Analog Devices, Inc. (U.S.)
- STMicroelectronics N.V. (Switzerland)
- Microchip Technology Inc. (U.S.)
- Renesas Electronics Corporation (Japan)
- NXP Semiconductors N.V. (Netherlands)
- Infineon Technologies AG (Germany)
- ON Semiconductor Corporation (U.S.)
- ROHM Semiconductor (Japan)
Segment Analysis:
By Type
General Purpose Op Amps Segment Leads Due to Versatility and Cost-Effectiveness Across Applications
The market is segmented based on type into:
- General Purpose Op Amps
- Zero-Drift Op Amps
- Rail-to-Rail Input/Output Op Amps
- Others
By Application
Industrial Automation Segment Dominates Owing to High Demand for Precision Measurement and Control Systems
The market is segmented based on application into:
- Industrial Automation
- Test and Measurement Equipment
- Medical Devices
- Consumer Electronics
- Automotive Electronics
- Others
By End User
Electronics Manufacturing Segment Holds Largest Share Fueled by Proliferation of IoT and Portable Devices
The market is segmented based on end user into:
- Electronics Manufacturing
- Automotive
- Healthcare
- Aerospace and Defense
- Others
Regional Analysis: Low Power Precision Op Amps Market
Asia-Pacific
The Asia-Pacific region dominates the global market, accounting for over 45% of total consumption, driven by massive electronics manufacturing hubs in China, South Korea, and Taiwan. The proliferation of consumer electronics, industrial automation, and IoT devices fuels demand for components that offer high precision without draining battery life. Local manufacturers prioritize cost-effectiveness, leading to high-volume production of general-purpose op amps, but there is a noticeable and accelerating shift toward adopting more sophisticated, low-power precision variants to meet the requirements of advanced medical devices, automotive electronics, and portable instrumentation. Government initiatives supporting semiconductor self-sufficiency, such as China’s significant investments in its domestic chip industry, further stimulate regional market development and innovation.
North America
North America is a key innovation and high-value market, characterized by stringent performance requirements in sectors like aerospace, defense, and medical technology. Leading semiconductor companies headquartered in the U.S. are at the forefront of developing cutting-edge low power precision op amps with ultra-low offset voltage and minimal current consumption. Demand is heavily driven by the need for reliable, high-accuracy signal conditioning in critical applications, including patient monitoring equipment, avionics systems, and test and measurement instruments. The region’s strong R&D ecosystem and early adoption of new technologies ensure a steady market for premium, high-specification components, though overall volume is lower than in Asia-Pacific due to higher costs and a focus on specialized, rather than mass-market, applications.
Europe
Europe’s market is shaped by its strong automotive industrial base and rigorous environmental regulations, which emphasize energy efficiency. The automotive sector, particularly in Germany, is a major consumer, utilizing these components in advanced driver-assistance systems (ADAS), battery management systems for electric vehicles, and various sensor interfaces. Furthermore, the region’s well-established industrial automation and instrumentation sectors require highly accurate and reliable op amps for process control and data acquisition. European manufacturers often focus on quality, reliability, and compliance with international standards, leading to demand for components that offer a balance of low power consumption, high precision, and long-term stability. Innovation is also driven by the need to meet the EU’s energy efficiency directives for electronic products.
South America
The market in South America is emerging and is primarily driven by the gradual modernization of industrial infrastructure and growing consumer electronics adoption in countries like Brazil. However, economic volatility and currency fluctuations often constrain capital expenditure for advanced electronic components. While there is demand for low power precision op amps in applications such as agricultural instrumentation, renewable energy systems, and basic industrial controls, cost sensitivity remains a significant barrier. The market is characterized by a higher reliance on imported components and a slower adoption rate of the latest generations of technology compared to more developed regions. Growth is steady but modest, with potential linked to broader economic stabilization and industrial investment.
Middle East & Africa
This region represents a nascent market with growth potential tied to infrastructure development, particularly in the Gulf Cooperation Council (GCC) nations and select African countries investing in telecommunications and energy. Demand is emerging from sectors like oil and gas (for precision monitoring equipment), telecommunications infrastructure, and renewable energy projects. However, the market is currently limited by a less diversified industrial base and a lower volume of local electronics manufacturing. Progress is often dependent on large-scale government-led projects, and the adoption of advanced components like low power precision op amps is in its early stages. While long-term potential exists, the current market size is the smallest globally, with growth trajectories closely linked to economic diversification efforts.
Report Scope
This market research report provides a comprehensive analysis of the global Low Power Precision Op Amps market, covering the forecast period 2025–2032. It offers detailed insights into market dynamics, technological advancements, competitive landscape, and key trends shaping the industry.
Key focus areas of the report include:
- Market Size & Forecast: Historical data and future projections for revenue, unit shipments, and market value across major regions and segments.
- Segmentation Analysis: Detailed breakdown by product type, technology, application, and end-user industry to identify high-growth segments and investment opportunities.
- Regional Outlook: Insights into market performance across North America, Europe, Asia-Pacific, Latin America, and the Middle East & Africa, including country-level analysis where relevant.
- Competitive Landscape: Profiles of leading market participants, including their product offerings, R&D focus, manufacturing capacity, pricing strategies, and recent developments such as mergers, acquisitions, and partnerships.
- Technology Trends & Innovation: Assessment of emerging technologies, integration of AI/IoT, semiconductor design trends, fabrication techniques, and evolving industry standards.
- Market Drivers & Restraints: Evaluation of factors driving market growth along with challenges, supply chain constraints, regulatory issues, and market-entry barriers.
- Stakeholder Analysis: Insights for component suppliers, OEMs, system integrators, investors, and policymakers regarding the evolving ecosystem and strategic opportunities.
Primary and secondary research methods are employed, including interviews with industry experts, data from verified sources, and real-time market intelligence to ensure the accuracy and reliability of the insights presented.
FREQUENTLY ASKED QUESTIONS:
What is the current market size of Global Low Power Precision Op Amps Market?
-> Low Power Precision Op Amps Market was valued at 597 million in 2024 and is projected to reach US$ 770 million by 2032, at a CAGR of 3.8% during the forecast period.
Which key companies operate in Global Low Power Precision Op Amps Market?
-> Key players include Texas Instruments, Analog Devices Inc., STMicroelectronics, Microchip Technology, and Renesas Electronics, among others.
What are the key growth drivers?
-> Key growth drivers include rising demand for portable medical devices, expansion of IoT infrastructure, and automotive electrification trends.
Which region dominates the market?
-> Asia-Pacific is the fastest-growing region, while North America remains a dominant market.
What are the emerging trends?
-> Emerging trends include integration with AI-powered systems, development of ultra-low-power variants, and advanced packaging technologies.

Get Sample Report PDF for Exclusive Insights
Report Sample Includes
- Table of Contents
- List of Tables & Figures
- Charts, Research Methodology, and more...


