Land Grid Array (LGA) Packaging Market, Trends, Business Strategies 2025-2032

Land Grid Array (LGA) Packaging Market was valued at 401 million in 2024 and is projected to reach US$ 674 million by 2032, at a CAGR of 7.9% during the forecast period

PDF Icon Download Sample Report PDF
  • Quick Dispatch

    All Orders

  • Secure Payment

    100% Secure Payment

Price range: $1,500.00 through $4,250.00

Clear

MARKET INSIGHTS

The global Land Grid Array (LGA) Packaging Market was valued at 401 million in 2024 and is projected to reach US$ 674 million by 2032, at a CAGR of 7.9% during the forecast period.
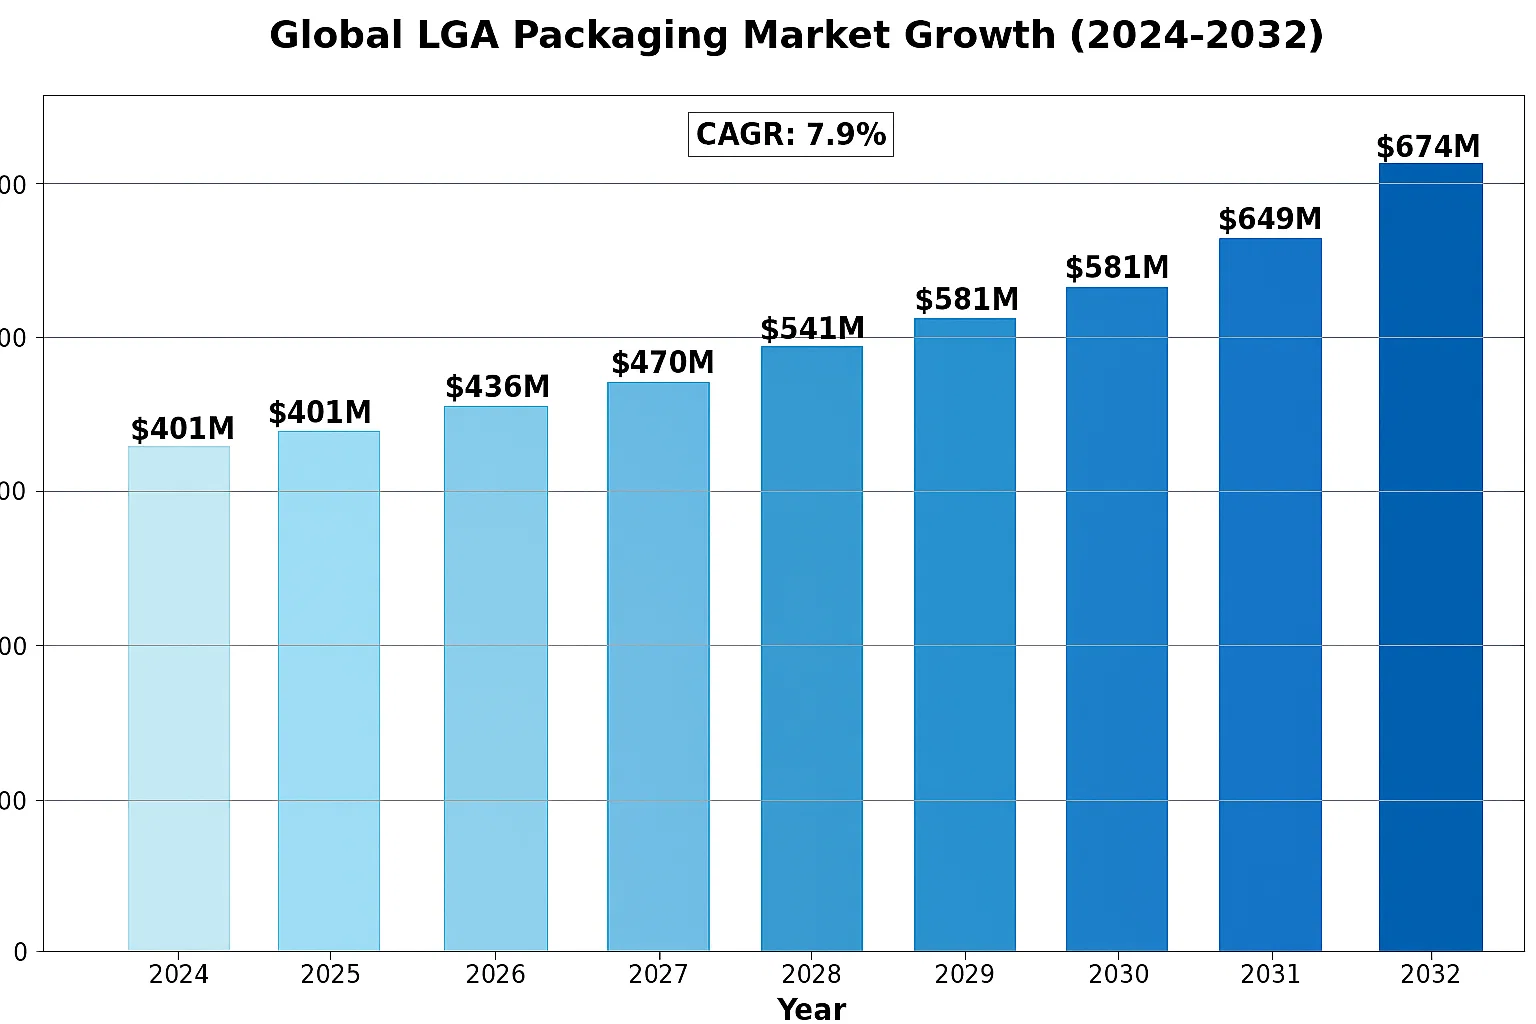
Global Land Grid Array Packaging Market

Land Grid Array (LGA) packaging is an advanced semiconductor packaging technology that improves upon traditional Ball Grid Array (BGA) solutions. Unlike BGA packages that use solder balls, LGA utilizes flat contact pads arranged in a grid pattern on the package bottom, enabling thinner and lighter designs while maintaining high electrical performance. This makes LGA particularly suitable for applications requiring compact form factors and efficient thermal management.

The market growth is primarily driven by the expanding semiconductor industry, which was valued at USD 579 billion in 2022 and is projected to reach USD 790 billion by 2029. Key applications benefiting from LGA packaging include consumer electronics, automotive systems, and optoelectronic components. While the microprocessor segment shows stagnant growth due to reduced PC demand, emerging IoT applications create new opportunities for advanced packaging solutions like LGA. The technology’s ability to support high-density interconnects while reducing package height makes it increasingly valuable in space-constrained applications.

MARKET DYNAMICS

MARKET DRIVERS

Growing Demand for High-Performance Computing Accelerates LGA Adoption

The exponential growth in data processing requirements is driving unprecedented demand for advanced semiconductor packaging solutions like Land Grid Array (LGA). With the global high-performance computing market projected to grow at over 9% annually through 2030, semiconductor manufacturers are increasingly adopting LGA packages for their superior thermal performance and high-density interconnect capabilities. The technology’s ability to support higher pin counts without increasing package size makes it particularly valuable for processors used in data centers, AI applications, and 5G infrastructure. Recent product launches demonstrate this trend, with major CPU manufacturers transitioning more product lines to LGA packaging to meet the evolving needs of high-performance computing.

Expansion of IoT and Edge Computing Creates New Growth Avenues

The rapid proliferation of IoT devices and edge computing infrastructure presents significant growth opportunities for LGA packaging. As the number of connected devices is expected to surpass 30 billion by 2030, semiconductor manufacturers require packaging solutions that offer reliable performance in constrained spaces. LGA packages are becoming the preferred choice for IoT applications due to their compact footprint, excellent thermal dissipation properties, and resistance to mechanical stress. The technology’s compatibility with automated surface mount processes makes it particularly suitable for high-volume production of IoT components. Furthermore, the growing complexity of edge computing devices demands packaging solutions that can integrate multiple functions while maintaining robust performance, a requirement that aligns perfectly with LGA’s capabilities.

Automotive Semiconductor Boom Fuels Market Expansion

The automotive industry’s accelerating digital transformation is creating substantial demand for advanced semiconductor packaging. With modern vehicles containing over 3,000 chips on average, automakers are increasingly adopting LGA packaging for critical components like ADAS processors and infotainment systems. The technology’s vibration resistance and thermal stability make it particularly suitable for harsh automotive environments. As vehicle electrification and autonomous driving technologies advance, the automotive semiconductor market is projected to grow at nearly 10% CAGR through 2030, presenting a significant opportunity for LGA packaging providers.

MARKET RESTRAINTS

Design Complexity and Higher Manufacturing Costs Limit Market Penetration

While LGA packaging offers numerous technical advantages, its adoption faces constraints from design complexity and production costs. The precision required for land grid array fabrication results in manufacturing costs that are typically 15-20% higher than conventional packaging solutions. This cost differential creates a significant barrier for price-sensitive applications, particularly in consumer electronics where margins are tight. Additionally, the sophisticated design requirements of LGA packages demand specialized engineering expertise, which can lengthen development cycles for new products.

Other Restraints

Thermal Management Challenges
As transistor densities continue to increase, managing heat dissipation in LGA packages becomes increasingly complex. The absence of solder balls in LGA designs creates thermal bottlenecks that require advanced cooling solutions, adding to system costs and design complexity.

Supply Chain Vulnerabilities
The semiconductor industry’s ongoing supply chain challenges particularly affect specialty packaging solutions like LGA. The specialized materials and equipment required for LGA manufacturing create dependencies on specific suppliers, heightening vulnerability to disruptions.

MARKET CHALLENGES

Technical Limitations in High-Frequency Applications Constrain Market Growth

The LGA packaging market faces significant challenges in meeting the demands of emerging high-frequency applications. While LGA excels in many conventional computing applications, its performance in millimeter-wave frequencies (above 24 GHz) presents technical hurdles. The increasing adoption of 5G and upcoming 6G technologies requires packaging solutions capable of maintaining signal integrity at extremely high frequencies, where LGA designs often encounter limitations. These technical constraints are becoming more pronounced as wireless communication standards advance and processor clock speeds continue their upward trajectory.

Other Challenges

Miniaturization Race
The semiconductor industry’s relentless drive toward smaller form factors creates continuous pressure on packaging technologies. While LGA offers advantages in many applications, maintaining competitiveness against emerging wafer-level packaging solutions requires ongoing innovation in substrate technologies and interconnection methods.

Testing and Validation Complexity
The comprehensive testing protocols required for LGA packages significantly increase time-to-market for new products. The need for specialized test sockets and handlers adds both cost and complexity to the validation process, particularly for high-pin-count configurations exceeding 2,000 contacts.

MARKET OPPORTUNITIES

Emerging Applications in AI Hardware Present Lucrative Growth Potential

The rapid advancement of artificial intelligence technologies is creating unprecedented opportunities for specialized semiconductor packaging. As AI accelerators evolve to support increasingly complex neural networks, LGA packaging is well-positioned to meet the demanding requirements of these applications. The technology’s ability to support high pin counts and efficient power delivery makes it particularly suitable for next-generation AI processors. With the AI chip market projected to expand at 35% CAGR through 2030, semiconductor packaging providers have significant opportunities to capitalize on this growth trajectory.

Advanced Packaging Integration Creates New Value Propositions

The growing trend toward heterogeneous integration and chiplet-based designs presents compelling opportunities for LGA packaging evolution. By combining LGA technology with emerging 2.5D and 3D packaging approaches, manufacturers can create solutions that deliver superior performance while maintaining cost competitiveness. This convergence of packaging technologies is particularly valuable for applications requiring high-bandwidth memory interfaces, where LGA’s robust interconnection capabilities can complement advanced silicon interposer solutions.

Geographic Expansion in Emerging Markets Offers Growth Prospects

The establishment of new semiconductor manufacturing facilities in previously underserved regions presents significant opportunities for LGA packaging providers. With semiconductor production capacity in regions like Southeast Asia expected to grow by over 40% in the next five years, packaging solution providers have opportunities to establish partnerships with emerging foundries and IDMs. This geographic diversification can help mitigate supply chain risks while tapping into growing regional demand for advanced semiconductor solutions.

LAND GRID ARRAY (LGA) PACKAGING MARKET TRENDS

Miniaturization and High-Performance Computing Drive LGA Adoption

The Land Grid Array (LGA) packaging market is experiencing significant growth due to increasing demand for miniaturized, high-performance semiconductor solutions across multiple industries. With a projected CAGR of 7.9%, the market is anticipated to reach $674 million by 2032, up from $401 million in 2023. This growth is primarily fueled by the need for thinner, lighter packaging solutions that offer superior electrical performance compared to traditional Ball Grid Array (BGA) packages. The consumer electronics sector accounts for nearly 42% of total LGA package demand, driven by smartphones, tablets, and wearable devices that require compact form factors without compromising processing power.

Other Trends

Automotive Sector Emerges as Key Growth Driver

Advancements in automotive electronics, particularly for advanced driver-assistance systems (ADAS) and in-vehicle infotainment, are creating substantial opportunities for LGA packaging. Modern vehicles now incorporate over 3,000 semiconductor components on average, many requiring the reliable thermal and electrical performance that LGA packages provide. The automotive segment is projected to grow at 11.3% annually through 2032, outpacing other applications. Furthermore, the rise of vehicle electrification demands robust packaging solutions capable of withstanding harsh operating environments while maintaining signal integrity across complex electronic systems.

Technological Innovations Reshape Packaging Landscape

Recent developments in embedded die packaging and 3D IC integration are pushing the boundaries of LGA technology. Manufacturers are now producing packages with pin counts exceeding 4,000 while maintaining heights under 1mm to meet data center and AI processor requirements. The shift towards system-in-package (SiP) designs has increased LGA adoption by 19% year-over-year in networking equipment. Additionally, improved thermal management solutions allow LGA packages to handle power densities above 100W/cm², making them viable for next-generation GPU and CPU applications where traditional packaging would struggle with heat dissipation.

COMPETITIVE LANDSCAPE

Key Industry Players

Established Players and Emerging Competitors Vie for Market Share

The Land Grid Array (LGA) packaging market features a dynamic competitive environment with both dominant semiconductor players and specialized packaging firms. The market is projected to grow at a 7.9% CAGR through 2032, intensifying competition as companies expand their technological capabilities. ASE Holdings currently leads the market with approximately 22% revenue share, leveraging its vertically integrated manufacturing approach and global customer base.

Amkor Technology follows closely, capturing nearly 18% market share through its advanced packaging solutions tailored for high-performance computing applications. Their recent partnership with a leading automotive semiconductor manufacturer has significantly strengthened their position in the automotive electronics segment. Meanwhile, Orient Semiconductor Electronics has emerged as a key challenger, particularly in the Asia-Pacific region where it holds 15% of regional LGA packaging revenue.

The competitive intensity is further heightened by strategic movements from IDMs (Integrated Device Manufacturers) like NXP Semiconductors and Analog Devices, who are bringing more packaging operations in-house. These companies balance internal LGA packaging capabilities with outsourced production, creating a hybrid model that optimizes costs while maintaining quality control.

Technological differentiation has become crucial in this market. GS Nanotech has gained traction with its nano-enhanced LGA solutions that improve thermal performance by 30%, particularly appealing for 5G infrastructure components. Smaller specialized firms are responding by forming alliances with materials science companies, while larger players acquire niche technology providers to bolster their portfolios.

List of Key LGA Packaging Companies Profiled

Segment Analysis:

By Type

Hot Air Soldering Dominates the Market Due to Superior Thermal Management in High-Density Packaging

The market is segmented based on type into:

  • Hot Air Soldering
  • Infrared Soldering
  • Vapor Phase Soldering
  • Laser Soldering
  • Others

By Application

Consumer Electronics Segment Leads Due to Surging Demand for Compact Semiconductor Packaging

The market is segmented based on application into:

  • Consumer Electronics
  • Automotive Electronics
  • Optoelectronic Components
  • Industrial Electronics
  • Others

Regional Analysis: Land Grid Array (LGA) Packaging Market

North America
North America holds a strong position in the LGA packaging market, primarily due to advanced semiconductor manufacturing capabilities and significant investments in R&D. The U.S. dominates the regional landscape, supported by leading semiconductor firms such as Analog Devices and Maxim Integrated. The demand for LGA packaging is driven by high-performance computing, automotive electronics, and IoT applications. With the CHIPS and Science Act allocating $52 billion to bolster domestic semiconductor production, the region is expected to reinforce its supply chain resilience, further accelerating LGA adoption. However, stringent regulatory compliance and higher production costs remain challenges for market expansion.

Europe
Europe’s LGA packaging market is characterized by a strong emphasis on automotive and industrial electronics, particularly in Germany and France. The presence of key players like NXP and Thales Group supports innovation in high-reliability LGA solutions for automotive ADAS and industrial IoT applications. The EU’s focus on semiconductor sovereignty, backed by the €43 billion Chips Act, is expected to enhance local packaging capabilities. However, slower growth in consumer electronics and reliance on external foundries restrict immediate market expansion. Sustainability initiatives and regulatory pressures toward lead-free packaging also influence regional dynamics.

Asia-Pacific
Asia-Pacific is the largest and fastest-growing LGA packaging market, accounting for over 60% of global demand. China, Taiwan, Japan, and South Korea lead production due to robust semiconductor ecosystems, with major OSAT players such as ASE Holdings and Amkor operating in the region. The proliferation of 5G, AI, and consumer electronics drives LGA adoption, particularly in smartphones and data centers. Government incentives, such as China’s semiconductor self-sufficiency push, further boost local packaging capabilities. While cost competitiveness remains an advantage, geopolitical risks and supply chain disruptions pose challenges for stable growth.

South America
South America’s LGA packaging market remains nascent, with limited local manufacturing and reliance on imports. Brazil is the primary demand center, driven by automotive and telecommunications investments. However, economic instability, underdeveloped semiconductor infrastructure, and currency fluctuations hinder market penetration. Some regional progress is noted in Argentina, where government-backed tech initiatives aim to bolster electronics production. Nonetheless, the market’s growth trajectory remains modest compared to global peers, constrained by weak industrial demand and technological gaps.

Middle East & Africa
The MEA region is an emerging market for LGA packaging, with selective demand from Israel, Saudi Arabia, and the UAE. Israel’s thriving tech sector—particularly in defense and optoelectronics—fuels niche LGA applications, while Gulf nations invest in smart infrastructure, indirectly supporting packaging demand. However, low semiconductor industry maturity and limited domestic production capacity result in heavy reliance on imports. Long-term growth potential exists through diversification initiatives, such as Saudi Arabia’s Vision 2030, which prioritizes localized electronics manufacturing and R&D development.

Report Scope

This market research report provides a comprehensive analysis of the Global and Regional Semiconductor Packaging markets, focusing on Land Grid Array (LGA) Packaging technology, covering the forecast period 2025–2032. It offers detailed insights into market dynamics, technological advancements, competitive landscape, and key trends shaping the industry.

Key focus areas of the report include:

  • Market Size & Forecast: Historical data and future projections for revenue, unit shipments, and market value across major regions and segments. The Global LGA Packaging market was valued at USD 401 million in 2024 and is projected to reach USD 674 million by 2032, growing at a CAGR of 7.9%.
  • Segmentation Analysis: Detailed breakdown by product type (Hot Air Soldering vs. Infrared Soldering), application (Consumer Electronics, Automotive, Optoelectronic Components), and end-user industry to identify high-growth segments.
  • Regional Outlook: Insights into market performance across North America, Europe, Asia-Pacific (which accounted for 62% market share in 2024), Latin America, and the Middle East & Africa.
  • Competitive Landscape: Profiles of leading market participants including ASE Holdings, Amkor, NXP, and Analog Devices, covering their product portfolios, R&D investments, and strategic partnerships.
  • Technology Trends & Innovation: Assessment of emerging semiconductor packaging technologies, miniaturization trends, thermal management solutions, and integration with IoT/5G applications.
  • Market Drivers & Restraints: Analysis of growth drivers like rising demand for compact electronics (IoT devices grew 18% YoY in 2023) and challenges including supply chain complexities in semiconductor materials.
  • Stakeholder Analysis: Strategic insights for semiconductor manufacturers, OSAT providers, OEMs, and investors regarding the evolving packaging technology landscape.

The research employs both primary and secondary methodologies, including interviews with key industry players and analysis of verified market data from regulatory filings and trade associations.

FREQUENTLY ASKED QUESTIONS:

What is the current market size of Global LGA Packaging Market?

-> Land Grid Array (LGA) Packaging Market was valued at 401 million in 2024 and is projected to reach US$ 674 million by 2032, at a CAGR of 7.9% during the forecast period.

Which key companies operate in Global LGA Packaging Market?

-> Key players include ASE Holdings, Amkor Technology, NXP Semiconductors, Analog Devices, and Orient Semiconductor Electronics, collectively holding 68% market share in 2024.

What are the key growth drivers?

-> Primary growth drivers include increasing adoption in consumer electronics (48% market share), automotive semiconductor demand (22% CAGR in EV applications), and miniaturization trends in IoT devices.

Which region dominates the market?

-> Asia-Pacific dominates with 62% market share in 2024, led by China’s semiconductor packaging ecosystem, while North America leads

Land Grid Array (LGA) Packaging Market, Trends, Business Strategies 2025-2032

Get Sample Report PDF for Exclusive Insights

Report Sample Includes

  • Table of Contents
  • List of Tables & Figures
  • Charts, Research Methodology, and more...

PDF Icon Download Sample Report PDF

Download Sample Report

Table of Content

1 Introduction to Research & Analysis Reports
1.1 Land Grid Array (LGA) Packaging Market Definition
1.2 Market Segments
1.2.1 Segment by Type
1.2.2 Segment by Application
1.3 Global Land Grid Array (LGA) Packaging Market Overview
1.4 Features & Benefits of This Report
1.5 Methodology & Sources of Information
1.5.1 Research Methodology
1.5.2 Research Process
1.5.3 Base Year
1.5.4 Report Assumptions & Caveats
2 Global Land Grid Array (LGA) Packaging Overall Market Size
2.1 Global Land Grid Array (LGA) Packaging Market Size: 2024 VS 2032
2.2 Global Land Grid Array (LGA) Packaging Market Size, Prospects & Forecasts: 2020-2032
2.3 Global Land Grid Array (LGA) Packaging Sales: 2020-2032
3 Company Landscape
3.1 Top Land Grid Array (LGA) Packaging Players in Global Market
3.2 Top Global Land Grid Array (LGA) Packaging Companies Ranked by Revenue
3.3 Global Land Grid Array (LGA) Packaging Revenue by Companies
3.4 Global Land Grid Array (LGA) Packaging Sales by Companies
3.5 Global Land Grid Array (LGA) Packaging Price by Manufacturer (2020-2025)
3.6 Top 3 and Top 5 Land Grid Array (LGA) Packaging Companies in Global Market, by Revenue in 2024
3.7 Global Manufacturers Land Grid Array (LGA) Packaging Product Type
3.8 Tier 1, Tier 2, and Tier 3 Land Grid Array (LGA) Packaging Players in Global Market
3.8.1 List of Global Tier 1 Land Grid Array (LGA) Packaging Companies
3.8.2 List of Global Tier 2 and Tier 3 Land Grid Array (LGA) Packaging Companies
4 Sights by Product
4.1 Overview
4.1.1 Segment by Type – Global Land Grid Array (LGA) Packaging Market Size Markets, 2024 & 2032
4.1.2 Hot Air Soldering
4.1.3 Infrared Soldering
4.2 Segment by Type – Global Land Grid Array (LGA) Packaging Revenue & Forecasts
4.2.1 Segment by Type – Global Land Grid Array (LGA) Packaging Revenue, 2020-2025
4.2.2 Segment by Type – Global Land Grid Array (LGA) Packaging Revenue, 2026-2032
4.2.3 Segment by Type – Global Land Grid Array (LGA) Packaging Revenue Market Share, 2020-2032
4.3 Segment by Type – Global Land Grid Array (LGA) Packaging Sales & Forecasts
4.3.1 Segment by Type – Global Land Grid Array (LGA) Packaging Sales, 2020-2025
4.3.2 Segment by Type – Global Land Grid Array (LGA) Packaging Sales, 2026-2032
4.3.3 Segment by Type – Global Land Grid Array (LGA) Packaging Sales Market Share, 2020-2032
4.4 Segment by Type – Global Land Grid Array (LGA) Packaging Price (Manufacturers Selling Prices), 2020-2032
5 Sights by Application
5.1 Overview
5.1.1 Segment by Application – Global Land Grid Array (LGA) Packaging Market Size, 2024 & 2032
5.1.2 Consumer Electronics
5.1.3 Automotive
5.1.4 Optoelectronic Components
5.1.5 Others
5.2 Segment by Application – Global Land Grid Array (LGA) Packaging Revenue & Forecasts
5.2.1 Segment by Application – Global Land Grid Array (LGA) Packaging Revenue, 2020-2025
5.2.2 Segment by Application – Global Land Grid Array (LGA) Packaging Revenue, 2026-2032
5.2.3 Segment by Application – Global Land Grid Array (LGA) Packaging Revenue Market Share, 2020-2032
5.3 Segment by Application – Global Land Grid Array (LGA) Packaging Sales & Forecasts
5.3.1 Segment by Application – Global Land Grid Array (LGA) Packaging Sales, 2020-2025
5.3.2 Segment by Application – Global Land Grid Array (LGA) Packaging Sales, 2026-2032
5.3.3 Segment by Application – Global Land Grid Array (LGA) Packaging Sales Market Share, 2020-2032
5.4 Segment by Application – Global Land Grid Array (LGA) Packaging Price (Manufacturers Selling Prices), 2020-2032
6 Sights by Region
6.1 By Region – Global Land Grid Array (LGA) Packaging Market Size, 2024 & 2032
6.2 By Region – Global Land Grid Array (LGA) Packaging Revenue & Forecasts
6.2.1 By Region – Global Land Grid Array (LGA) Packaging Revenue, 2020-2025
6.2.2 By Region – Global Land Grid Array (LGA) Packaging Revenue, 2026-2032
6.2.3 By Region – Global Land Grid Array (LGA) Packaging Revenue Market Share, 2020-2032
6.3 By Region – Global Land Grid Array (LGA) Packaging Sales & Forecasts
6.3.1 By Region – Global Land Grid Array (LGA) Packaging Sales, 2020-2025
6.3.2 By Region – Global Land Grid Array (LGA) Packaging Sales, 2026-2032
6.3.3 By Region – Global Land Grid Array (LGA) Packaging Sales Market Share, 2020-2032
6.4 North America
6.4.1 By Country – North America Land Grid Array (LGA) Packaging Revenue, 2020-2032
6.4.2 By Country – North America Land Grid Array (LGA) Packaging Sales, 2020-2032
6.4.3 United States Land Grid Array (LGA) Packaging Market Size, 2020-2032
6.4.4 Canada Land Grid Array (LGA) Packaging Market Size, 2020-2032
6.4.5 Mexico Land Grid Array (LGA) Packaging Market Size, 2020-2032
6.5 Europe
6.5.1 By Country – Europe Land Grid Array (LGA) Packaging Revenue, 2020-2032
6.5.2 By Country – Europe Land Grid Array (LGA) Packaging Sales, 2020-2032
6.5.3 Germany Land Grid Array (LGA) Packaging Market Size, 2020-2032
6.5.4 France Land Grid Array (LGA) Packaging Market Size, 2020-2032
6.5.5 U.K. Land Grid Array (LGA) Packaging Market Size, 2020-2032
6.5.6 Italy Land Grid Array (LGA) Packaging Market Size, 2020-2032
6.5.7 Russia Land Grid Array (LGA) Packaging Market Size, 2020-2032
6.5.8 Nordic Countries Land Grid Array (LGA) Packaging Market Size, 2020-2032
6.5.9 Benelux Land Grid Array (LGA) Packaging Market Size, 2020-2032
6.6 Asia
6.6.1 By Region – Asia Land Grid Array (LGA) Packaging Revenue, 2020-2032
6.6.2 By Region – Asia Land Grid Array (LGA) Packaging Sales, 2020-2032
6.6.3 China Land Grid Array (LGA) Packaging Market Size, 2020-2032
6.6.4 Japan Land Grid Array (LGA) Packaging Market Size, 2020-2032
6.6.5 South Korea Land Grid Array (LGA) Packaging Market Size, 2020-2032
6.6.6 Southeast Asia Land Grid Array (LGA) Packaging Market Size, 2020-2032
6.6.7 India Land Grid Array (LGA) Packaging Market Size, 2020-2032
6.7 South America
6.7.1 By Country – South America Land Grid Array (LGA) Packaging Revenue, 2020-2032
6.7.2 By Country – South America Land Grid Array (LGA) Packaging Sales, 2020-2032
6.7.3 Brazil Land Grid Array (LGA) Packaging Market Size, 2020-2032
6.7.4 Argentina Land Grid Array (LGA) Packaging Market Size, 2020-2032
6.8 Middle East & Africa
6.8.1 By Country – Middle East & Africa Land Grid Array (LGA) Packaging Revenue, 2020-2032
6.8.2 By Country – Middle East & Africa Land Grid Array (LGA) Packaging Sales, 2020-2032
6.8.3 Turkey Land Grid Array (LGA) Packaging Market Size, 2020-2032
6.8.4 Israel Land Grid Array (LGA) Packaging Market Size, 2020-2032
6.8.5 Saudi Arabia Land Grid Array (LGA) Packaging Market Size, 2020-2032
6.8.6 UAE Land Grid Array (LGA) Packaging Market Size, 2020-2032
7 Manufacturers & Brands Profiles
7.1 Orient Semiconductor Electronics
7.1.1 Orient Semiconductor Electronics Company Summary
7.1.2 Orient Semiconductor Electronics Business Overview
7.1.3 Orient Semiconductor Electronics Land Grid Array (LGA) Packaging Major Product Offerings
7.1.4 Orient Semiconductor Electronics Land Grid Array (LGA) Packaging Sales and Revenue in Global (2020-2025)
7.1.5 Orient Semiconductor Electronics Key News & Latest Developments
7.2 NXP
7.2.1 NXP Company Summary
7.2.2 NXP Business Overview
7.2.3 NXP Land Grid Array (LGA) Packaging Major Product Offerings
7.2.4 NXP Land Grid Array (LGA) Packaging Sales and Revenue in Global (2020-2025)
7.2.5 NXP Key News & Latest Developments
7.3 Maxim Integrated
7.3.1 Maxim Integrated Company Summary
7.3.2 Maxim Integrated Business Overview
7.3.3 Maxim Integrated Land Grid Array (LGA) Packaging Major Product Offerings
7.3.4 Maxim Integrated Land Grid Array (LGA) Packaging Sales and Revenue in Global (2020-2025)
7.3.5 Maxim Integrated Key News & Latest Developments
7.4 Thales Group
7.4.1 Thales Group Company Summary
7.4.2 Thales Group Business Overview
7.4.3 Thales Group Land Grid Array (LGA) Packaging Major Product Offerings
7.4.4 Thales Group Land Grid Array (LGA) Packaging Sales and Revenue in Global (2020-2025)
7.4.5 Thales Group Key News & Latest Developments
7.5 Analog Devices
7.5.1 Analog Devices Company Summary
7.5.2 Analog Devices Business Overview
7.5.3 Analog Devices Land Grid Array (LGA) Packaging Major Product Offerings
7.5.4 Analog Devices Land Grid Array (LGA) Packaging Sales and Revenue in Global (2020-2025)
7.5.5 Analog Devices Key News & Latest Developments
7.6 ASE Holdings
7.6.1 ASE Holdings Company Summary
7.6.2 ASE Holdings Business Overview
7.6.3 ASE Holdings Land Grid Array (LGA) Packaging Major Product Offerings
7.6.4 ASE Holdings Land Grid Array (LGA) Packaging Sales and Revenue in Global (2020-2025)
7.6.5 ASE Holdings Key News & Latest Developments
7.7 GS Nanotech
7.7.1 GS Nanotech Company Summary
7.7.2 GS Nanotech Business Overview
7.7.3 GS Nanotech Land Grid Array (LGA) Packaging Major Product Offerings
7.7.4 GS Nanotech Land Grid Array (LGA) Packaging Sales and Revenue in Global (2020-2025)
7.7.5 GS Nanotech Key News & Latest Developments
7.8 Amkor
7.8.1 Amkor Company Summary
7.8.2 Amkor Business Overview
7.8.3 Amkor Land Grid Array (LGA) Packaging Major Product Offerings
7.8.4 Amkor Land Grid Array (LGA) Packaging Sales and Revenue in Global (2020-2025)
7.8.5 Amkor Key News & Latest Developments
8 Global Land Grid Array (LGA) Packaging Production Capacity, Analysis
8.1 Global Land Grid Array (LGA) Packaging Production Capacity, 2020-2032
8.2 Land Grid Array (LGA) Packaging Production Capacity of Key Manufacturers in Global Market
8.3 Global Land Grid Array (LGA) Packaging Production by Region
9 Key Market Trends, Opportunity, Drivers and Restraints
9.1 Market Opportunities & Trends
9.2 Market Drivers
9.3 Market Restraints
10 Land Grid Array (LGA) Packaging Supply Chain Analysis
10.1 Land Grid Array (LGA) Packaging Industry Value Chain
10.2 Land Grid Array (LGA) Packaging Upstream Market
10.3 Land Grid Array (LGA) Packaging Downstream and Clients
10.4 Marketing Channels Analysis
10.4.1 Marketing Channels
10.4.2 Land Grid Array (LGA) Packaging Distributors and Sales Agents in Global
11 Conclusion
12 Appendix
12.1 Note
12.2 Examples of Clients
12.3 DisclaimerList of Tables
Table 1. Key Players of Land Grid Array (LGA) Packaging in Global Market
Table 2. Top Land Grid Array (LGA) Packaging Players in Global Market, Ranking by Revenue (2024)
Table 3. Global Land Grid Array (LGA) Packaging Revenue by Companies, (US$, Mn), 2020-2025
Table 4. Global Land Grid Array (LGA) Packaging Revenue Share by Companies, 2020-2025
Table 5. Global Land Grid Array (LGA) Packaging Sales by Companies, (K Units), 2020-2025
Table 6. Global Land Grid Array (LGA) Packaging Sales Share by Companies, 2020-2025
Table 7. Key Manufacturers Land Grid Array (LGA) Packaging Price (2020-2025) & (US$/Unit)
Table 8. Global Manufacturers Land Grid Array (LGA) Packaging Product Type
Table 9. List of Global Tier 1 Land Grid Array (LGA) Packaging Companies, Revenue (US$, Mn) in 2024 and Market Share
Table 10. List of Global Tier 2 and Tier 3 Land Grid Array (LGA) Packaging Companies, Revenue (US$, Mn) in 2024 and Market Share
Table 11. Segment by Type – Global Land Grid Array (LGA) Packaging Revenue, (US$, Mn), 2024 & 2032
Table 12. Segment by Type – Global Land Grid Array (LGA) Packaging Revenue (US$, Mn), 2020-2025
Table 13. Segment by Type – Global Land Grid Array (LGA) Packaging Revenue (US$, Mn), 2026-2032
Table 14. Segment by Type – Global Land Grid Array (LGA) Packaging Sales (K Units), 2020-2025
Table 15. Segment by Type – Global Land Grid Array (LGA) Packaging Sales (K Units), 2026-2032
Table 16. Segment by Application – Global Land Grid Array (LGA) Packaging Revenue, (US$, Mn), 2024 & 2032
Table 17. Segment by Application – Global Land Grid Array (LGA) Packaging Revenue, (US$, Mn), 2020-2025
Table 18. Segment by Application – Global Land Grid Array (LGA) Packaging Revenue, (US$, Mn), 2026-2032
Table 19. Segment by Application – Global Land Grid Array (LGA) Packaging Sales, (K Units), 2020-2025
Table 20. Segment by Application – Global Land Grid Array (LGA) Packaging Sales, (K Units), 2026-2032
Table 21. By Region – Global Land Grid Array (LGA) Packaging Revenue, (US$, Mn), 2025-2032
Table 22. By Region – Global Land Grid Array (LGA) Packaging Revenue, (US$, Mn), 2020-2025
Table 23. By Region – Global Land Grid Array (LGA) Packaging Revenue, (US$, Mn), 2026-2032
Table 24. By Region – Global Land Grid Array (LGA) Packaging Sales, (K Units), 2020-2025
Table 25. By Region – Global Land Grid Array (LGA) Packaging Sales, (K Units), 2026-2032
Table 26. By Country – North America Land Grid Array (LGA) Packaging Revenue, (US$, Mn), 2020-2025
Table 27. By Country – North America Land Grid Array (LGA) Packaging Revenue, (US$, Mn), 2026-2032
Table 28. By Country – North America Land Grid Array (LGA) Packaging Sales, (K Units), 2020-2025
Table 29. By Country – North America Land Grid Array (LGA) Packaging Sales, (K Units), 2026-2032
Table 30. By Country – Europe Land Grid Array (LGA) Packaging Revenue, (US$, Mn), 2020-2025
Table 31. By Country – Europe Land Grid Array (LGA) Packaging Revenue, (US$, Mn), 2026-2032
Table 32. By Country – Europe Land Grid Array (LGA) Packaging Sales, (K Units), 2020-2025
Table 33. By Country – Europe Land Grid Array (LGA) Packaging Sales, (K Units), 2026-2032
Table 34. By Region – Asia Land Grid Array (LGA) Packaging Revenue, (US$, Mn), 2020-2025
Table 35. By Region – Asia Land Grid Array (LGA) Packaging Revenue, (US$, Mn), 2026-2032
Table 36. By Region – Asia Land Grid Array (LGA) Packaging Sales, (K Units), 2020-2025
Table 37. By Region – Asia Land Grid Array (LGA) Packaging Sales, (K Units), 2026-2032
Table 38. By Country – South America Land Grid Array (LGA) Packaging Revenue, (US$, Mn), 2020-2025
Table 39. By Country – South America Land Grid Array (LGA) Packaging Revenue, (US$, Mn), 2026-2032
Table 40. By Country – South America Land Grid Array (LGA) Packaging Sales, (K Units), 2020-2025
Table 41. By Country – South America Land Grid Array (LGA) Packaging Sales, (K Units), 2026-2032
Table 42. By Country – Middle East & Africa Land Grid Array (LGA) Packaging Revenue, (US$, Mn), 2020-2025
Table 43. By Country – Middle East & Africa Land Grid Array (LGA) Packaging Revenue, (US$, Mn), 2026-2032
Table 44. By Country – Middle East & Africa Land Grid Array (LGA) Packaging Sales, (K Units), 2020-2025
Table 45. By Country – Middle East & Africa Land Grid Array (LGA) Packaging Sales, (K Units), 2026-2032
Table 46. Orient Semiconductor Electronics Company Summary
Table 47. Orient Semiconductor Electronics Land Grid Array (LGA) Packaging Product Offerings
Table 48. Orient Semiconductor Electronics Land Grid Array (LGA) Packaging Sales (K Units), Revenue (US$, Mn) and Average Price (US$/Unit) & (2020-2025)
Table 49. Orient Semiconductor Electronics Key News & Latest Developments
Table 50. NXP Company Summary
Table 51. NXP Land Grid Array (LGA) Packaging Product Offerings
Table 52. NXP Land Grid Array (LGA) Packaging Sales (K Units), Revenue (US$, Mn) and Average Price (US$/Unit) & (2020-2025)
Table 53. NXP Key News & Latest Developments
Table 54. Maxim Integrated Company Summary
Table 55. Maxim Integrated Land Grid Array (LGA) Packaging Product Offerings
Table 56. Maxim Integrated Land Grid Array (LGA) Packaging Sales (K Units), Revenue (US$, Mn) and Average Price (US$/Unit) & (2020-2025)
Table 57. Maxim Integrated Key News & Latest Developments
Table 58. Thales Group Company Summary
Table 59. Thales Group Land Grid Array (LGA) Packaging Product Offerings
Table 60. Thales Group Land Grid Array (LGA) Packaging Sales (K Units), Revenue (US$, Mn) and Average Price (US$/Unit) & (2020-2025)
Table 61. Thales Group Key News & Latest Developments
Table 62. Analog Devices Company Summary
Table 63. Analog Devices Land Grid Array (LGA) Packaging Product Offerings
Table 64. Analog Devices Land Grid Array (LGA) Packaging Sales (K Units), Revenue (US$, Mn) and Average Price (US$/Unit) & (2020-2025)
Table 65. Analog Devices Key News & Latest Developments
Table 66. ASE Holdings Company Summary
Table 67. ASE Holdings Land Grid Array (LGA) Packaging Product Offerings
Table 68. ASE Holdings Land Grid Array (LGA) Packaging Sales (K Units), Revenue (US$, Mn) and Average Price (US$/Unit) & (2020-2025)
Table 69. ASE Holdings Key News & Latest Developments
Table 70. GS Nanotech Company Summary
Table 71. GS Nanotech Land Grid Array (LGA) Packaging Product Offerings
Table 72. GS Nanotech Land Grid Array (LGA) Packaging Sales (K Units), Revenue (US$, Mn) and Average Price (US$/Unit) & (2020-2025)
Table 73. GS Nanotech Key News & Latest Developments
Table 74. Amkor Company Summary
Table 75. Amkor Land Grid Array (LGA) Packaging Product Offerings
Table 76. Amkor Land Grid Array (LGA) Packaging Sales (K Units), Revenue (US$, Mn) and Average Price (US$/Unit) & (2020-2025)
Table 77. Amkor Key News & Latest Developments
Table 78. Land Grid Array (LGA) Packaging Capacity of Key Manufacturers in Global Market, 2023-2025 (K Units)
Table 79. Global Land Grid Array (LGA) Packaging Capacity Market Share of Key Manufacturers, 2023-2025
Table 80. Global Land Grid Array (LGA) Packaging Production by Region, 2020-2025 (K Units)
Table 81. Global Land Grid Array (LGA) Packaging Production by Region, 2026-2032 (K Units)
Table 82. Land Grid Array (LGA) Packaging Market Opportunities & Trends in Global Market
Table 83. Land Grid Array (LGA) Packaging Market Drivers in Global Market
Table 84. Land Grid Array (LGA) Packaging Market Restraints in Global Market
Table 85. Land Grid Array (LGA) Packaging Raw Materials
Table 86. Land Grid Array (LGA) Packaging Raw Materials Suppliers in Global Market
Table 87. Typical Land Grid Array (LGA) Packaging Downstream
Table 88. Land Grid Array (LGA) Packaging Downstream Clients in Global Market
Table 89. Land Grid Array (LGA) Packaging Distributors and Sales Agents in Global Market

List of Figures
Figure 1. Land Grid Array (LGA) Packaging Product Picture
Figure 2. Land Grid Array (LGA) Packaging Segment by Type in 2024
Figure 3. Land Grid Array (LGA) Packaging Segment by Application in 2024
Figure 4. Global Land Grid Array (LGA) Packaging Market Overview: 2024
Figure 5. Key Caveats
Figure 6. Global Land Grid Array (LGA) Packaging Market Size: 2024 VS 2032 (US$, Mn)
Figure 7. Global Land Grid Array (LGA) Packaging Revenue: 2020-2032 (US$, Mn)
Figure 8. Land Grid Array (LGA) Packaging Sales in Global Market: 2020-2032 (K Units)
Figure 9. The Top 3 and 5 Players Market Share by Land Grid Array (LGA) Packaging Revenue in 2024
Figure 10. Segment by Type – Global Land Grid Array (LGA) Packaging Revenue, (US$, Mn), 2024 & 2032
Figure 11. Segment by Type – Global Land Grid Array (LGA) Packaging Revenue Market Share, 2020-2032
Figure 12. Segment by Type – Global Land Grid Array (LGA) Packaging Sales Market Share, 2020-2032
Figure 13. Segment by Type – Global Land Grid Array (LGA) Packaging Price (US$/Unit), 2020-2032
Figure 14. Segment by Application – Global Land Grid Array (LGA) Packaging Revenue, (US$, Mn), 2024 & 2032
Figure 15. Segment by Application – Global Land Grid Array (LGA) Packaging Revenue Market Share, 2020-2032
Figure 16. Segment by Application – Global Land Grid Array (LGA) Packaging Sales Market Share, 2020-2032
Figure 17. Segment by Application -Global Land Grid Array (LGA) Packaging Price (US$/Unit), 2020-2032
Figure 18. By Region – Global Land Grid Array (LGA) Packaging Revenue, (US$, Mn), 2025 & 2032
Figure 19. By Region – Global Land Grid Array (LGA) Packaging Revenue Market Share, 2020 VS 2024 VS 2032
Figure 20. By Region – Global Land Grid Array (LGA) Packaging Revenue Market Share, 2020-2032
Figure 21. By Region – Global Land Grid Array (LGA) Packaging Sales Market Share, 2020-2032
Figure 22. By Country – North America Land Grid Array (LGA) Packaging Revenue Market Share, 2020-2032
Figure 23. By Country – North America Land Grid Array (LGA) Packaging Sales Market Share, 2020-2032
Figure 24. United States Land Grid Array (LGA) Packaging Revenue, (US$, Mn), 2020-2032
Figure 25. Canada Land Grid Array (LGA) Packaging Revenue, (US$, Mn), 2020-2032
Figure 26. Mexico Land Grid Array (LGA) Packaging Revenue, (US$, Mn), 2020-2032
Figure 27. By Country – Europe Land Grid Array (LGA) Packaging Revenue Market Share, 2020-2032
Figure 28. By Country – Europe Land Grid Array (LGA) Packaging Sales Market Share, 2020-2032
Figure 29. Germany Land Grid Array (LGA) Packaging Revenue, (US$, Mn), 2020-2032
Figure 30. France Land Grid Array (LGA) Packaging Revenue, (US$, Mn), 2020-2032
Figure 31. U.K. Land Grid Array (LGA) Packaging Revenue, (US$, Mn), 2020-2032
Figure 32. Italy Land Grid Array (LGA) Packaging Revenue, (US$, Mn), 2020-2032
Figure 33. Russia Land Grid Array (LGA) Packaging Revenue, (US$, Mn), 2020-2032
Figure 34. Nordic Countries Land Grid Array (LGA) Packaging Revenue, (US$, Mn), 2020-2032
Figure 35. Benelux Land Grid Array (LGA) Packaging Revenue, (US$, Mn), 2020-2032
Figure 36. By Region – Asia Land Grid Array (LGA) Packaging Revenue Market Share, 2020-2032
Figure 37. By Region – Asia Land Grid Array (LGA) Packaging Sales Market Share, 2020-2032
Figure 38. China Land Grid Array (LGA) Packaging Revenue, (US$, Mn), 2020-2032
Figure 39. Japan Land Grid Array (LGA) Packaging Revenue, (US$, Mn), 2020-2032
Figure 40. South Korea Land Grid Array (LGA) Packaging Revenue, (US$, Mn), 2020-2032
Figure 41. Southeast Asia Land Grid Array (LGA) Packaging Revenue, (US$, Mn), 2020-2032
Figure 42. India Land Grid Array (LGA) Packaging Revenue, (US$, Mn), 2020-2032
Figure 43. By Country – South America Land Grid Array (LGA) Packaging Revenue Market Share, 2020-2032
Figure 44. By Country – South America Land Grid Array (LGA) Packaging Sales, Market Share, 2020-2032
Figure 45. Brazil Land Grid Array (LGA) Packaging Revenue, (US$, Mn), 2020-2032
Figure 46. Argentina Land Grid Array (LGA) Packaging Revenue, (US$, Mn), 2020-2032
Figure 47. By Country – Middle East & Africa Land Grid Array (LGA) Packaging Revenue, Market Share, 2020-2032
Figure 48. By Country – Middle East & Africa Land Grid Array (LGA) Packaging Sales, Market Share, 2020-2032
Figure 49. Turkey Land Grid Array (LGA) Packaging Revenue, (US$, Mn), 2020-2032
Figure 50. Israel Land Grid Array (LGA) Packaging Revenue, (US$, Mn), 2020-2032
Figure 51. Saudi Arabia Land Grid Array (LGA) Packaging Revenue, (US$, Mn), 2020-2032
Figure 52. UAE Land Grid Array (LGA) Packaging Revenue, (US$, Mn), 2020-2032
Figure 53. Global Land Grid Array (LGA) Packaging Production Capacity (K Units), 2020-2032
Figure 54. The Percentage of Production Land Grid Array (LGA) Packaging by Region, 2024 VS 2032
Figure 55. Land Grid Array (LGA) Packaging Industry Value Chain
Figure 56. Marketing Channels

