Junction Box Market, Global Business Strategies 2026-2033

Junction Box Market size was valued at USD 4,879 million in 2025 and is projected to grow from USD 5,280 million in 2026 to USD 8,436 million by 2033, exhibiting a CAGR of 8.3% during the forecast period.

PDF Icon Download Sample Report PDF
  • Quick Dispatch

    All Orders

  • Secure Payment

    100% Secure Payment

Price range: $1,500.00 through $4,250.00

Clear

Market Insights

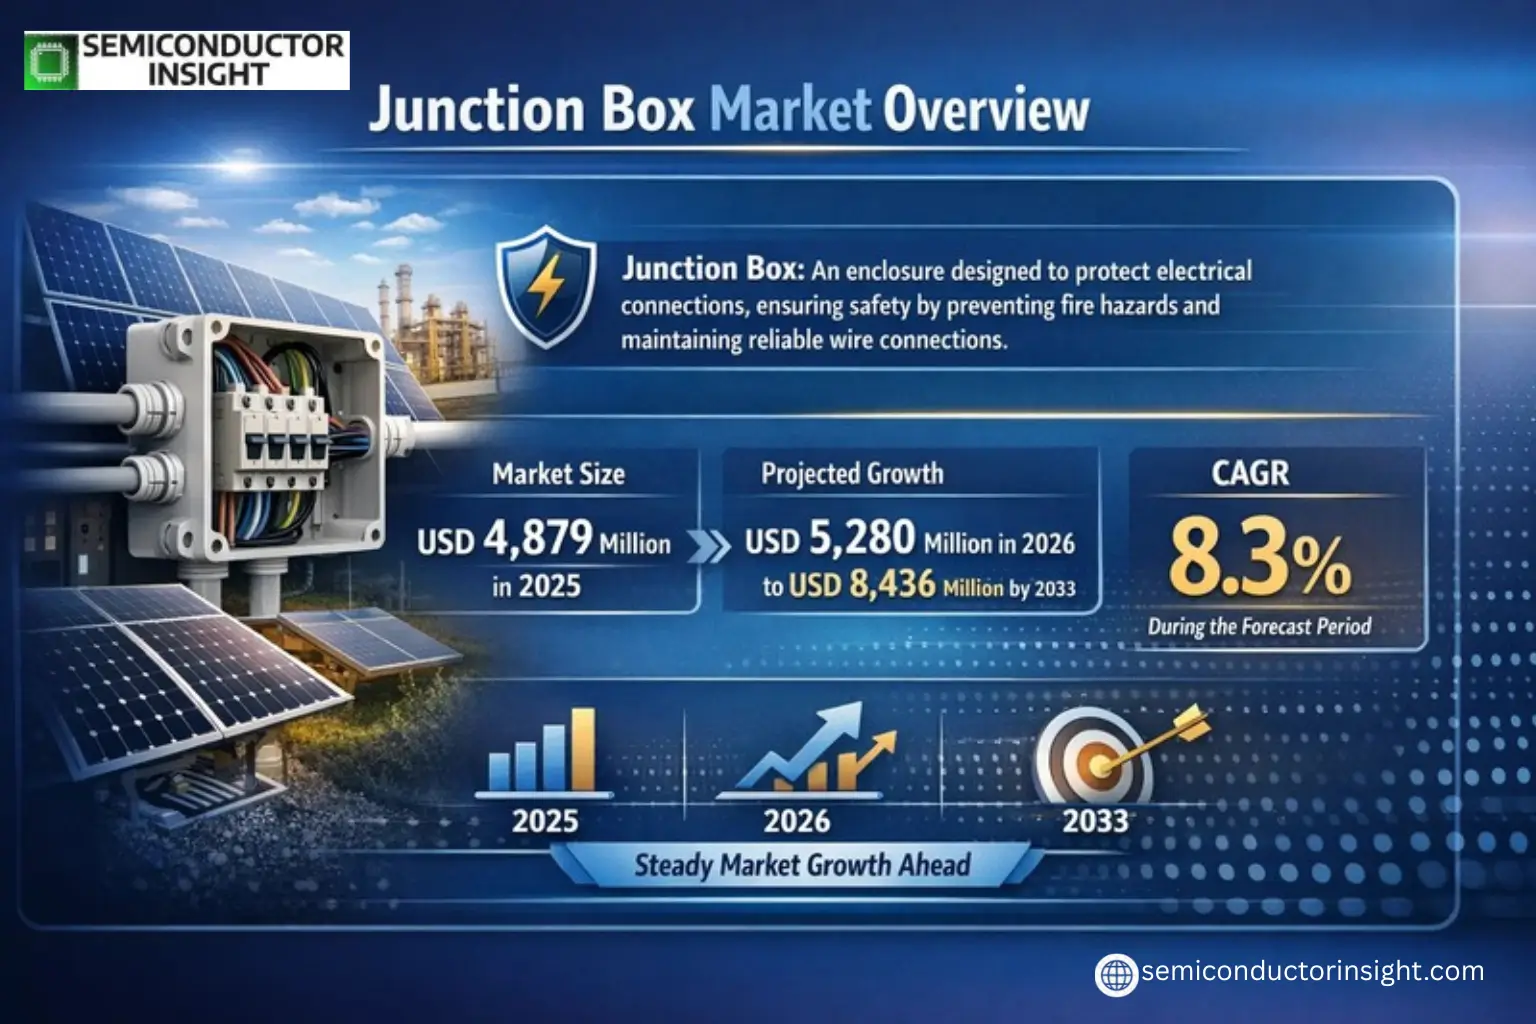
Global Junction Box Market size was valued at USD 4,879 million in 2025 and is projected to grow from USD 5,280 million in 2026 to USD 8,436 million by 2033, exhibiting a CAGR of 8.3% during the forecast period.

Junction Box is an enclosure designed to protect electrical connections, ensuring safety by preventing fire hazards and maintaining reliable wire connections over time. These boxes eliminate the need for running individual wires from every outlet or switch back to the main service panel, streamlining electrical installations across residential, commercial, and industrial applications.

The market growth is driven by increasing urbanization, rising demand for energy-efficient infrastructure, and stringent safety regulations in the construction sector. Non-metallic junction boxes dominate the market with over 78% share due to their corrosion resistance and cost-effectiveness. The industrial segment holds approximately 35% of the market share, while Asia leads regional demand with a 55% contribution. Key players such as Schneider Electric, Eaton, and ABB are expanding their product portfolios to cater to evolving industry requirements.

Xyz market size & forecast

MARKET DRIVERS

Growing Renewable Energy Investments

Global push toward renewable energy is driving demand for junction boxes, particularly in solar panel installations. With over 250 GW of solar capacity added worldwide last year, the need for reliable electrical connection solutions has surged. Junction boxes play a critical role in ensuring safe power transmission from solar arrays to inverters.

Infrastructure Development Projects

Massive infrastructure projects across emerging economies are accelerating junction box adoption. The Asia-Pacific region alone accounts for nearly 45% of global construction activity, creating significant demand for electrical connection components. Governments are prioritizing smart city initiatives that require advanced junction box solutions for power distribution.

Technological advancements in waterproof and explosion-proof junction box designs are further propelling market growth across harsh industrial environments.

MARKET CHALLENGES

Material Cost Volatility

Fluctuating prices of raw materials like polycarbonate and stainless steel are creating margin pressures for junction box manufacturers. Copper prices have shown 22% annual volatility, directly impacting production costs for electrical components.

Other Challenges

Regulatory Compliance Complexity
Differing international standards for electrical safety (IEC, UL, CE) require manufacturers to maintain multiple product certifications, increasing development costs by 15-20% on average.

MARKET RESTRAINTS

High Competition in Mature Markets

Junction Box Market in developed regions faces intense competition, with price wars eroding profitability. Over 300 manufacturers operate in Europe and North America, leading to commoditization pressure for standard products.

MARKET OPPORTUNITIES

Smart Junction Box Solutions

Integration of IoT sensors in junction boxes presents a USD 1.2 billion revenue opportunity by 2027. Smart junction boxes with real-time monitoring capabilities are gaining traction in mission-critical applications like data centers and power plants.

Offshore Wind Energy Expansion

The offshore wind sector’s projected 18% annual growth creates demand for specialized marine-grade junction boxes capable of withstanding saltwater corrosion and high pressures.
Junction Box Market Trends

Steady Growth Projected Across Global Junction Box Market

Global Junction Box Market is experiencing robust growth, valued at USD 4.9 billion in 2025 and projected to reach USD 8.4 billion by 2033, growing at a CAGR of 8.3%. This expansion is driven by increasing infrastructure development, urbanization, and rising demand for efficient electrical connection solutions across industries. Non-metallic junction boxes dominate with over 78% market share due to their durability and cost-effectiveness.

Other Trends

Regional Market Dynamics

Asia currently leads the Junction Box Market with over 55% global share, followed by Europe at 18%. The rapid industrialization and large-scale infrastructure projects in China and India are primary growth drivers. North America shows steady demand from commercial and residential sectors, where electrical safety regulations are stringent.

Application Segment Growth

Industrial applications account for approximately 35% of junction box usage, particularly in manufacturing plants and automation systems. The photovoltaic sector is emerging as a key growth area, supported by global renewable energy investments. Commercial and infrastructure segments follow closely due to ongoing smart city developments.

Competitive Landscape and Material Preferences

Junction Box Market remains fragmented, with top players like Renhe, Schneider Electric, and Eaton collectively holding less than 10% market share. Price competitiveness and product reliability are key differentiators. Aluminum and polycarbonate materials continue gaining traction for their corrosion resistance and lightweight properties in harsh environments.

Current industry challenges include raw material price volatility and the need for innovative designs to accommodate smart grid technologies. However, technological advancements in waterproof and explosion-proof variants present significant opportunities for manufacturers.

COMPETITIVE LANDSCAPE

Key Industry Players

Fragmented Market Structure With Asia-Pacific Dominance

Global Junction Box Market exhibits a low concentration rate with Renhe, Zhonghuan Sunter and Schneider Electric leading the competitive landscape. The top player holds only about 7% market share, reflecting the fragmented nature of this industry. Asia-Pacific dominates global demand, accounting for over 55% of market volume, followed by Europe with 18% share. Non-metallic junction boxes represent the dominant product segment with 78% market share, primarily serving industrial applications which constitute 35% of total demand.

Beyond the market leaders, numerous specialized players operate in niche segments. Companies like Rittal and Weidmuller focus on industrial-grade solutions, while QC Solar and XTONG concentrate on photovoltaic applications. European manufacturers such as Fibox and Spelsberg maintain strong positions in technical junction boxes, whereas American firms like Eaton and Hubbell dominate commercial electrical infrastructure segments. This diversity creates a dynamic competitive environment with regional specialists competing alongside global brands.

List of Key Junction Box Companies Profiled

Segment Analysis:

Segment Category Sub-Segments Key Insights
By Type
  • Non-Metallic Junction Box
  • Metallic Junction Box
Non-Metallic Junction Box dominates the market due to superior corrosion resistance and lightweight properties ideal for outdoor applications. The segment benefits from:

  • Wider adoption in photovoltaic systems where weatherproofing is critical
  • Lower installation costs compared to metallic alternatives
  • Growing preference for polymer materials in modern electrical infrastructure
By Application
  • Photovoltaic Plants
  • Industrial
  • Commercial
  • Infrastructure
  • Residential
Industrial Applications represent the largest segment due to extensive electrical distribution requirements. Key factors driving adoption include:

  • Growing automation in manufacturing facilities requiring robust electrical protection
  • Increased need for explosion-proof junction boxes in hazardous environments
  • Rising infrastructure investments in emerging economies supporting industrial growth
By End User
  • Energy Sector
  • Construction Industry
  • Manufacturing Facilities
Energy Sector shows strongest demand patterns driven by renewable energy expansion:

  • Solar farm installations require specialized junction boxes for panel connections
  • Grid modernization projects in developing nations creating new installation opportunities
  • Stringent safety regulations in power distribution networks boosting product specifications
By Material Technology
  • Polymer-based
  • Metal Alloy
  • Composite Materials
Polymer-based Materials are experiencing accelerated adoption due to:

  • Advancements in engineering plastics offering UV resistance and flame retardancy
  • Cost-effectiveness in mass production for large-scale projects
  • Easier customization options compared to traditional metal enclosures
By Protection Level
  • Standard Protection
  • Weatherproof/Waterproof
  • Explosion-proof
Weatherproof/Waterproof variants are gaining prominence as:

  • Outdoor installations become more prevalent in solar and infrastructure projects
  • IP protection standards become mandatory for commercial electrical installations
  • Manufacturers innovate with better sealing technologies for harsh environments

Regional Analysis: Global Junction Box Market

Asia-Pacific

The Asia-Pacific region dominates the global Junction Box Market, driven by rapid industrialization and infrastructure development across major economies. China’s robust manufacturing sector and massive renewable energy projects fuel strong demand for electrical enclosures and connection solutions. India’s growing construction industry and government initiatives like Smart Cities Mission create substantial opportunities for junction box manufacturers. Japan and South Korea remain innovation hubs, pushing advancements in weatherproof and explosion-proof junction box designs suited for harsh environments. Southeast Asian nations are emerging as attractive markets due to increasing foreign investments in electronics manufacturing and energy infrastructure projects.

Manufacturing Leadership
Asia-Pacific accounts for the largest junction box production capacity globally, with China leading in high-volume manufacturing while Taiwan specializes in precision components for electronics applications.
Solar Energy Expansion
The region’s aggressive solar power capacity additions create strong demand for PV junction boxes, with India and Vietnam emerging as key growth markets for solar-specific enclosure solutions.
Technological Edge
Japanese manufacturers lead in developing smart junction boxes with IoT capabilities, while South Korean firms pioneer compact designs for EV charging infrastructure applications.
Supply Chain Advantages
The region benefits from complete industrial ecosystems supporting junction box manufacturing, including access to raw materials and specialized component suppliers.

North America
The North American Junction Box Market maintains steady growth driven by infrastructure modernization projects and renewable energy deployments. The United States leads in technological innovations for industrial-grade junction boxes, with growing demand from data center and telecommunications sectors. Canada’s focus on grid modernization and mining operations creates specialized requirements for ruggedized junction boxes. Stringent safety regulations in the region push manufacturers to develop UL-certified products with enhanced fire resistance and corrosion protection features.

Europe
Europe remains a strong market for premium junction box solutions, particularly for renewable energy and industrial applications. Germany’s manufacturing excellence drives demand for precision-engineered electrical enclosures, while the UK’s offshore wind farms require specialized marine-grade junction boxes. The EU’s emphasis on energy efficiency and smart buildings fosters innovation in connected junction box systems. Southern European countries show increased demand due to solar PV installations and infrastructure rehabilitation projects.

Middle East & Africa
The Middle East presents growing opportunities for explosion-proof junction boxes in oil & gas facilities, while Africa’s developing grid infrastructure creates demand for basic electrical enclosures. Gulf countries’ investments in smart cities and mega-projects drive specifications for high-performance junction box solutions. South Africa remains the most developed market in the region, with increasing requirements for mining and industrial applications.

South America
Brazil dominates the South American Junction Box Market, supported by its industrial base and energy sector needs. Argentina and Chile show potential in mining-related junction box applications, while Colombia’s infrastructure projects create demand for electrical connection solutions. The region’s renewable energy expansion, particularly in solar and wind, supports market growth for specialized junction box products.

Report Scope

This market research report provides a comprehensive analysis of the Junction Box Market, covering the forecast period 2026–2033. It offers detailed insights into market dynamics, technological advancements, competitive landscape, and key trends shaping the industry.

Key focus areas of the report include:

  • Market Overview: The report begins with an overview outlining its current market scenario, key growth indicators, and industry transformation drivers. It discusses macroeconomic factors, demand–supply balance, regulatory landscape, and the strategic role of semiconductors in powering advancements across industries such as automotive, telecommunications, consumer electronics, and industrial automation.
  • Market Size & Forecast: Historical data and future projections for revenue, unit shipments, and market value across major regions and segments.
  • Segmentation Analysis: Detailed breakdown by product type, technology, application, and end-user industry to identify high-growth segments and investment opportunities.
  • Regional Insights: Insights into market performance across North America, Europe, Asia-Pacific, Latin America, and the Middle East & Africa, including country-level analysis where relevant.
  • Competitive Landscape: Profiles of leading market participants, including their product offerings, R&D focus, manufacturing capacity, pricing strategies, and recent developments such as mergers, acquisitions, and partnerships.
  • Technology Trends & Innovation: Assessment of emerging technologies, integration of AI/IoT, semiconductor design trends, fabrication techniques, and evolving industry standards.
  • Market Drivers & Restraints: Evaluation of factors driving market growth along with challenges, supply chain constraints, regulatory issues, and market-entry barriers.
  • Stakeholder Insights: Insights for component suppliers, OEMs, system integrators, investors, and policymakers regarding the evolving ecosystem and strategic opportunities.

Primary and secondary research methods are employed, including interviews with industry experts, data from verified sources, and real-time market intelligence to ensure the accuracy and reliability of the insights presented.

FREQUENTLY ASKED QUESTIONS:

What is the current market size of Junction Box Market?

-> Junction Box Market size was valued at USD 4,879 million in 2025 and is projected to grow from USD 5,280 million in 2026 to USD 8,436 million by 2033, exhibiting a CAGR of 8.3% during the forecast period.

What is the expected CAGR for Junction Box Market?

-> The market is expected to grow at a CAGR of 8.3% during the forecast period from 2025 to 2033.

Which key companies operate in Junction Box Market?

-> Key players include Renhe, Zhonghuan Sunter, Schneider Electric, Tonglin Electric, Eaton, Emerson, Legrand, nVent, Fibox, QC Solar, Hensel, Rittal, ABB, Weidmuller, Cortem, XTONG, Haitian, Hammond, Hubbell, Spelsberg, Ningbo GZX, among others.

Which region dominates the market?

-> Asia is the largest market, occupying over 55% of the global share, followed by Europe with 18%.

What are the key applications of junction boxes?

-> The key applications include Industrial (35% share), Photovoltaic Plants, Commercial, Infrastructure, Residential, and Others.

Junction Box Market, Global Business Strategies 2026-2033

Get Sample Report PDF for Exclusive Insights

Report Sample Includes

  • Table of Contents
  • List of Tables & Figures
  • Charts, Research Methodology, and more...
PDF Icon Download Sample Report PDF

Download Sample Report

Table of Content

1 Introduction to Research & Analysis Reports
1.1 Junction Box Market Definition
1.2 Market Segments
1.2.1 Segment by Type
1.2.2 Segment by Application
1.3 Global Junction Box Market Overview
1.4 Features & Benefits of This Report
1.5 Methodology & Sources of Information
1.5.1 Research Methodology
1.5.2 Research Process
1.5.3 Base Year
1.5.4 Report Assumptions & Caveats
2 Global Junction Box Overall Market Size
2.1 Global Junction Box Market Size: 2024 VS 2032
2.2 Global Junction Box Market Size, Prospects & Forecasts: 2020-2032
2.3 Global Junction Box Sales: 2020-2032
3 Company Landscape
3.1 Top Junction Box Players in Global Market
3.2 Top Global Junction Box Companies Ranked by Revenue
3.3 Global Junction Box Revenue by Companies
3.4 Global Junction Box Sales by Companies
3.5 Global Junction Box Price by Manufacturer (2020-2025)
3.6 Top 3 and Top 5 Junction Box Companies in Global Market, by Revenue in 2024
3.7 Global Manufacturers Junction Box Product Type
3.8 Tier 1, Tier 2, and Tier 3 Junction Box Players in Global Market
3.8.1 List of Global Tier 1 Junction Box Companies
3.8.2 List of Global Tier 2 and Tier 3 Junction Box Companies
4 Sights by Product
4.1 Overview
4.1.1 Segment by Type – Global Junction Box Market Size Markets, 2024 & 2032
4.1.2 Non-Metallic Junction Box
4.1.3 Metallic Junction Box
4.2 Segment by Type – Global Junction Box Revenue & Forecasts
4.2.1 Segment by Type – Global Junction Box Revenue, 2020-2025
4.2.2 Segment by Type – Global Junction Box Revenue, 2026-2032
4.2.3 Segment by Type – Global Junction Box Revenue Market Share, 2020-2032
4.3 Segment by Type – Global Junction Box Sales & Forecasts
4.3.1 Segment by Type – Global Junction Box Sales, 2020-2025
4.3.2 Segment by Type – Global Junction Box Sales, 2026-2032
4.3.3 Segment by Type – Global Junction Box Sales Market Share, 2020-2032
4.4 Segment by Type – Global Junction Box Price (Manufacturers Selling Prices), 2020-2032
5 Sights by Application
5.1 Overview
5.1.1 Segment by Application – Global Junction Box Market Size, 2024 & 2032
5.1.2 Photovoltaic Plants
5.1.3 Industrial
5.1.4 Commercial
5.1.5 Infrastructure
5.1.6 Residential
5.1.7 Others
5.2 Segment by Application – Global Junction Box Revenue & Forecasts
5.2.1 Segment by Application – Global Junction Box Revenue, 2020-2025
5.2.2 Segment by Application – Global Junction Box Revenue, 2026-2032
5.2.3 Segment by Application – Global Junction Box Revenue Market Share, 2020-2032
5.3 Segment by Application – Global Junction Box Sales & Forecasts
5.3.1 Segment by Application – Global Junction Box Sales, 2020-2025
5.3.2 Segment by Application – Global Junction Box Sales, 2026-2032
5.3.3 Segment by Application – Global Junction Box Sales Market Share, 2020-2032
5.4 Segment by Application – Global Junction Box Price (Manufacturers Selling Prices), 2020-2032
6 Sights by Region
6.1 By Region – Global Junction Box Market Size, 2024 & 2032
6.2 By Region – Global Junction Box Revenue & Forecasts
6.2.1 By Region – Global Junction Box Revenue, 2020-2025
6.2.2 By Region – Global Junction Box Revenue, 2026-2032
6.2.3 By Region – Global Junction Box Revenue Market Share, 2020-2032
6.3 By Region – Global Junction Box Sales & Forecasts
6.3.1 By Region – Global Junction Box Sales, 2020-2025
6.3.2 By Region – Global Junction Box Sales, 2026-2032
6.3.3 By Region – Global Junction Box Sales Market Share, 2020-2032
6.4 North America
6.4.1 By Country – North America Junction Box Revenue, 2020-2032
6.4.2 By Country – North America Junction Box Sales, 2020-2032
6.4.3 United States Junction Box Market Size, 2020-2032
6.4.4 Canada Junction Box Market Size, 2020-2032
6.4.5 Mexico Junction Box Market Size, 2020-2032
6.5 Europe
6.5.1 By Country – Europe Junction Box Revenue, 2020-2032
6.5.2 By Country – Europe Junction Box Sales, 2020-2032
6.5.3 Germany Junction Box Market Size, 2020-2032
6.5.4 France Junction Box Market Size, 2020-2032
6.5.5 U.K. Junction Box Market Size, 2020-2032
6.5.6 Italy Junction Box Market Size, 2020-2032
6.5.7 Russia Junction Box Market Size, 2020-2032
6.5.8 Nordic Countries Junction Box Market Size, 2020-2032
6.5.9 Benelux Junction Box Market Size, 2020-2032
6.6 Asia
6.6.1 By Region – Asia Junction Box Revenue, 2020-2032
6.6.2 By Region – Asia Junction Box Sales, 2020-2032
6.6.3 China Junction Box Market Size, 2020-2032
6.6.4 Japan Junction Box Market Size, 2020-2032
6.6.5 South Korea Junction Box Market Size, 2020-2032
6.6.6 Southeast Asia Junction Box Market Size, 2020-2032
6.6.7 India Junction Box Market Size, 2020-2032
6.7 South America
6.7.1 By Country – South America Junction Box Revenue, 2020-2032
6.7.2 By Country – South America Junction Box Sales, 2020-2032
6.7.3 Brazil Junction Box Market Size, 2020-2032
6.7.4 Argentina Junction Box Market Size, 2020-2032
6.8 Middle East & Africa
6.8.1 By Country – Middle East & Africa Junction Box Revenue, 2020-2032
6.8.2 By Country – Middle East & Africa Junction Box Sales, 2020-2032
6.8.3 Turkey Junction Box Market Size, 2020-2032
6.8.4 Israel Junction Box Market Size, 2020-2032
6.8.5 Saudi Arabia Junction Box Market Size, 2020-2032
6.8.6 UAE Junction Box Market Size, 2020-2032
7 Manufacturers & Brands Profiles
7.1 Renhe
7.1.1 Renhe Company Summary
7.1.2 Renhe Business Overview
7.1.3 Renhe Junction Box Major Product Offerings
7.1.4 Renhe Junction Box Sales and Revenue in Global (2020-2025)
7.1.5 Renhe Key News & Latest Developments
7.2 Zhonghuan Sunter
7.2.1 Zhonghuan Sunter Company Summary
7.2.2 Zhonghuan Sunter Business Overview
7.2.3 Zhonghuan Sunter Junction Box Major Product Offerings
7.2.4 Zhonghuan Sunter Junction Box Sales and Revenue in Global (2020-2025)
7.2.5 Zhonghuan Sunter Key News & Latest Developments
7.3 Schneider Electric
7.3.1 Schneider Electric Company Summary
7.3.2 Schneider Electric Business Overview
7.3.3 Schneider Electric Junction Box Major Product Offerings
7.3.4 Schneider Electric Junction Box Sales and Revenue in Global (2020-2025)
7.3.5 Schneider Electric Key News & Latest Developments
7.4 Tonglin Electric
7.4.1 Tonglin Electric Company Summary
7.4.2 Tonglin Electric Business Overview
7.4.3 Tonglin Electric Junction Box Major Product Offerings
7.4.4 Tonglin Electric Junction Box Sales and Revenue in Global (2020-2025)
7.4.5 Tonglin Electric Key News & Latest Developments
7.5 Eaton
7.5.1 Eaton Company Summary
7.5.2 Eaton Business Overview
7.5.3 Eaton Junction Box Major Product Offerings
7.5.4 Eaton Junction Box Sales and Revenue in Global (2020-2025)
7.5.5 Eaton Key News & Latest Developments
7.6 Emerson
7.6.1 Emerson Company Summary
7.6.2 Emerson Business Overview
7.6.3 Emerson Junction Box Major Product Offerings
7.6.4 Emerson Junction Box Sales and Revenue in Global (2020-2025)
7.6.5 Emerson Key News & Latest Developments
7.7 Legrand
7.7.1 Legrand Company Summary
7.7.2 Legrand Business Overview
7.7.3 Legrand Junction Box Major Product Offerings
7.7.4 Legrand Junction Box Sales and Revenue in Global (2020-2025)
7.7.5 Legrand Key News & Latest Developments
7.8 nVent
7.8.1 nVent Company Summary
7.8.2 nVent Business Overview
7.8.3 nVent Junction Box Major Product Offerings
7.8.4 nVent Junction Box Sales and Revenue in Global (2020-2025)
7.8.5 nVent Key News & Latest Developments
7.9 Fibox
7.9.1 Fibox Company Summary
7.9.2 Fibox Business Overview
7.9.3 Fibox Junction Box Major Product Offerings
7.9.4 Fibox Junction Box Sales and Revenue in Global (2020-2025)
7.9.5 Fibox Key News & Latest Developments
7.10 QC Solar
7.10.1 QC Solar Company Summary
7.10.2 QC Solar Business Overview
7.10.3 QC Solar Junction Box Major Product Offerings
7.10.4 QC Solar Junction Box Sales and Revenue in Global (2020-2025)
7.10.5 QC Solar Key News & Latest Developments
7.11 Hensel
7.11.1 Hensel Company Summary
7.11.2 Hensel Business Overview
7.11.3 Hensel Junction Box Major Product Offerings
7.11.4 Hensel Junction Box Sales and Revenue in Global (2020-2025)
7.11.5 Hensel Key News & Latest Developments
7.12 Rittal
7.12.1 Rittal Company Summary
7.12.2 Rittal Business Overview
7.12.3 Rittal Junction Box Major Product Offerings
7.12.4 Rittal Junction Box Sales and Revenue in Global (2020-2025)
7.12.5 Rittal Key News & Latest Developments
7.13 ABB
7.13.1 ABB Company Summary
7.13.2 ABB Business Overview
7.13.3 ABB Junction Box Major Product Offerings
7.13.4 ABB Junction Box Sales and Revenue in Global (2020-2025)
7.13.5 ABB Key News & Latest Developments
7.14 Weidmuller
7.14.1 Weidmuller Company Summary
7.14.2 Weidmuller Business Overview
7.14.3 Weidmuller Junction Box Major Product Offerings
7.14.4 Weidmuller Junction Box Sales and Revenue in Global (2020-2025)
7.14.5 Weidmuller Key News & Latest Developments
7.15 Cortem
7.15.1 Cortem Company Summary
7.15.2 Cortem Business Overview
7.15.3 Cortem Junction Box Major Product Offerings
7.15.4 Cortem Junction Box Sales and Revenue in Global (2020-2025)
7.15.5 Cortem Key News & Latest Developments
7.16 XTONG
7.16.1 XTONG Company Summary
7.16.2 XTONG Business Overview
7.16.3 XTONG Junction Box Major Product Offerings
7.16.4 XTONG Junction Box Sales and Revenue in Global (2020-2025)
7.16.5 XTONG Key News & Latest Developments
7.17 Haitian
7.17.1 Haitian Company Summary
7.17.2 Haitian Business Overview
7.17.3 Haitian Junction Box Major Product Offerings
7.17.4 Haitian Junction Box Sales and Revenue in Global (2020-2025)
7.17.5 Haitian Key News & Latest Developments
7.18 Hammond
7.18.1 Hammond Company Summary
7.18.2 Hammond Business Overview
7.18.3 Hammond Junction Box Major Product Offerings
7.18.4 Hammond Junction Box Sales and Revenue in Global (2020-2025)
7.18.5 Hammond Key News & Latest Developments
7.19 Hubbell
7.19.1 Hubbell Company Summary
7.19.2 Hubbell Business Overview
7.19.3 Hubbell Junction Box Major Product Offerings
7.19.4 Hubbell Junction Box Sales and Revenue in Global (2020-2025)
7.19.5 Hubbell Key News & Latest Developments
7.20 Spelsberg
7.20.1 Spelsberg Company Summary
7.20.2 Spelsberg Business Overview
7.20.3 Spelsberg Junction Box Major Product Offerings
7.20.4 Spelsberg Junction Box Sales and Revenue in Global (2020-2025)
7.20.5 Spelsberg Key News & Latest Developments
7.21 Ningbo GZX
7.21.1 Ningbo GZX Company Summary
7.21.2 Ningbo GZX Business Overview
7.21.3 Ningbo GZX Junction Box Major Product Offerings
7.21.4 Ningbo GZX Junction Box Sales and Revenue in Global (2020-2025)
7.21.5 Ningbo GZX Key News & Latest Developments
8 Global Junction Box Production Capacity, Analysis
8.1 Global Junction Box Production Capacity, 2020-2032
8.2 Junction Box Production Capacity of Key Manufacturers in Global Market
8.3 Global Junction Box Production by Region
9 Key Market Trends, Opportunity, Drivers and Restraints
9.1 Market Opportunities & Trends
9.2 Market Drivers
9.3 Market Restraints
10 Junction Box Supply Chain Analysis
10.1 Junction Box Industry Value Chain
10.2 Junction Box Upstream Market
10.3 Junction Box Downstream and Clients
10.4 Marketing Channels Analysis
10.4.1 Marketing Channels
10.4.2 Junction Box Distributors and Sales Agents in Global
11 Conclusion
12 Appendix
12.1 Note
12.2 Examples of Clients
12.3 DisclaimerList of Tables
Table 1. Key Players of Junction Box in Global Market
Table 2. Top Junction Box Players in Global Market, Ranking by Revenue (2024)
Table 3. Global Junction Box Revenue by Companies, (US$, Mn), 2020-2025
Table 4. Global Junction Box Revenue Share by Companies, 2020-2025
Table 5. Global Junction Box Sales by Companies, (K Units), 2020-2025
Table 6. Global Junction Box Sales Share by Companies, 2020-2025
Table 7. Key Manufacturers Junction Box Price (2020-2025) & (USD/Unit)
Table 8. Global Manufacturers Junction Box Product Type
Table 9. List of Global Tier 1 Junction Box Companies, Revenue (US$, Mn) in 2024 and Market Share
Table 10. List of Global Tier 2 and Tier 3 Junction Box Companies, Revenue (US$, Mn) in 2024 and Market Share
Table 11. Segment by Type – Global Junction Box Revenue, (US$, Mn), 2024 & 2032
Table 12. Segment by Type – Global Junction Box Revenue (US$, Mn), 2020-2025
Table 13. Segment by Type – Global Junction Box Revenue (US$, Mn), 2026-2032
Table 14. Segment by Type – Global Junction Box Sales (K Units), 2020-2025
Table 15. Segment by Type – Global Junction Box Sales (K Units), 2026-2032
Table 16. Segment by Application – Global Junction Box Revenue, (US$, Mn), 2024 & 2032
Table 17. Segment by Application – Global Junction Box Revenue, (US$, Mn), 2020-2025
Table 18. Segment by Application – Global Junction Box Revenue, (US$, Mn), 2026-2032
Table 19. Segment by Application – Global Junction Box Sales, (K Units), 2020-2025
Table 20. Segment by Application – Global Junction Box Sales, (K Units), 2026-2032
Table 21. By Region – Global Junction Box Revenue, (US$, Mn), 2025-2032
Table 22. By Region – Global Junction Box Revenue, (US$, Mn), 2020-2025
Table 23. By Region – Global Junction Box Revenue, (US$, Mn), 2026-2032
Table 24. By Region – Global Junction Box Sales, (K Units), 2020-2025
Table 25. By Region – Global Junction Box Sales, (K Units), 2026-2032
Table 26. By Country – North America Junction Box Revenue, (US$, Mn), 2020-2025
Table 27. By Country – North America Junction Box Revenue, (US$, Mn), 2026-2032
Table 28. By Country – North America Junction Box Sales, (K Units), 2020-2025
Table 29. By Country – North America Junction Box Sales, (K Units), 2026-2032
Table 30. By Country – Europe Junction Box Revenue, (US$, Mn), 2020-2025
Table 31. By Country – Europe Junction Box Revenue, (US$, Mn), 2026-2032
Table 32. By Country – Europe Junction Box Sales, (K Units), 2020-2025
Table 33. By Country – Europe Junction Box Sales, (K Units), 2026-2032
Table 34. By Region – Asia Junction Box Revenue, (US$, Mn), 2020-2025
Table 35. By Region – Asia Junction Box Revenue, (US$, Mn), 2026-2032
Table 36. By Region – Asia Junction Box Sales, (K Units), 2020-2025
Table 37. By Region – Asia Junction Box Sales, (K Units), 2026-2032
Table 38. By Country – South America Junction Box Revenue, (US$, Mn), 2020-2025
Table 39. By Country – South America Junction Box Revenue, (US$, Mn), 2026-2032
Table 40. By Country – South America Junction Box Sales, (K Units), 2020-2025
Table 41. By Country – South America Junction Box Sales, (K Units), 2026-2032
Table 42. By Country – Middle East & Africa Junction Box Revenue, (US$, Mn), 2020-2025
Table 43. By Country – Middle East & Africa Junction Box Revenue, (US$, Mn), 2026-2032
Table 44. By Country – Middle East & Africa Junction Box Sales, (K Units), 2020-2025
Table 45. By Country – Middle East & Africa Junction Box Sales, (K Units), 2026-2032
Table 46. Renhe Company Summary
Table 47. Renhe Junction Box Product Offerings
Table 48. Renhe Junction Box Sales (K Units), Revenue (US$, Mn) and Average Price (USD/Unit) & (2020-2025)
Table 49. Renhe Key News & Latest Developments
Table 50. Zhonghuan Sunter Company Summary
Table 51. Zhonghuan Sunter Junction Box Product Offerings
Table 52. Zhonghuan Sunter Junction Box Sales (K Units), Revenue (US$, Mn) and Average Price (USD/Unit) & (2020-2025)
Table 53. Zhonghuan Sunter Key News & Latest Developments
Table 54. Schneider Electric Company Summary
Table 55. Schneider Electric Junction Box Product Offerings
Table 56. Schneider Electric Junction Box Sales (K Units), Revenue (US$, Mn) and Average Price (USD/Unit) & (2020-2025)
Table 57. Schneider Electric Key News & Latest Developments
Table 58. Tonglin Electric Company Summary
Table 59. Tonglin Electric Junction Box Product Offerings
Table 60. Tonglin Electric Junction Box Sales (K Units), Revenue (US$, Mn) and Average Price (USD/Unit) & (2020-2025)
Table 61. Tonglin Electric Key News & Latest Developments
Table 62. Eaton Company Summary
Table 63. Eaton Junction Box Product Offerings
Table 64. Eaton Junction Box Sales (K Units), Revenue (US$, Mn) and Average Price (USD/Unit) & (2020-2025)
Table 65. Eaton Key News & Latest Developments
Table 66. Emerson Company Summary
Table 67. Emerson Junction Box Product Offerings
Table 68. Emerson Junction Box Sales (K Units), Revenue (US$, Mn) and Average Price (USD/Unit) & (2020-2025)
Table 69. Emerson Key News & Latest Developments
Table 70. Legrand Company Summary
Table 71. Legrand Junction Box Product Offerings
Table 72. Legrand Junction Box Sales (K Units), Revenue (US$, Mn) and Average Price (USD/Unit) & (2020-2025)
Table 73. Legrand Key News & Latest Developments
Table 74. nVent Company Summary
Table 75. nVent Junction Box Product Offerings
Table 76. nVent Junction Box Sales (K Units), Revenue (US$, Mn) and Average Price (USD/Unit) & (2020-2025)
Table 77. nVent Key News & Latest Developments
Table 78. Fibox Company Summary
Table 79. Fibox Junction Box Product Offerings
Table 80. Fibox Junction Box Sales (K Units), Revenue (US$, Mn) and Average Price (USD/Unit) & (2020-2025)
Table 81. Fibox Key News & Latest Developments
Table 82. QC Solar Company Summary
Table 83. QC Solar Junction Box Product Offerings
Table 84. QC Solar Junction Box Sales (K Units), Revenue (US$, Mn) and Average Price (USD/Unit) & (2020-2025)
Table 85. QC Solar Key News & Latest Developments
Table 86. Hensel Company Summary
Table 87. Hensel Junction Box Product Offerings
Table 88. Hensel Junction Box Sales (K Units), Revenue (US$, Mn) and Average Price (USD/Unit) & (2020-2025)
Table 89. Hensel Key News & Latest Developments
Table 90. Rittal Company Summary
Table 91. Rittal Junction Box Product Offerings
Table 92. Rittal Junction Box Sales (K Units), Revenue (US$, Mn) and Average Price (USD/Unit) & (2020-2025)
Table 93. Rittal Key News & Latest Developments
Table 94. ABB Company Summary
Table 95. ABB Junction Box Product Offerings
Table 96. ABB Junction Box Sales (K Units), Revenue (US$, Mn) and Average Price (USD/Unit) & (2020-2025)
Table 97. ABB Key News & Latest Developments
Table 98. Weidmuller Company Summary
Table 99. Weidmuller Junction Box Product Offerings
Table 100. Weidmuller Junction Box Sales (K Units), Revenue (US$, Mn) and Average Price (USD/Unit) & (2020-2025)
Table 101. Weidmuller Key News & Latest Developments
Table 102. Cortem Company Summary
Table 103. Cortem Junction Box Product Offerings
Table 104. Cortem Junction Box Sales (K Units), Revenue (US$, Mn) and Average Price (USD/Unit) & (2020-2025)
Table 105. Cortem Key News & Latest Developments
Table 106. XTONG Company Summary
Table 107. XTONG Junction Box Product Offerings
Table 108. XTONG Junction Box Sales (K Units), Revenue (US$, Mn) and Average Price (USD/Unit) & (2020-2025)
Table 109. XTONG Key News & Latest Developments
Table 110. Haitian Company Summary
Table 111. Haitian Junction Box Product Offerings
Table 112. Haitian Junction Box Sales (K Units), Revenue (US$, Mn) and Average Price (USD/Unit) & (2020-2025)
Table 113. Haitian Key News & Latest Developments
Table 114. Hammond Company Summary
Table 115. Hammond Junction Box Product Offerings
Table 116. Hammond Junction Box Sales (K Units), Revenue (US$, Mn) and Average Price (USD/Unit) & (2020-2025)
Table 117. Hammond Key News & Latest Developments
Table 118. Hubbell Company Summary
Table 119. Hubbell Junction Box Product Offerings
Table 120. Hubbell Junction Box Sales (K Units), Revenue (US$, Mn) and Average Price (USD/Unit) & (2020-2025)
Table 121. Hubbell Key News & Latest Developments
Table 122. Spelsberg Company Summary
Table 123. Spelsberg Junction Box Product Offerings
Table 124. Spelsberg Junction Box Sales (K Units), Revenue (US$, Mn) and Average Price (USD/Unit) & (2020-2025)
Table 125. Spelsberg Key News & Latest Developments
Table 126. Ningbo GZX Company Summary
Table 127. Ningbo GZX Junction Box Product Offerings
Table 128. Ningbo GZX Junction Box Sales (K Units), Revenue (US$, Mn) and Average Price (USD/Unit) & (2020-2025)
Table 129. Ningbo GZX Key News & Latest Developments
Table 130. Junction Box Capacity of Key Manufacturers in Global Market, 2023-2025 (K Units)
Table 131. Global Junction Box Capacity Market Share of Key Manufacturers, 2023-2025
Table 132. Global Junction Box Production by Region, 2020-2025 (K Units)
Table 133. Global Junction Box Production by Region, 2026-2032 (K Units)
Table 134. Junction Box Market Opportunities & Trends in Global Market
Table 135. Junction Box Market Drivers in Global Market
Table 136. Junction Box Market Restraints in Global Market
Table 137. Junction Box Raw Materials
Table 138. Junction Box Raw Materials Suppliers in Global Market
Table 139. Typical Junction Box Downstream
Table 140. Junction Box Downstream Clients in Global Market
Table 141. Junction Box Distributors and Sales Agents in Global Market

List of Figures
Figure 1. Junction Box Product Picture
Figure 2. Junction Box Segment by Type in 2024
Figure 3. Junction Box Segment by Application in 2024
Figure 4. Global Junction Box Market Overview: 2024
Figure 5. Key Caveats
Figure 6. Global Junction Box Market Size: 2024 VS 2032 (US$, Mn)
Figure 7. Global Junction Box Revenue: 2020-2032 (US$, Mn)
Figure 8. Junction Box Sales in Global Market: 2020-2032 (K Units)
Figure 9. The Top 3 and 5 Players Market Share by Junction Box Revenue in 2024
Figure 10. Segment by Type – Global Junction Box Revenue, (US$, Mn), 2024 & 2032
Figure 11. Segment by Type – Global Junction Box Revenue Market Share, 2020-2032
Figure 12. Segment by Type – Global Junction Box Sales Market Share, 2020-2032
Figure 13. Segment by Type – Global Junction Box Price (USD/Unit), 2020-2032
Figure 14. Segment by Application – Global Junction Box Revenue, (US$, Mn), 2024 & 2032
Figure 15. Segment by Application – Global Junction Box Revenue Market Share, 2020-2032
Figure 16. Segment by Application – Global Junction Box Sales Market Share, 2020-2032
Figure 17. Segment by Application -Global Junction Box Price (USD/Unit), 2020-2032
Figure 18. By Region – Global Junction Box Revenue, (US$, Mn), 2025 & 2032
Figure 19. By Region – Global Junction Box Revenue Market Share, 2020 VS 2024 VS 2032
Figure 20. By Region – Global Junction Box Revenue Market Share, 2020-2032
Figure 21. By Region – Global Junction Box Sales Market Share, 2020-2032
Figure 22. By Country – North America Junction Box Revenue Market Share, 2020-2032
Figure 23. By Country – North America Junction Box Sales Market Share, 2020-2032
Figure 24. United States Junction Box Revenue, (US$, Mn), 2020-2032
Figure 25. Canada Junction Box Revenue, (US$, Mn), 2020-2032
Figure 26. Mexico Junction Box Revenue, (US$, Mn), 2020-2032
Figure 27. By Country – Europe Junction Box Revenue Market Share, 2020-2032
Figure 28. By Country – Europe Junction Box Sales Market Share, 2020-2032
Figure 29. Germany Junction Box Revenue, (US$, Mn), 2020-2032
Figure 30. France Junction Box Revenue, (US$, Mn), 2020-2032
Figure 31. U.K. Junction Box Revenue, (US$, Mn), 2020-2032
Figure 32. Italy Junction Box Revenue, (US$, Mn), 2020-2032
Figure 33. Russia Junction Box Revenue, (US$, Mn), 2020-2032
Figure 34. Nordic Countries Junction Box Revenue, (US$, Mn), 2020-2032
Figure 35. Benelux Junction Box Revenue, (US$, Mn), 2020-2032
Figure 36. By Region – Asia Junction Box Revenue Market Share, 2020-2032
Figure 37. By Region – Asia Junction Box Sales Market Share, 2020-2032
Figure 38. China Junction Box Revenue, (US$, Mn), 2020-2032
Figure 39. Japan Junction Box Revenue, (US$, Mn), 2020-2032
Figure 40. South Korea Junction Box Revenue, (US$, Mn), 2020-2032
Figure 41. Southeast Asia Junction Box Revenue, (US$, Mn), 2020-2032
Figure 42. India Junction Box Revenue, (US$, Mn), 2020-2032
Figure 43. By Country – South America Junction Box Revenue Market Share, 2020-2032
Figure 44. By Country – South America Junction Box Sales, Market Share, 2020-2032
Figure 45. Brazil Junction Box Revenue, (US$, Mn), 2020-2032
Figure 46. Argentina Junction Box Revenue, (US$, Mn), 2020-2032
Figure 47. By Country – Middle East & Africa Junction Box Revenue, Market Share, 2020-2032
Figure 48. By Country – Middle East & Africa Junction Box Sales, Market Share, 2020-2032
Figure 49. Turkey Junction Box Revenue, (US$, Mn), 2020-2032
Figure 50. Israel Junction Box Revenue, (US$, Mn), 2020-2032
Figure 51. Saudi Arabia Junction Box Revenue, (US$, Mn), 2020-2032
Figure 52. UAE Junction Box Revenue, (US$, Mn), 2020-2032
Figure 53. Global Junction Box Production Capacity (K Units), 2020-2032
Figure 54. The Percentage of Production Junction Box by Region, 2024 VS 2032
Figure 55. Junction Box Industry Value Chain
Figure 56. Marketing Channels