MARKET INSIGHTS
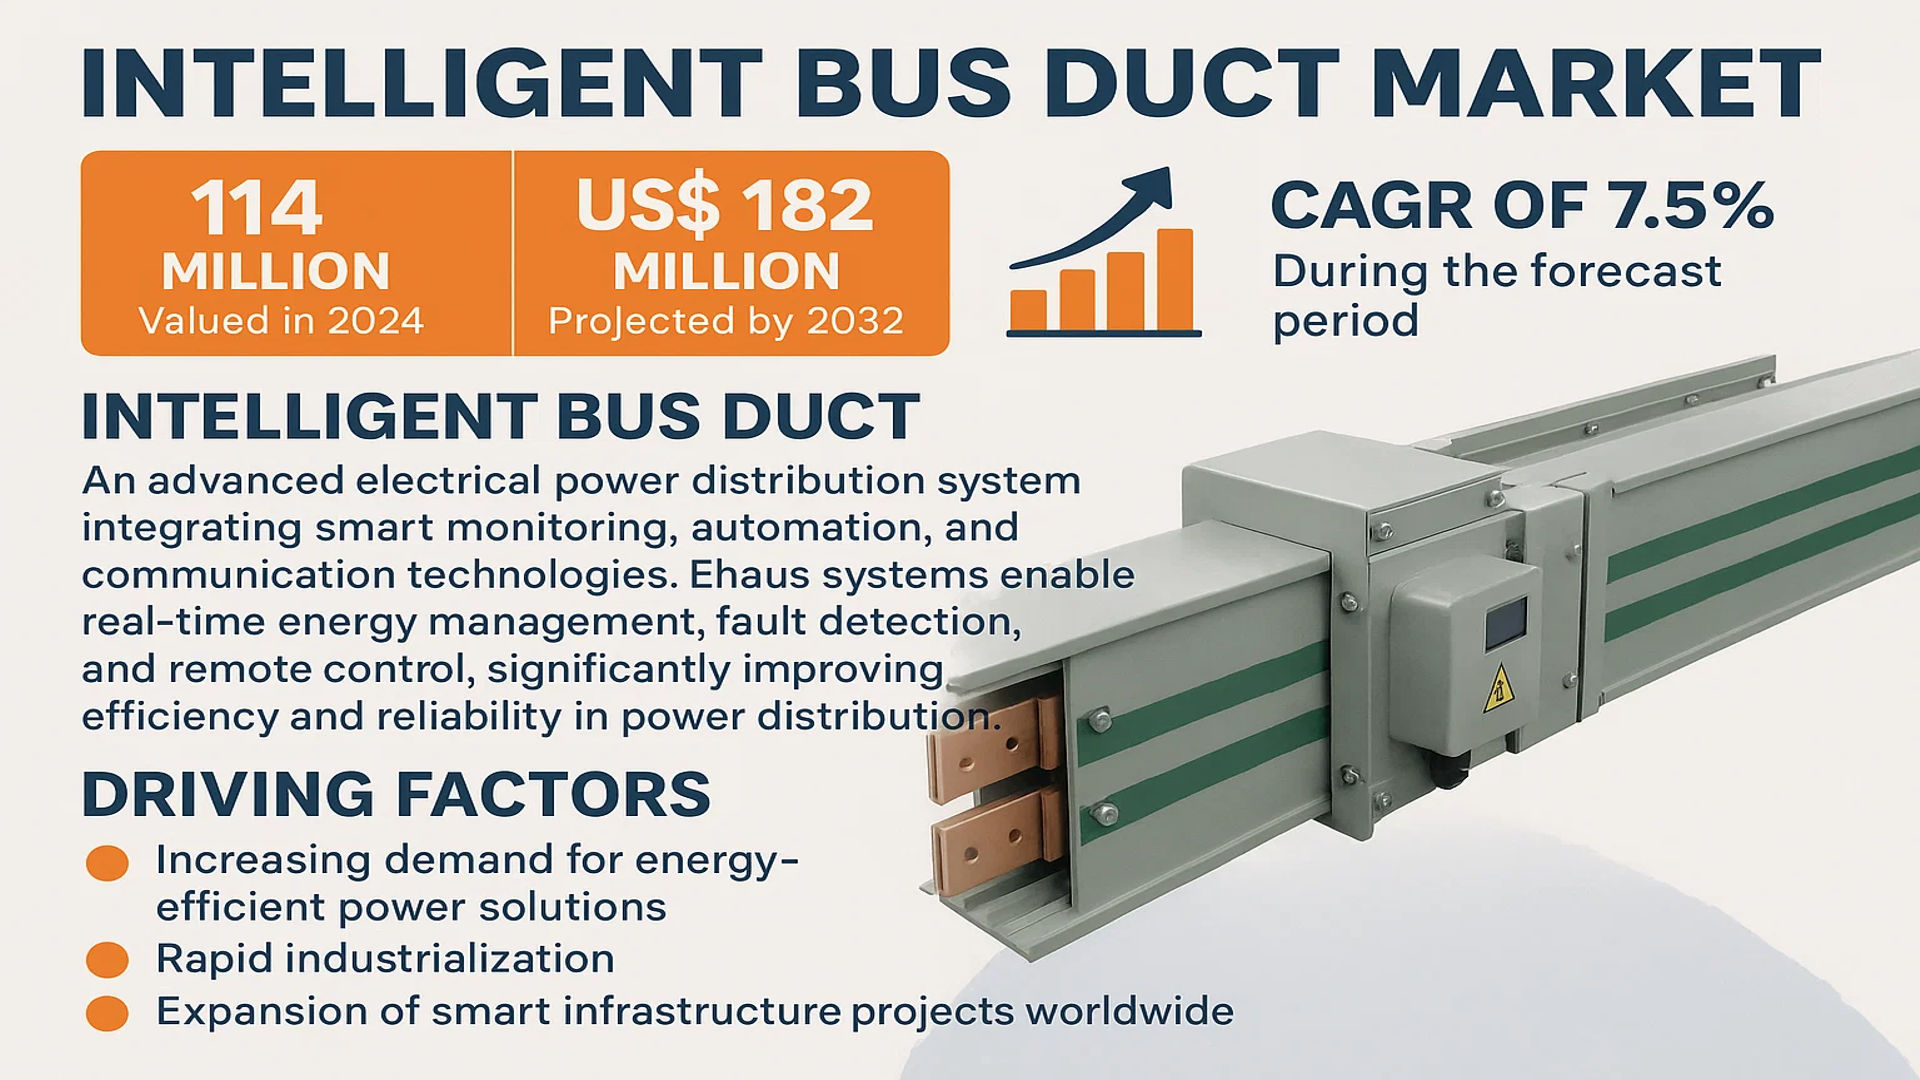
The global Intelligent Bus Duct Market was valued at 114 million in 2024 and is projected to reach US$ 182 million by 2032, at a CAGR of 7.5% during the forecast period.
Intelligent Bus Duct is an advanced electrical power distribution system that integrates smart monitoring, automation, and communication technologies. These systems enable real-time energy management, fault detection, and remote control, significantly improving efficiency and reliability in power distribution. They are widely adopted across industrial buildings, commercial complexes, and power grids due to their superior safety features and operational flexibility.
The market growth is driven by increasing demand for energy-efficient power solutions, rapid industrialization, and the expansion of smart infrastructure projects worldwide. While North America and Europe lead in adoption due to stringent energy regulations, Asia-Pacific shows the fastest growth owing to large-scale urbanization and industrial development. Key players like Zhenda Group, Huawei, and Vertiv dominate the market through continuous innovation in insulation technologies such as air, dense, and composite variants.
MARKET DYNAMICS
MARKET DRIVERS
Growing Industrial Automation and Smart Grid Investments Driving Adoption
The increasing adoption of industrial automation technologies across manufacturing, oil & gas, and data centers is accelerating demand for intelligent bus ducts. These advanced power distribution systems seamlessly integrate with automation infrastructure to provide real-time energy monitoring and predictive maintenance capabilities. The global industrial automation market is projected to expand at over 11% annually, creating significant tailwinds for complementary technologies like intelligent bus ducts. These systems play a critical role in modern smart factories by enabling energy optimization, reducing downtime, and improving operational visibility.
Rising Demand for Energy-Efficient Infrastructure in Commercial Real Estate
Commercial building operators are increasingly prioritizing energy management solutions to comply with stricter efficiency regulations and achieve sustainability goals. Intelligent bus ducts enable centralized power monitoring and dynamic load balancing across entire facilities, delivering energy savings of up to 20% compared to conventional wiring systems. The rapid growth of green building certifications, with over 100,000 LEED-certified projects globally as of 2024, demonstrates the market shift toward energy-efficient technologies. Building automation systems that incorporate intelligent power distribution help reduce operational costs while meeting environmental standards, making them attractive for modern commercial developments.
Government Initiatives for Smart City Development Creating Growth Opportunities
Public sector investments in smart city infrastructure are creating new opportunities for intelligent bus duct systems. Governments worldwide have allocated substantial budgets for modernizing urban power grids and critical infrastructure. These projects often mandate the integration of smart energy management technologies that can monitor consumption patterns and predict maintenance needs. As a result, intelligent bus ducts are becoming essential components in smart city power distribution networks, particularly in emerging economies where urban infrastructure development is accelerating.
MARKET RESTRAINTS
High Initial Costs and Long ROI Periods Limiting Adoption
While intelligent bus ducts deliver long-term operational benefits, their premium pricing remains a barrier for cost-sensitive markets. The initial investment for these systems can be up to 40-50% higher than traditional bus bars, with payback periods often exceeding three years. This financial hurdle is particularly challenging for small and medium-sized enterprises operating in price-competitive industries. Additionally, the specialized installation requirements and system integration costs further add to the total ownership expense, discouraging some potential adopters despite the clear efficiency advantages.
Other Restraints
Technical Integration Challenges
Complex integration with legacy electrical infrastructure presents operational hurdles during deployment. Many existing facilities require significant modifications to accommodate intelligent monitoring systems, including sensor retrofits and communications network upgrades. These technical challenges can disrupt operations and create additional implementation costs that weren’t initially anticipated.
Cybersecurity Vulnerabilities
The increased connectivity of intelligent bus ducts introduces new cybersecurity risks that many organizations are unprepared to manage. Potential vulnerabilities in network-connected power distribution systems could expose facilities to operational disruptions or data breaches, requiring substantial investment in security measures.
MARKET CHALLENGES
Lack of Standardization Creating Interoperability Issues
The absence of universal communication protocols for intelligent power distribution systems creates significant integration challenges. While open standards like Modbus and BACnet are widely adopted, many manufacturers implement proprietary interfaces that limit system compatibility. This lack of standardization forces facility operators to commit to single-vendor solutions or invest in costly middleware to connect different components. The resulting interoperability issues reduce flexibility and may prevent organizations from realizing the full potential of their intelligent power infrastructure.
Additional Challenges
Energy Monitoring Accuracy Concerns
Fluctuations in power quality and measurement drift can compromise the reliability of monitoring data from intelligent bus ducts. These accuracy issues create mistrust in the systems and may lead to missed optimization opportunities or incorrect maintenance decisions.
Shortage of Skilled Installation and Maintenance Personnel
The specialized knowledge required to design, install and maintain intelligent bus duct systems is in short supply compared to market demand. Labor constraints are particularly acute in emerging markets where technical training programs haven’t kept pace with technology adoption.
MARKET OPPORTUNITIES
Integration with AI and Predictive Analytics Creating Next-Generation Solutions
The convergence of intelligent bus duct technology with artificial intelligence presents transformative opportunities for the power distribution sector. Advanced analytics platforms can process real-time monitoring data to optimize energy usage patterns, predict equipment failures, and automate maintenance scheduling. Several leading manufacturers are already piloting AI-powered solutions that reduce energy waste by up to 30% in commercial facilities. As machine learning algorithms become more sophisticated, their integration with intelligent power infrastructure will create new value propositions for end-users across industries.
Retrofit Solutions for Existing Infrastructure Opening New Markets
The development of modular retrofit kits that add intelligence to conventional bus ducts creates significant expansion opportunities. These solutions allow facility operators to upgrade their power distribution systems without complete replacement, reducing both cost and downtime. The retrofit market is particularly attractive for older industrial plants and commercial buildings where comprehensive electrical system replacements may be impractical or prohibitively expensive.
Expansion in Emerging Economies Offering Growth Potential
Rapid industrialization and infrastructure development in Asia-Pacific and Middle Eastern markets present untapped opportunities for intelligent bus duct adoption. Countries with ambitious smart city initiatives and growing manufacturing sectors represent promising growth frontiers. Localized product offerings tailored to regional infrastructure requirements and price points could capture significant market share as these economies modernize their electrical distribution systems.
INTELLIGENT BUS DUCT MARKET TRENDS
Integration of Smart Technologies to Emerge as a Dominant Trend in the Market
The intelligent bus duct market is witnessing rapid transformation due to the increasing adoption of smart grid solutions and IoT-enabled monitoring systems. These advanced technologies enable real-time power distribution analytics, remote fault detection, and predictive maintenance, significantly enhancing operational efficiency. The global intelligent bus duct market was valued at $114 million in 2024, with projections indicating it will reach $182 million by 2032 at a CAGR of 7.5%. This growth is driven by rising demand from industrial and commercial sectors for reliable, energy-efficient power distribution solutions that minimize downtime.
Other Trends
Expansion of Smart Buildings and Infrastructure
The proliferation of smart buildings and data centers is significantly boosting the demand for intelligent bus ducts, as they require robust and scalable power distribution systems. These ducts support high-capacity energy transmission while integrating monitoring capabilities, making them ideal for modern infrastructure. In commercial buildings, intelligent bus ducts help optimize electricity usage through real-time load balancing, which is crucial for reducing energy costs and improving sustainability. Furthermore, increasing investments in digital infrastructure across emerging economies are expected to accelerate market expansion.
Government Initiatives Driving Sustainable Energy Adoption
Governments worldwide are implementing policies to promote energy-efficient infrastructure, further propelling the adoption of intelligent bus ducts. North America and Europe lead in deploying smart grid solutions, while Asia-Pacific is emerging as a key growth region due to rapid industrialization and urbanization. For instance, the U.S. market alone is projected to see significant growth, while China continues to expand its manufacturing and technology sectors, driving demand for reliable power distribution. Additionally, innovations such as composite insulation bus ducts are gaining traction for their superior thermal and electrical performance, further supporting market penetration.
COMPETITIVE LANDSCAPE
Key Industry Players
Strategic Innovation and Expansion Drive Market Leadership in Intelligent Bus Duct Segment
The global intelligent bus duct market exhibits a moderately competitive landscape, characterized by the presence of established manufacturers and emerging regional players. Zhenda Group and Jiangsu Junzi Busbar currently dominate the market, collectively holding a significant revenue share in 2024. Their leadership stems from extensive R&D investments in smart grid technologies and strong distribution networks across Asia-Pacific and European markets.
Chinese manufacturers like Huawei and ZTE are rapidly gaining traction by integrating IoT capabilities into their bus duct systems, particularly for commercial building applications. These companies benefit from government initiatives promoting smart infrastructure development in China, which accounted for nearly 30% of global demand in 2024. Meanwhile, Vertiv maintains a strong position in North America through its comprehensive solutions for data centers and industrial facilities.
Recent industry developments show increasing collaboration between component suppliers and system integrators. AOKEYER ELECTRIC recently partnered with European engineering firms to develop AI-powered predictive maintenance features, while Clever expanded its production capacity in Southeast Asia to meet growing regional demand. Such moves indicate the market’s shift toward value-added services alongside hardware offerings.
Smaller players are carving niches through specialized solutions – some focus on high-voltage applications for renewable energy projects, while others develop compact designs for urban infrastructure. This diversification creates opportunities for mergers as larger firms seek to broaden their technological capabilities ahead of projected 7.5% CAGR growth through 2032.
List of Key Intelligent Bus Duct Manufacturers Profiled
- Zhenda Group (China)
- Jiangsu Junzi Busbar (China)
- Huawei Technologies Co., Ltd. (China)
- AOKEYER ELECTRIC (China)
- Vertiv Holdings Co. (U.S.)
- ZTE Corporation (China)
- Clever Group (Germany)
Segment Analysis:
By Type
Air Insulation Segment Dominates Due to Its Cost-Effectiveness and High Adoption in Industrial Applications
The market is segmented based on type into:
- Air Insulation
- Subtypes: Segmented, Non-segmented, and others
- Dense Insulation
- Subtypes: Epoxy-based, Silicone-based, and others
- Composite Insulation
- Subtypes: Hybrid, Reinforced, and others
By Application
Industrial Buildings Segment Leads Owing to High Power Distribution Needs in Manufacturing Facilities
The market is segmented based on application into:
- Industrial Building
- Subtypes: Manufacturing plants, Power stations, and others
- Commercial Building
- Subtypes: Office spaces, Shopping malls, and others
- Civil Building
- Subtypes: Residential complexes, Public infrastructure, and others
By Voltage Rating
Medium Voltage Segment Holds Significant Share for Industrial Power Distribution Needs
The market is segmented based on voltage rating into:
- Low Voltage
- Medium Voltage
- High Voltage
By End User
Energy & Power Sector Leads Due to Large-Scale Adoption in Power Transmission Networks
The market is segmented based on end user into:
- Energy & Power
- Manufacturing
- IT & Telecom
- Healthcare
- Others
Regional Analysis: Intelligent Bus Duct Market
Asia-Pacific
The Asia-Pacific region dominates the global Intelligent Bus Duct market, accounting for approximately 42% of total revenue in 2024, with China leading regional adoption. Rapid industrialization, urbanization, and smart city initiatives across China, India, and Southeast Asia are driving massive demand for intelligent power distribution solutions. China’s National New Infrastructure Plan has allocated significant funding for energy-efficient building technologies, with Intelligent Bus Ducts playing a crucial role in commercial and industrial applications. While cost sensitivity remains a challenge, manufacturers are increasingly offering localized solutions to meet regional requirements. Key players like Huawei and ZTE are leveraging their technological expertise to integrate IoT capabilities into bus duct systems, creating smart energy networks across the region.
North America
North America represents the second-largest market for Intelligent Bus Ducts, fueled by strict energy efficiency standards and the growing adoption of smart building technologies. The U.S. leads regional demand, particularly in commercial buildings and data centers where intelligent power monitoring is becoming mandatory. The Infrastructure Investment and Jobs Act includes provisions for modernizing power distribution systems in public facilities, creating opportunities for smart bus duct implementations. Companies like Vertiv are pioneering AI-driven bus duct solutions that integrate with building management systems. However, high installation costs and the presence of established conventional power distribution systems slow widespread adoption in smaller facilities.
Europe
Europe’s market growth is driven by stringent EU energy efficiency directives and the push for sustainable construction under the European Green Deal. Germany and France lead in industrial applications, where smart bus ducts enable precise energy monitoring in manufacturing facilities. The region shows particular interest in composite insulation technologies that combine fire safety with intelligent monitoring capabilities. While adoption grows steadily, market expansion faces challenges from lengthy certification processes for new electrical products and competition from traditional busbar systems. European manufacturers focus on developing solutions that comply with both performance standards and environmental regulations.
Middle East & Africa
The MEA region presents emerging opportunities, particularly in Gulf Cooperation Council countries undertaking smart city projects like Saudi Arabia’s NEOM and UAE’s smart grid initiatives. Demand focuses on durable solutions capable of withstanding harsh environmental conditions while providing real-time energy data. The market remains constrained by limited local manufacturing capabilities and reliance on imports, though international players are establishing regional partnerships. Infrastructure development in Africa is gradually adopting intelligent power distribution, with South Africa leading the transition. Growth potential remains strong but uneven across the region due to varying economic conditions and electrification rates.
South America
South America’s Intelligent Bus Duct market is in early stages, with Brazil and Argentina showing the most activity. Industrial facilities and large commercial projects drive limited demand, though economic instability restricts investments in advanced power distribution systems. The region lacks comprehensive standards for smart electrical infrastructure, slowing adoption. However, increasing foreign investments in manufacturing and renewable energy projects are creating niche opportunities. Local manufacturers focus on cost-effective solutions, while international providers target premium segments in mining and data center applications.
Report Scope
This market research report provides a comprehensive analysis of the Global Intelligent Bus Duct Market, covering the forecast period 2024–2032. It offers detailed insights into market dynamics, technological advancements, competitive landscape, and key trends shaping the industry.
Key focus areas of the report include:
- Market Size & Forecast: Historical data and future projections for revenue, unit shipments, and market value across major regions and segments. The global Intelligent Bus Duct market was valued at USD 114 million in 2024 and is projected to reach USD 182 million by 2032, growing at a CAGR of 7.5%.
- Segmentation Analysis: Detailed breakdown by product type (Air Insulation, Dense Insulation, Composite Insulation), application (Industrial, Commercial, Civil Buildings), and end-user industry to identify high-growth segments.
- Regional Outlook: Insights into market performance across North America (U.S., Canada, Mexico), Europe (Germany, France, U.K.), Asia-Pacific (China, Japan, India), and other key regions.
- Competitive Landscape: Profiles of leading market participants including Zhenda Group, Jiangsu Junzi Busbar, Huawei, AOKEYER ELECTRIC, Vertiv, ZTE, and Clever, covering their product portfolios and market strategies.
- Technology Trends: Analysis of smart monitoring systems, IoT integration, and advanced power distribution technologies in Intelligent Bus Ducts.
- Market Drivers & Restraints: Evaluation of factors such as growing smart infrastructure investments versus challenges like high installation costs.
- Stakeholder Analysis: Strategic insights for electrical component manufacturers, system integrators, and infrastructure developers.
The research employs primary interviews with industry experts and analysis of verified market data to ensure accuracy and reliability.
FREQUENTLY ASKED QUESTIONS:
What is the current market size of Global Intelligent Bus Duct Market?
-> Intelligent Bus Duct Market was valued at 114 million in 2024 and is projected to reach US$ 182 million by 2032, at a CAGR of 7.5% during the forecast period.
Which key companies operate in Global Intelligent Bus Duct Market?
-> Major players include Zhenda Group, Jiangsu Junzi Busbar, Huawei, AOKEYER ELECTRIC, Vertiv, ZTE, and Clever.
What are the key growth drivers?
-> Growth is driven by rising demand for smart power distribution systems, increasing industrial automation, and government investments in infrastructure modernization.
Which region dominates the market?
-> Asia-Pacific leads in market share due to rapid industrialization, while North America shows significant growth in smart building applications.
What are the emerging trends?
-> Key trends include IoT-enabled monitoring systems, predictive maintenance capabilities, and sustainable energy-efficient solutions in bus duct technologies.

Get Sample Report PDF for Exclusive Insights
Report Sample Includes
- Table of Contents
- List of Tables & Figures
- Charts, Research Methodology, and more...