Harsh Environment Connector Market Size, Trends, Business Strategies 2026-2034

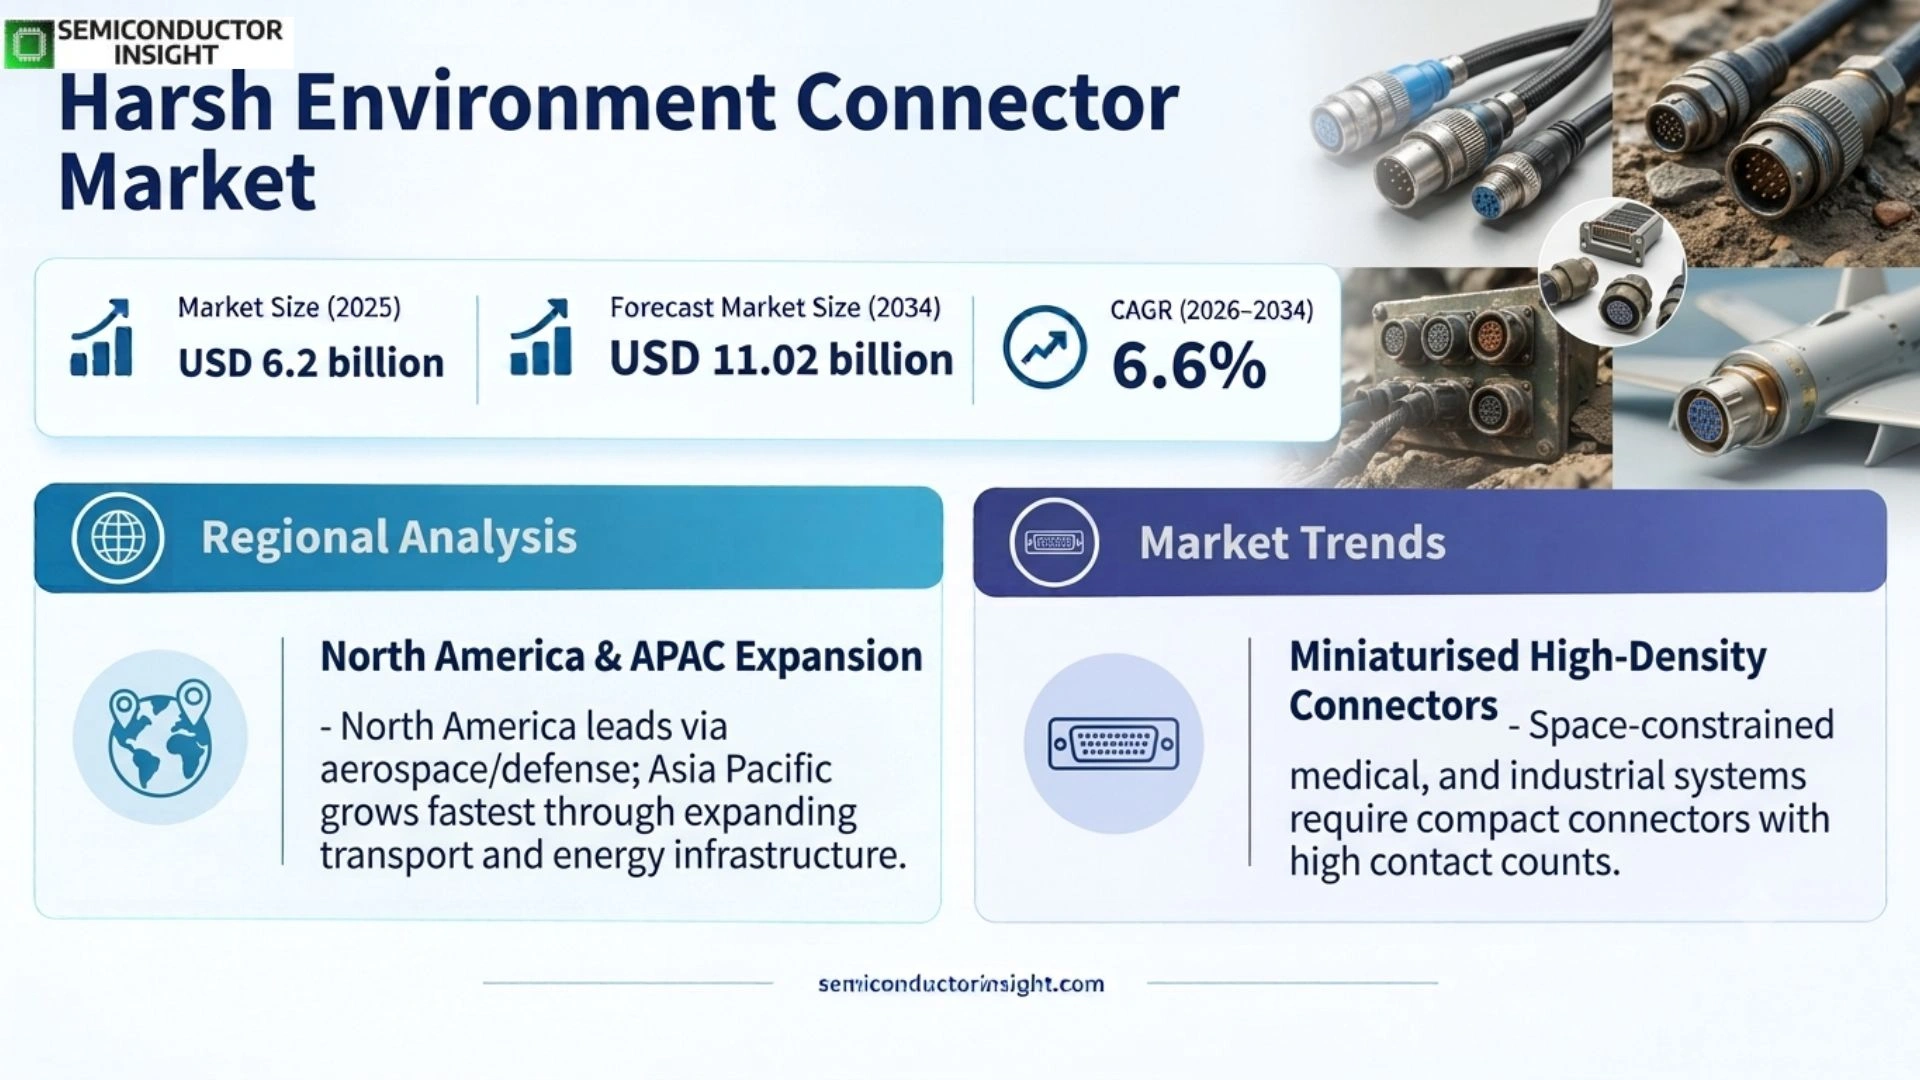
Harsh environment connector market is driven by USD 11.02 billion by 2034, corresponding to a 6.6% CAGR from 2026 to 2034

PDF Icon Download Sample Report PDF
  • Quick Dispatch

    All Orders

  • Secure Payment

    100% Secure Payment

Price range: $1,500.00 through $4,250.00

Clear

Key Statistics

2025 Market Size
USD 6.18 billion
2034 Projected Size
USD 11.02 billion
CAGR (2026–2034)
6.6%
Largest Market in 2025
North America

Key Takeaways

  • Circular connectors are the leading product type because sealed cylindrical architectures are widely deployed in high-vibration, moisture, temperature and field-service environments.
  • Aerospace and military is the leading application because connector failure in avionics, propulsion, defence electronics and mission systems carries a disproportionate cost, making qualification and reliability more valuable than lowest price.
  • North America holds the largest market position, supported by aerospace, defence, industrial and energy demand, while Asia Pacific is the fastest-growing region as industrialisation, telecommunications, energy infrastructure and advanced manufacturing expand.
  • Harsh-environment ruggedisation is moving toward smaller, higher-density and hybrid interconnects, with optical, electrical and high-power functions increasingly combined where equipment designers face severe space and maintenance constraints.
  • Material, sealing and certification complexity remains the main restraint because connectors must survive combinations of temperature, vibration, water, pressure, chemicals and electrical loading while meeting market-specific qualification requirements.

Harsh Environment Connector Market Overview

The global harsh environment connector market is driven by applications where electrical, optical or power interconnections must remain functional under vibration, moisture, pressure, temperature swings, contamination or corrosive exposure. Using the published market anchors, the market reaches USD 6.18 billion in 2025 and USD 11.02 billion by 2034, corresponding to a 6.6% CAGR from 2026 to 2034. North America is the largest market, while Asia Pacific provides the strongest growth runway.

Base year: 2025 · Forecast period: 2026–2034 · Historical data: 2019–2024 · Values in USD; unit shipments where applicable

Harsh environment connectors are engineered interconnect products designed to preserve signal, power or data integrity when standard connectors would face unacceptable degradation. The report scope covers circular, rectangular and fiber optic connector architectures, with applications spanning aerospace and military, industrial, telecommunications, medical and energy environments. The design problem is therefore multidimensional: the connector must meet mechanical, electrical, environmental and certification requirements simultaneously, often with limited access for maintenance.

The commercial trigger is usually a system-level reliability requirement. In an aircraft, the connector must tolerate vibration, temperature and fluids while meeting aerospace qualification. In offshore energy, saltwater and pressure become dominant constraints. In industrial automation, washdown, chemicals and repetitive motion can be the main risks. The supplier response is a combination of sealed interfaces, suitable shell materials, corrosion protection, strain relief and contact technology, which moves product selection away from generic connector catalogues toward application engineering.

The market is changing because equipment is becoming more connected while the physical envelope available for wiring is tightening. Smiths Interconnect’s 2026 work on modular connectors highlights the need to fit more power, signal and data functions into smaller spaces for aerospace, defence, transportation and industrial automation. TE Connectivity likewise maintains connector families qualified to demanding military and aerospace specifications. These developments favour suppliers that can combine density with environmental reliability.

The scope includes connectors intended for harsh environmental conditions and the four segmentation axes identified in the report: type, application, environment and material. It excludes ordinary commercial connectors whose environmental requirements are within standard indoor operating conditions. The distinction matters because harsh-environment products carry qualification, sealing and material requirements that add engineering cost but also create stronger customer retention after a design has been approved.

Segment Analysis: By Type

The market is segmented into circular connectors, rectangular connectors and fiber optic connectors. Circular connectors are the leading product type because their mechanically robust shells and sealing architectures are well suited to vibration, moisture and field-service conditions. Fiber optic connectors are growing in importance where bandwidth, electromagnetic immunity and outdoor deployment requirements converge.

Type Function Market position
Circular Connector Sealed or rugged cylindrical connector architecture for power, signal and mixed connections Largest type. Broadly used in aerospace, military, industrial, energy and outdoor infrastructure. TE’s DEUTSCH families illustrate how circular architectures can be engineered for high vibration, environmental sealing and demanding qualification.
Rectangular Connector Multi-contact rectangular interface for dense power and signal assemblies Strong in equipment with constrained mounting envelopes and where modular contact arrangements are valuable. Competition focuses on density, serviceability and compatibility with established panel and cable designs.
Fiber Optic Connector Optical interconnect for high-speed data transmission in harsh environments Smaller installed base but strategically important in telecommunications, transportation and energy. The segment gains value where copper would be constrained by bandwidth, electromagnetic interference or long-distance transmission requirements.

Connector density and sealing

The primary product trade-off is not simply contact count; it is the ability to combine density with sealing and mechanical integrity. TE’s MIL-DTL-38999 Series III products, for example, can support layouts with up to 187 data connections and power contacts rated up to 23 A while using anti-decoupling and EMI-shielding features for high-vibration environments. As systems add more electronics, suppliers that preserve sealing, maintainability and qualification while increasing density can capture premium programmes.

Segment Analysis: By Application

By application, the report covers aerospace & military, industrial, telecommunications, medical and energy. Aerospace and military is the leading application because reliability failures carry high mission and safety costs. Industrial and energy applications create broader unit volumes, while telecommunications increases demand for rugged fiber connectivity in outdoor and infrastructure environments.

Application Demand characteristics
Aerospace & Military Purchasing is qualification-led, with requirements around vibration, shock, temperature, EMI shielding, weight, sealing and platform-specific specifications. Once qualified, connectors can remain in programmes for many years because redesign carries substantial validation cost.
Industrial Demand is driven by automation, motors, sensors and machine systems exposed to washdown, chemicals, dust or vibration. Buyers balance environmental protection with cost, serviceability and connector density.
Telecommunications Outdoor radio, fiber and network infrastructure require weatherproof and contamination-resistant interconnects. Rugged optical connectivity gains importance where high bandwidth and long-distance links must survive field conditions.
Medical Demand centres on sterilisation resistance, reliability, compact form factors and repeated mating in diagnostic or clinical equipment. Suppliers compete on cleanability, materials and long-term availability.
Energy Oil and gas, wind, solar, grid and marine systems expose connectors to pressure, salt mist, temperature cycling and vibration. Procurement favours sealed designs and materials that reduce maintenance and corrosion risk.

Harsh Environment Connector Market Trends 2026

Regional Analysis

North America leads the harsh environment connector market because of its strong aerospace, defence, industrial and energy base, while Asia Pacific is the fastest-growing region as manufacturing, communications, transport and energy infrastructure expand. Europe remains a major specification-driven market, and emerging regions are more import-dependent and project-driven. This gives suppliers with established qualification histories, domestic engineering support and lifecycle continuity an advantage over lower-cost entrants in mission-critical programmes.

Why do regional purchasing mechanisms differ?

North America is qualification-heavy because defence, aerospace and industrial programmes place high value on certified reliability and established supplier relationships. Europe combines premium industrial applications with stringent standards and strong offshore wind demand. Asia Pacific balances volume and cost with growing demand for higher-grade connectors in aerospace, telecom and industrial automation. South America and the Middle East and Africa remain smaller and more project-oriented, where distributor reach, imported inventory and technical support can determine whether a supplier wins a specification.

Region Position Growth outlook Demand profile What decides supplier selection
North America Largest High Defense, aerospace, industrial, energy Qualification, reliability, domestic support, programme history
Europe Second Moderate Industrial, aerospace, rail, offshore wind Standards, environmental performance, premium engineering
Asia Pacific Fastest-growing Highest Manufacturing, telecom, rail, energy, aerospace Cost-performance, local supply, qualification depth
South America Fourth Emerging Oil & gas, mining, industrial projects Import logistics, landed cost, distributor support
Middle East & Africa Smallest Emerging Oil & gas, desalination, infrastructure Corrosion resistance, project support, local partner
North America LARGEST

What makes North America the largest harsh-environment connector market?

North America combines the strongest mix of aerospace, defence, industrial automation, energy and high-specification equipment programmes. That diversity supports demand for rugged electrical and optical connectors across aircraft, naval systems, energy infrastructure and factory equipment. Qualification culture also favours established suppliers because connector changes can trigger testing, documentation and redesign costs. TE Connectivity’s DEUTSCH and MIL-DTL-38999 families illustrate how large suppliers compete by offering proven architectures across multiple programme requirements.

Market positionLargest region
Growth outlookHigh
Demand profileQualification-led
Market access gateUL/MIL/aerospace programme history
Country Position in region What drives demand
United States Dominant The U.S. drives demand through military modernisation, aerospace production, industrial automation and energy infrastructure. Qualification and domestic support are major purchasing filters.
Canada Established niche Demand is tied to aerospace, energy, transportation and resource industries. Suppliers win where products combine environmental protection with field serviceability.
Mexico Industrial growth Automotive, industrial and electronics manufacturing create demand for ruggedised connectors, with supplier access influenced by OEM localisation and cross-border distribution.

Market instances

  • TE lists DEUTSCH connector products for aerospace, defence, marine, automotive and industrial transportation applications; why it matters: rugged connectivity is embedded across multiple high-value end markets; market impact: broad application coverage reinforces incumbent supplier positions. Source.
  • TE’s MIL-DTL-38999 Series III connector family supports up to 187 data connections and power contacts rated up to 23 A; why it matters: high-density harsh-environment designs reduce the number of separate interfaces; market impact: suppliers can compete on system-level integration rather than unit count alone. Source.
  • Amphenol reported USD 5.88 billion of 2025 sales in its Harsh Environment Solutions segment, up from USD 4.42 billion in 2024; why it matters: the segment demonstrates the scale of ruggedised connectivity across the company’s end markets; market impact: large suppliers have financial capacity to broaden portfolios and regional manufacturing. Source.

North America’s distinctive advantage is specification depth. Suppliers that can document qualification, control changes and support replacement parts inside large programmes can defend positions for long periods. The market therefore rewards engineering and lifecycle support as much as incremental connector innovation, especially in platforms where reliability testing costs far exceed the unit price of the connector.

Europe SECOND-LARGEST

How does Europe compete in harsh environment connectors?

Europe is a premium engineering market where industrial automation, aerospace, rail, medical systems and offshore energy create demanding environmental requirements. Standards and certification can be as decisive as raw connector performance, especially in explosive or marine environments. Huber+Suhner, TE Connectivity and other specialists compete by adapting sealing, material and optical designs to regional system requirements. The result is a market where premium solutions can hold value when they reduce maintenance, certification or failure risk.

Market positionSecond-largest
Growth outlookModerate
Demand profilePremium and compliance-led
Market access gateCE, ATEX, railway and marine requirements
Country Position in region What drives demand
Germany Industrial leader Automation, machinery and automotive systems create a large installed base requiring rugged connectivity. Product selection centres on reliability, serviceability and integration with established machine platforms.
France Aerospace and industrial Aerospace and defence programmes favour qualified, lightweight and high-reliability connectors, while industrial applications add a steady replacement base.
United Kingdom Defense and energy Demand is anchored in aerospace, defence, marine and energy applications where environmental performance and lifecycle support are central.

Market instances

  • TE’s DEUTSCH 983 series is qualified to EN2997 and cited for harsh aircraft applications including engines, landing gear, APUs, wings and pylons; why it matters: aerospace programmes require connector performance under extreme vibration and temperature; market impact: qualification creates high barriers to entry. Source.
  • European offshore wind projects increase requirements for salt-mist and moisture resistance; why it matters: connectors in nacelles, towers and marine interfaces can be exposed to repeated environmental stress; market impact: rugged sealing and corrosion resistance gain procurement weight.
  • Smiths Interconnect continues to position high-reliability connectors for military, aerospace and industrial applications; why it matters: the region retains a deep specialist supplier base; market impact: niche expertise supports premium competition alongside diversified manufacturers. Source.

Europe’s commercial logic is premium specification. Buyers frequently accept a higher connector price when the product reduces compliance risk or eliminates service failures in difficult environments. That favours suppliers with deep standards knowledge, strong documentation and application engineering, while commodity suppliers struggle to overcome qualification and lifecycle requirements. The result is a premium market where certification, documentation and long-term availability can justify higher acquisition cost when they reduce system-level risk.

Asia Pacific FASTEST-GROWING

Why is Asia Pacific the fastest-growing region?

Asia Pacific is expanding from high-volume industrial and telecommunications applications into more demanding aerospace, energy and transport systems. China, Japan, South Korea and India combine manufacturing scale with accelerating infrastructure investment, increasing the addressable market for rugged connectors. The region also contains strong local suppliers that compete on cost and lead time, forcing global brands to localise manufacturing, technical support and product configuration while preserving certification quality.

Market positionFastest-growing
Growth outlookHighest
Demand profileVolume plus premium transition
Market access gateLocal manufacturing and certification
Country Position in region What drives demand
China Largest APAC volume base Industrial automation, rail, telecom and energy create broad demand, with local suppliers competing strongly on cost and availability. Higher-grade applications are expanding as domestic aerospace and advanced manufacturing grow.
Japan Precision industrial base Automotive, robotics, industrial equipment and electronics support demand for compact, reliable connectors. Suppliers compete through precision and process quality.
India High growth Infrastructure, defence, rail and industrial expansion are increasing demand for ruggedised connectors, while localisation policies create incentives for domestic production and sourcing.
South Korea Advanced electronics base Semiconductor, electronics, industrial and automotive systems create demand for compact, reliable interconnects that can operate in constrained equipment environments.

Market instances

  • Smiths Interconnect announced a £2 million investment in a Costa Rica facility in February 2026 to support the growing electronics sector and aerospace and defence demand; why it matters: suppliers are increasing regional capacity where customer growth justifies it; market impact: manufacturing localisation becomes a competitive weapon. Source.
  • Amphenol’s 2025 results showed Harsh Environment Solutions sales of USD 5.88 billion, demonstrating ongoing scale and investment capacity in rugged connectivity; why it matters: global suppliers can fund localised production and portfolio expansion; market impact: regional competitors face stronger pressure to differentiate by niche or price. Source.
  • TE’s harsh-environment portfolio spans aerospace, defence, marine, transportation and industrial applications; why it matters: the same connector platforms can be adapted across several APAC end markets; market impact: portfolio breadth supports cross-selling as local demand becomes more sophisticated. Source.

Asia Pacific differs because volume growth and specification upgrading are happening simultaneously. Suppliers need to defend price competitiveness in industrial markets while qualifying higher-performance products for aerospace, transportation and energy. Local manufacturing, inventory and engineering support can therefore matter almost as much as global brand recognition. The strongest regional suppliers therefore combine local manufacturing economics with the process discipline and certification depth expected in higher-reliability applications.

South America FOURTH

What drives South American harsh-environment connector demand?

South America is primarily an oil and gas, mining and industrial market for rugged connectors. Brazil’s pre-salt energy activity and large mining operations expose equipment to dust, moisture, vibration and corrosive environments, creating demand for durable interconnects. Yet the region remains import-dependent, so distributor reach, safety stock and the ability to support field failures can be more decisive than establishing local connector plants.

Market positionFourth
Growth outlookEmerging
Demand profileOil, gas and mining
Market access gateImport availability and field service
Country Position in region What drives demand
Brazil Largest opportunity Energy, mining and industrial automation create the broadest demand base. Imported connectors remain important, so distributor inventory and technical support are key.
Argentina Project-led Energy and industrial projects provide demand opportunities, but macroeconomic volatility can change purchasing timing and landed costs.
Chile Mining-led Mining equipment requires connectors resistant to dust, vibration and temperature variation, making rugged circular products particularly relevant.

Market instances

  • South American mining systems continue to operate in high-dust and high-vibration environments; why it matters: standard connectors can raise maintenance risk; market impact: ruggedised products can earn a lifecycle premium.
  • Brazilian energy projects require interconnects that tolerate humidity, salt and vibration; why it matters: offshore and industrial equipment depend on reliability in hard-to-service locations; market impact: sealed designs gain share in critical interfaces.
  • Import-dependent procurement makes regional inventory strategically important; why it matters: connector failure can stop a machine or project; market impact: distributors with local safety stock can add commercial value beyond simple resale.

South America’s opportunity is concentrated in specialised industrial applications rather than broad connector consumption. A supplier does not need a full local manufacturing footprint to participate, but it does need dependable regional distribution, engineering response and the ability to supply replacements quickly in remote operating environments. Regional value is consequently concentrated in authorised distribution, field support and rapid replacement rather than in commodity-scale connector production.

Middle East & Africa EMERGING

Where are the main Middle East and Africa opportunities?

The region is led by harsh industrial projects where environmental exposure is severe but maintenance access can be limited. Oil and gas, desalination, marine infrastructure and mining create a natural fit for sealed connectors. Gulf projects can support premium products when corrosion, heat and reliability dominate total cost, while African markets remain more price-sensitive and import-dependent. Project partnerships and local technical representation are therefore more important than broad catalogue coverage.

Market positionSmallest
Growth outlookEmerging
Demand profileProject-led
Market access gateCorrosion, heat and local support
Country Position in region What drives demand
Saudi Arabia Gulf industrial leader Oil, gas, desalination and infrastructure projects require reliable connectors under high temperature, dust and corrosive conditions.
United Arab Emirates Infrastructure hub Marine, energy and smart-infrastructure projects create demand for ruggedised electrical and optical connectivity.
South Africa Mining base Mining and industrial equipment create demand for vibration- and dust-resistant connectors, often with imported supply and distributor-led support.

Market instances

  • Oil and gas installations place connectors in high-temperature, vibration and corrosive environments; why it matters: maintenance failures can be expensive and difficult to access; market impact: sealed and high-temperature designs command greater attention.
  • Desalination and marine infrastructure expose connectors to salt and moisture; why it matters: corrosion can create intermittent electrical failures; market impact: corrosion-resistant materials and sealing become purchase criteria.
  • Mining equipment in Africa operates under dust, vibration and mechanical shock; why it matters: field reliability affects equipment utilisation; market impact: rugged connectors gain value where maintenance downtime is expensive.

The region is commercially distinctive because projects, not a broad installed connector ecosystem, determine demand. Suppliers should prioritise local partners, technical documentation and predictable delivery rather than excessive product breadth. Premium products can succeed where they reduce maintenance and access costs, particularly in offshore and heavy-industrial applications. Suppliers can therefore build positions through project partnerships and local technical representation before committing to the fixed cost of a large dedicated manufacturing footprint.

Key Harsh Environment Connector Manufacturers and Competitive Landscape

The competitive field includes TE Connectivity, Amphenol Corporation, Huber+Suhner, ITT Cannon, Staubli, Glenair, Lemo, Eaton, Molex, Smiths Interconnect, Diamond SA and Optical Cable Corporation. Competition is organised around environmental sealing, electrical and optical performance, miniaturisation, qualification, materials and global programme support. Diversified manufacturers use broad portfolios and distribution to cover multiple end markets, while specialists win where a narrow application needs a highly tailored connector architecture.

The key-player list is presented directly because the market is application- and qualification-led. TE’s DEUTSCH portfolio spans aerospace, defence, marine, automotive and industrial transportation, while Amphenol operates a dedicated Harsh Environment Solutions business covering ruggedised interconnects across multiple end markets. Smiths Interconnect adds specialist military, aerospace and high-reliability connectivity. These positions show why product breadth and application depth can coexist in the same competitive field.

Competition also depends on programme lifecycle. A connector that enters an aircraft, defence system, energy platform or industrial machine after qualification can remain in the bill of materials for years, creating a recurring replacement opportunity. Suppliers therefore invest in lifecycle support, documentation, continuity and regional service as much as in new product launches. Miniaturisation and modularity are additional battlegrounds because customers want more functions in less space without sacrificing environmental protection.

Key Industry Players

  • TE Connectivity
  • Amphenol Corporation
  • Huber+Suhner
  • ITT Cannon
  • Staubli
  • Glenair
  • Lemo
  • Eaton
  • Molex
  • Smiths Interconnect
  • Diamond SA
  • Optical Cable Corporation

Competitive structure

Tier Players Competitive basis
Tier 1 TE Connectivity; Amphenol Corporation Portfolio breadth, global qualification, broad distribution and cross-market programme support
Tier 2 Huber+Suhner; ITT Cannon; Smiths Interconnect; Glenair; Molex; Eaton Application depth, high-reliability products, specialist connector architectures and regional strength
Tier 3 Staubli; Lemo; Diamond SA; Optical Cable Corporation Niche applications, modular systems, optical expertise and project-specific engineering

Harsh Environment Connector Production Capacity Analysis

Production capacity is geographically distributed, but the real constraint is qualified manufacturing capability: controlled materials, sealing processes, precision contacts, automated assembly, testing and certification must all operate together. North America and Europe retain deep aerospace and defence manufacturing capabilities, while Asia Pacific is adding local capacity for industrial, transportation and communications applications. Capacity expansion therefore often follows customer programmes and regional localisation rather than simple unit-demand forecasting.

The component mix creates several upstream dependencies. Metals, elastomers, polymers, plating materials, contact springs, optical components and cable interfaces all require controlled specifications. Connector makers can source many of these inputs from multiple suppliers, but high-reliability grades and specialised plating or sealing materials can create qualification bottlenecks. The consequence is that dual sourcing is possible at the commodity level but much harder at the fully qualified assembly level.

Manufacturing scale also varies by product family. High-volume industrial connectors can benefit from automated assembly and global plants, while aerospace and defence connectors often require more specialised tooling, traceability and inspection. TE’s product families include high-density military and aerospace connectors, while Amphenol’s dedicated harsh-environment segment indicates the scale of resources available to large suppliers. Smaller specialists can still compete by focusing on lower-volume, higher-value applications where engineering content is more important than factory throughput.

Harsh Environment Connector Market Dynamics: Drivers, Restraints and Opportunities

The market is supported by industrial automation, aerospace and defence spending, renewable-energy infrastructure, telecommunications expansion and the rising data density of connected equipment. Key restraints include material and certification cost, counterfeit and quality-control risks, long qualification cycles and design displacement when a system architecture changes. Opportunities are strongest in miniaturisation, hybrid connectors, rugged optical links and new energy or transport infrastructure.

MARKET DRIVERS

Drivers Impact Analysis*

Driver / Restraint (~) % impact on CAGR forecast Geographic relevance Impact timeline
Aerospace and defence equipment modernisation +1.2% North America, Europe, Asia Pacific Medium to long term
Industrial automation and electrification +1.0% Global, strongest in Asia Pacific Immediate to medium term
Renewable energy and offshore infrastructure +0.8% Europe, North America, Asia Pacific Medium to long term
Higher data density and rugged optical connectivity +0.7% Global telecom and industrial markets Medium term

Aerospace and defence programmes raise reliability requirements

Mission-critical systems cannot easily tolerate intermittent connectivity, so connector selection becomes an engineering decision tied to vibration, shock, temperature, EMI shielding and qualification. TE’s aerospace and military portfolios illustrate how suppliers compete through certified families rather than generic interfaces. As platform electronics become denser, suppliers that can increase contact density without sacrificing sealing or qualification can capture incremental value within existing programmes.

Industrial automation expands the rugged connectivity installed base

Automation moves more sensors, motors, machine-vision systems and controllers into environments with dust, washdown, chemicals and repetitive motion. The customer requirement is uninterrupted connectivity, the product response is sealed and strain-relieved interconnection, and the supplier response is broader connector families with compatible accessories. The market implication is a recurring replacement and upgrade pool rather than only new-equipment demand.

Renewable energy adds outdoor and marine exposure

Wind turbines, offshore platforms and solar infrastructure place connectors outside controlled indoor environments for years. Salt mist, humidity, temperature cycling and vibration increase the cost of poor sealing. Suppliers therefore gain when they provide rugged materials, sealed interfaces and field-serviceable designs, creating an opportunity for premium products in projects where a connector failure can cause disproportionately expensive downtime.

Data growth supports rugged optical connectivity

Outdoor telecom, transportation and industrial networks increasingly need high-bandwidth links while remaining exposed to weather and vibration. Fiber optic connectors can solve bandwidth and electromagnetic-interference constraints, but they must preserve optical alignment and environmental sealing. Suppliers that integrate optical connectivity into ruggedised housings can expand beyond traditional power-and-signal applications. This makes the supplier’s ability to preserve environmental performance over the full product life as important as the initial specification and purchase price.

MARKET RESTRAINTS

Restraints Impact Analysis*

Driver / Restraint (~) % impact on CAGR forecast Geographic relevance Impact timeline
Certification and qualification cost −0.9% Aerospace, defence, medical, energy Long term
Material and plating cost volatility −0.6% Global Short to medium term
Counterfeit and grey-market quality risk −0.4% Global aftermarket Immediate to medium term
System redesign and connector displacement −0.3% Industrial and telecom Medium term

Qualification cost creates a barrier to entry

A connector can be mechanically compatible yet still fail a customer’s qualification program because of material, sealing or EMI behaviour. This creates long sales cycles and limits the addressable share for unqualified entrants. Incumbent suppliers can defend positions through documentation and continuity, while new suppliers must often invest in testing and application support before meaningful volume is possible.

Specialty materials and plating add cost pressure

Harsh connectors may use stainless steel, aluminium alloys, titanium, high-performance polymers, nickel plating, specialised elastomers and controlled contact materials. Cost volatility in any of these inputs can compress margins because contracts often emphasise long-term availability. Large suppliers have more purchasing leverage, while specialists must protect margins through higher engineering content and differentiated applications.

Counterfeit components undermine lifecycle reliability

Aftermarket substitution is risky when a connector is part of a safety-critical or difficult-to-access system. A counterfeit or non-qualified component can look similar while using different seals, plating or contact materials. Legitimate suppliers therefore invest in traceability and channel control, while customers increasingly value authorised distribution as part of the product itself.

Connector displacement can follow architecture changes

A rugged connector can be technically excellent and still lose demand when a machine changes its internal architecture, moves to wireless communication or integrates functions into a different module. Suppliers cannot eliminate that risk, so they pursue modular platforms and broader system relationships that allow them to remain relevant when one connector family is redesigned.

MARKET OPPORTUNITIES

Miniaturised high-density connectors

Space-constrained aerospace, unmanned, medical and industrial systems need more contacts without expanding the equipment envelope. TE’s 38999 families demonstrate how high contact density can be combined with harsh-environment requirements. Suppliers that improve density while preserving mechanical robustness can move into higher-value applications and capture additional interfaces per system. This makes the supplier’s ability to preserve environmental performance over the full product life as important as the initial specification and purchase price.

Hybrid power, signal and optical solutions

Customers increasingly want fewer physical connectors while retaining multiple functions. Hybrid systems combine electrical, optical or fluid functions in one ruggedised architecture, reducing harness complexity and maintenance. The opportunity favours suppliers with cross-domain engineering capability because the commercial sale becomes a system-level solution rather than a component-only transaction. This makes the supplier’s ability to preserve environmental performance over the full product life as important as the initial specification and purchase price.

Rugged optical connectivity for 5G and industrial networks

High-speed networks need optical performance without giving up environmental sealing. Outdoor telecom, transport and energy assets provide a growing addressable base where fiber can outperform copper on bandwidth or electromagnetic immunity. Suppliers with established optical alignment expertise and rugged housing capability can capture this premium niche. This makes the supplier’s ability to preserve environmental performance over the full product life as important as the initial specification and purchase price.

Regional manufacturing and application engineering

As customers localise supply chains, suppliers can win by placing manufacturing, testing or technical service nearer the end market. Amphenol and other large suppliers have demonstrated the economics of broad regional operations, while Smiths’ investment in Costa Rica shows how targeted capacity can support aerospace and defence demand. Local response can become a competitive advantage even when the core connector design is globally standardised.

Selected evidence points from leading connectivity suppliers

The commercial case is reinforced by supplier-level evidence. Amphenol reported USD 23.09 billion of consolidated 2025 sales and USD 5.88 billion from Harsh Environment Solutions, while the corresponding 2024 harsh-environment figure was USD 4.42 billion. TE’s DEUTSCH portfolio covers aerospace, defence, marine, automotive and industrial transportation, and individual families span high-density, high-temperature and subsea applications. Smiths Interconnect lists rugged military connectors and a February 2026 investment of £2 million in Costa Rica. These data points show how product breadth, qualification and regional manufacturing shape competition beyond unit price.

Reference point Year / period Value Commercial relevance
Amphenol consolidated net sales 2025 USD 23.09 billion Large scale supports portfolio breadth, manufacturing investment and global programme support.
Amphenol Harsh Environment Solutions sales 2025 USD 5.88 billion Shows the scale of ruggedised connectivity as a dedicated business area.
Amphenol Harsh Environment Solutions sales 2024 USD 4.42 billion Provides a prior-year comparison for the business segment.
Amphenol Harsh Environment Solutions operating income 2025 USD 1.54 billion Illustrates the earnings scale available to fund product and capacity investment.
Amphenol Harsh Environment Solutions operating income 2024 USD 1.09 billion Shows the previous-year operating base of the segment.
TE DEUTSCH 9316 contact current range Current 5–33 A Demonstrates the range of rugged power and signal interfaces within a single family.
TE DEUTSCH 9316 power arrangement Current Up to 600 A Shows that harsh-environment architectures cover both signal and very high power demands.
TE DEUTSCH 9316 pressure rating Current 750 bar Indicates suitability for high-pressure offshore and subsea applications.
TE DEUTSCH 9316 temperature rating Current 190°C High-temperature capability is a critical specification gate in severe environments.
TE MIL-DTL-38999 Series III data connections Current Up to 187 High density reduces the number of separate interfaces in space-constrained systems.
TE MIL-DTL-38999 Series III power contact rating Current Up to 23 A Provides a documented power capability for qualified aerospace and military architectures.
TE DEUTSCH 983 operating temperature Current 260°C Supports use in aircraft zones exposed to severe thermal conditions.
TE DEUTSCH 983 qualification standard Current EN2997 Qualification is a market-access gate in aerospace applications.
Smiths Interconnect Costa Rica investment Feb. 2026 £2 million Regional investment shows the value of local manufacturing and support for aerospace and defence customers.
Global semiconductor sales 2025 USD 791.7 billion Broader electronics production supports the installed base of connected industrial and computing equipment.
Global semiconductor sales growth 2025 vs 2024 25.6% A strong electronics cycle increases demand for equipment and rugged interconnects across multiple end markets.
SIA Q1 2026 semiconductor sales Q1 2026 USD 298.5 billion Strong electronics demand supports continued equipment and infrastructure investment.
SIA Q2 2026 semiconductor sales Q2 2026 USD 403.3 billion The increase demonstrates acceleration in the broader semiconductor ecosystem supporting connected equipment.
SIA July 2026 semiconductor sales July 2026 USD 146.8 billion Record monthly scale supports continued growth in electronics-intensive end markets.
July 2026 year-on-year semiconductor sales growth July 2026 135.1% The sharp annual increase reinforces the demand backdrop for connected equipment and infrastructure.

Harsh Environment Connector Supply Chain Analysis

The chain runs from metals, polymers, elastomers and optical materials through precision contact and shell manufacturing, assembly and environmental testing, and finally OEM/system integration and field replacement. Value concentrates in material selection, sealing design, certification and customer qualification because failures in harsh environments have high downstream costs. This makes the supplier’s ability to preserve environmental performance over the full product life as important as the initial specification and purchase price.

UpstreamMetal shells, contact alloys, plating, polymers, elastomers, optical subassemblies and cable materials
ManufacturingMachining, moulding, stamping, plating, contact insertion, sealing, assembly and inspection
Qualification & ChannelEnvironmental testing, certification, documentation, authorised distribution and lifecycle support
DownstreamAircraft, defence platforms, industrial machinery, telecom infrastructure, energy systems, medical equipment

Upstream

Connector manufacturers depend on a broad material stack rather than a single raw input. Shells may use aluminium, stainless steel or composite materials; contacts rely on conductive alloys and surface treatments; seals use specialised elastomers; optical connectors add ceramic and fiber components. The supply-chain risk is therefore specification consistency across multiple suppliers, with the harshest applications requiring materials that are themselves fully qualified for the target environment.

Manufacturing

Value is created through controlled machining, moulding, stamping, plating, contact insertion and sealing operations. High-volume connectors can use automation, while aerospace and defence products require more traceability and inspection. The manufacturing challenge is to keep dimensions and material properties within qualification limits over long production runs, because a small change can affect mating force, sealing pressure, contact resistance or environmental performance.

Qualification & Channel

Environmental testing and certification convert a manufactured connector into a marketable harsh-environment product. Standards can include military, aerospace, marine, industrial or regional requirements. Authorised distribution is also important because substitution risk is material in safety-critical applications. Suppliers that combine testing data, documentation, authorised channels and field support offer customers lower lifecycle risk than a low-price unqualified component.

Downstream

OEMs and system integrators specify connectors early in platform design and then expect supply continuity throughout production and service. Once a part is approved, replacement demand can continue for many years. The downstream position therefore creates recurring value for suppliers that maintain form-fit-function continuity, manage obsolescence carefully and provide matching accessories, contacts and service parts.

Recent Developments in the Harsh Environment Connector Market

September 4, 2026

Global semiconductor sales reached USD 146.8 billion in July 2026, according to SIA, demonstrating continued expansion of electronics production. For rugged connectors, the broader implication is that more connected industrial, computing and infrastructure equipment enters service, expanding the installed base that requires reliable interconnects. Source. This makes the supplier’s ability to preserve environmental performance over the full product life as important as the initial specification and purchase price.

April 22, 2026

Amphenol released its 2025 Sustainability Report and highlighted harsh-environment solutions as a strategic growth area while its 2025 results showed USD 5.88 billion of Harsh Environment Solutions sales. The combination underscores the scale of rugged connectivity as a diversified business and supports continued investment in product and manufacturing breadth. Source.

February 17, 2026

Smiths Interconnect announced a £2 million investment in a Costa Rica facility to support the growing electronics sector and aerospace and defence markets. The development illustrates how specialised connector companies are adding regional capacity to shorten response times and support customer programmes closer to demand centres. Source. This makes the supplier’s ability to preserve environmental performance over the full product life as important as the initial specification and purchase price.

2026

TE Connectivity continues to expand rugged DEUTSCH solutions for aerospace, defence, marine and industrial transportation, including connector families qualified to demanding military and aerospace specifications. The implication is continued competition around dense, sealed and application-qualified architectures rather than simple commodity connector volume. Source. This makes the supplier’s ability to preserve environmental performance over the full product life as important as the initial specification and purchase price.

REPORT SCOPE & SEGMENTATION

Attribute Scope
Market Harsh Environment Connector Market
Base year / forecast 2025 / 2034
Historical period 2019–2024
Type Circular Connector; Rectangular Connector; Fiber Optic Connector
Application Aerospace & Military; Industrial; Telecommunications; Medical; Energy
Environment Extreme Temperature Zones; High-Vibration Environments; Underwater/Subsea Applications; Corrosive Chemical Environments
Material Stainless Steel; Titanium Alloys; High-Performance Polymers; Nickel Plated Brass
Regions North America; Europe; Asia Pacific; South America; Middle East & Africa
Profiled companies TE Connectivity; Amphenol Corporation; Huber+Suhner; ITT Cannon; Staubli; Glenair; Lemo; Eaton; Molex; Smiths Interconnect; Diamond SA; Optical Cable Corporation

Frequently Asked Questions

What is the 2025 size of the harsh environment connector market?

The rebased 2025 market size is USD 6.18 billion. The figure is used consistently throughout the article. This makes the supplier’s ability to preserve environmental performance over the full product life as important as the initial specification and purchase price.

What is the projected 2034 size?

The rebased 2034 market size is USD 11.02 billion. This extends the growth factor implied by the 2024 and 2032 market anchors across the target 2025–2034 window. This makes the supplier’s ability to preserve environmental performance over the full product life as important as the initial specification and purchase price.

What CAGR is used for 2026–2034?

The article uses a 6.6% CAGR for 2026–2034. The rate describes the compound expansion of the market across the forecast window. This makes the supplier’s ability to preserve environmental performance over the full product life as important as the initial specification and purchase price.

Which connector type is the leading segment?

Circular connectors lead the report scope because sealed cylindrical architectures are widely used in aerospace, defence, industrial, energy and other environments where vibration, moisture and mechanical stress are significant. This makes the supplier’s ability to preserve environmental performance over the full product life as important as the initial specification and purchase price.

Which application is the largest?

Aerospace & Military is the leading application because mission-critical systems place unusually high value on qualified reliability, environmental protection, EMI performance and long lifecycle support. This makes the supplier’s ability to preserve environmental performance over the full product life as important as the initial specification and purchase price. In these programmes, qualification testing, field reliability and lifecycle continuity can carry more commercial weight than a small difference in initial connector price.

Which region is largest?

North America is the largest regional market, supported by aerospace, defence, industrial, energy and communications applications. Asia Pacific is the fastest-growing region. This makes the supplier’s ability to preserve environmental performance over the full product life as important as the initial specification and purchase price. Its diversified end-market base also gives suppliers a steadier replacement pool across aircraft, defence systems, industrial equipment and energy infrastructure.

Which companies are profiled?

The profiled company universe includes TE Connectivity, Amphenol Corporation, Huber+Suhner, ITT Cannon, Staubli, Glenair, Lemo, Eaton, Molex, Smiths Interconnect, Diamond SA and Optical Cable Corporation. This makes the supplier’s ability to preserve environmental performance over the full product life as important as the initial specification and purchase price. The list spans diversified connectivity groups and specialist manufacturers, giving buyers options across circular, rectangular and fiber architectures with different qualification footprints.

What environments are included?

The scope includes extreme temperature zones, high-vibration environments, underwater/subsea applications and corrosive chemical environments. These conditions drive sealing, material and mechanical design requirements. This makes the supplier’s ability to preserve environmental performance over the full product life as important as the initial specification and purchase price. Material selection, sealing and mechanical retention must be matched to the specific environment, so the same nominal connector family can require materially different constructions and approvals.

Why do harsh environment connectors cost more than standard connectors?

The products require additional engineering for sealing, corrosion resistance, vibration, temperature, contact reliability, testing and certification. Customers therefore purchase environmental reliability and qualification evidence in addition to the basic electrical connection. This makes the supplier’s ability to preserve environmental performance over the full product life as important as the initial specification and purchase price.

What is the main opportunity for suppliers?

The strongest opportunities are in miniaturised high-density connectors, hybrid electrical-optical architectures, rugged fiber connectivity and regional application engineering. These areas address the growing need for more functions in smaller and more difficult operating environments. This makes the supplier’s ability to preserve environmental performance over the full product life as important as the initial specification and purchase price.

Harsh Environment Connector Market Size, Trends, Business Strategies 2026-2034

Get Sample Report PDF for Exclusive Insights

Report Sample Includes

  • Table of Contents
  • List of Tables & Figures
  • Charts, Research Methodology, and more...

PDF Icon Download Sample Report PDF

Download Sample Report

Table of Content

1 Introduction to Research & Analysis Reports
1.1 Harsh Environment Connector Market Definition
1.2 Market Segments
1.2.1 Segment by Type
1.2.2 Segment by Application
1.3 Global Harsh Environment Connector Market Overview
1.4 Features & Benefits of This Report
1.5 Methodology & Sources of Information
1.5.1 Research Methodology
1.5.2 Research Process
1.5.3 Base Year
1.5.4 Report Assumptions & Caveats
2 Global Harsh Environment Connector Overall Market Size
2.1 Global Harsh Environment Connector Market Size: 2024 VS 2032
2.2 Global Harsh Environment Connector Market Size, Prospects & Forecasts: 2020-2032
2.3 Global Harsh Environment Connector Sales: 2020-2032
3 Company Landscape
3.1 Top Harsh Environment Connector Players in Global Market
3.2 Top Global Harsh Environment Connector Companies Ranked by Revenue
3.3 Global Harsh Environment Connector Revenue by Companies
3.4 Global Harsh Environment Connector Sales by Companies
3.5 Global Harsh Environment Connector Price by Manufacturer (2020-2025)
3.6 Top 3 and Top 5 Harsh Environment Connector Companies in Global Market, by Revenue in 2024
3.7 Global Manufacturers Harsh Environment Connector Product Type
3.8 Tier 1, Tier 2, and Tier 3 Harsh Environment Connector Players in Global Market
3.8.1 List of Global Tier 1 Harsh Environment Connector Companies
3.8.2 List of Global Tier 2 and Tier 3 Harsh Environment Connector Companies
4 Sights by Product
4.1 Overview
4.1.1 Segment by Type – Global Harsh Environment Connector Market Size Markets, 2024 & 2032
4.1.2 Circular Connector
4.1.3 Rectangular Connector
4.1.4 Fiber Optic Connector
4.2 Segment by Type – Global Harsh Environment Connector Revenue & Forecasts
4.2.1 Segment by Type – Global Harsh Environment Connector Revenue, 2020-2025
4.2.2 Segment by Type – Global Harsh Environment Connector Revenue, 2026-2032
4.2.3 Segment by Type – Global Harsh Environment Connector Revenue Market Share, 2020-2032
4.3 Segment by Type – Global Harsh Environment Connector Sales & Forecasts
4.3.1 Segment by Type – Global Harsh Environment Connector Sales, 2020-2025
4.3.2 Segment by Type – Global Harsh Environment Connector Sales, 2026-2032
4.3.3 Segment by Type – Global Harsh Environment Connector Sales Market Share, 2020-2032
4.4 Segment by Type – Global Harsh Environment Connector Price (Manufacturers Selling Prices), 2020-2032
5 Sights by Application
5.1 Overview
5.1.1 Segment by Application – Global Harsh Environment Connector Market Size, 2024 & 2032
5.1.2 Aerospace & Military
5.1.3 Industrial
5.1.4 Telecommunications
5.1.5 Medical
5.1.6 Energy
5.1.7 Others
5.2 Segment by Application – Global Harsh Environment Connector Revenue & Forecasts
5.2.1 Segment by Application – Global Harsh Environment Connector Revenue, 2020-2025
5.2.2 Segment by Application – Global Harsh Environment Connector Revenue, 2026-2032
5.2.3 Segment by Application – Global Harsh Environment Connector Revenue Market Share, 2020-2032
5.3 Segment by Application – Global Harsh Environment Connector Sales & Forecasts
5.3.1 Segment by Application – Global Harsh Environment Connector Sales, 2020-2025
5.3.2 Segment by Application – Global Harsh Environment Connector Sales, 2026-2032
5.3.3 Segment by Application – Global Harsh Environment Connector Sales Market Share, 2020-2032
5.4 Segment by Application – Global Harsh Environment Connector Price (Manufacturers Selling Prices), 2020-2032
6 Sights by Region
6.1 By Region – Global Harsh Environment Connector Market Size, 2024 & 2032
6.2 By Region – Global Harsh Environment Connector Revenue & Forecasts
6.2.1 By Region – Global Harsh Environment Connector Revenue, 2020-2025
6.2.2 By Region – Global Harsh Environment Connector Revenue, 2026-2032
6.2.3 By Region – Global Harsh Environment Connector Revenue Market Share, 2020-2032
6.3 By Region – Global Harsh Environment Connector Sales & Forecasts
6.3.1 By Region – Global Harsh Environment Connector Sales, 2020-2025
6.3.2 By Region – Global Harsh Environment Connector Sales, 2026-2032
6.3.3 By Region – Global Harsh Environment Connector Sales Market Share, 2020-2032
6.4 North America
6.4.1 By Country – North America Harsh Environment Connector Revenue, 2020-2032
6.4.2 By Country – North America Harsh Environment Connector Sales, 2020-2032
6.4.3 United States Harsh Environment Connector Market Size, 2020-2032
6.4.4 Canada Harsh Environment Connector Market Size, 2020-2032
6.4.5 Mexico Harsh Environment Connector Market Size, 2020-2032
6.5 Europe
6.5.1 By Country – Europe Harsh Environment Connector Revenue, 2020-2032
6.5.2 By Country – Europe Harsh Environment Connector Sales, 2020-2032
6.5.3 Germany Harsh Environment Connector Market Size, 2020-2032
6.5.4 France Harsh Environment Connector Market Size, 2020-2032
6.5.5 U.K. Harsh Environment Connector Market Size, 2020-2032
6.5.6 Italy Harsh Environment Connector Market Size, 2020-2032
6.5.7 Russia Harsh Environment Connector Market Size, 2020-2032
6.5.8 Nordic Countries Harsh Environment Connector Market Size, 2020-2032
6.5.9 Benelux Harsh Environment Connector Market Size, 2020-2032
6.6 Asia
6.6.1 By Region – Asia Harsh Environment Connector Revenue, 2020-2032
6.6.2 By Region – Asia Harsh Environment Connector Sales, 2020-2032
6.6.3 China Harsh Environment Connector Market Size, 2020-2032
6.6.4 Japan Harsh Environment Connector Market Size, 2020-2032
6.6.5 South Korea Harsh Environment Connector Market Size, 2020-2032
6.6.6 Southeast Asia Harsh Environment Connector Market Size, 2020-2032
6.6.7 India Harsh Environment Connector Market Size, 2020-2032
6.7 South America
6.7.1 By Country – South America Harsh Environment Connector Revenue, 2020-2032
6.7.2 By Country – South America Harsh Environment Connector Sales, 2020-2032
6.7.3 Brazil Harsh Environment Connector Market Size, 2020-2032
6.7.4 Argentina Harsh Environment Connector Market Size, 2020-2032
6.8 Middle East & Africa
6.8.1 By Country – Middle East & Africa Harsh Environment Connector Revenue, 2020-2032
6.8.2 By Country – Middle East & Africa Harsh Environment Connector Sales, 2020-2032
6.8.3 Turkey Harsh Environment Connector Market Size, 2020-2032
6.8.4 Israel Harsh Environment Connector Market Size, 2020-2032
6.8.5 Saudi Arabia Harsh Environment Connector Market Size, 2020-2032
6.8.6 UAE Harsh Environment Connector Market Size, 2020-2032
7 Manufacturers & Brands Profiles
7.1 Huber+Suhner
7.1.1 Huber+Suhner Company Summary
7.1.2 Huber+Suhner Business Overview
7.1.3 Huber+Suhner Harsh Environment Connector Major Product Offerings
7.1.4 Huber+Suhner Harsh Environment Connector Sales and Revenue in Global (2020-2025)
7.1.5 Huber+Suhner Key News & Latest Developments
7.2 Amphenol Communications Solutions
7.2.1 Amphenol Communications Solutions Company Summary
7.2.2 Amphenol Communications Solutions Business Overview
7.2.3 Amphenol Communications Solutions Harsh Environment Connector Major Product Offerings
7.2.4 Amphenol Communications Solutions Harsh Environment Connector Sales and Revenue in Global (2020-2025)
7.2.5 Amphenol Communications Solutions Key News & Latest Developments
7.3 Diamond SA
7.3.1 Diamond SA Company Summary
7.3.2 Diamond SA Business Overview
7.3.3 Diamond SA Harsh Environment Connector Major Product Offerings
7.3.4 Diamond SA Harsh Environment Connector Sales and Revenue in Global (2020-2025)
7.3.5 Diamond SA Key News & Latest Developments
7.4 Switchcraft
7.4.1 Switchcraft Company Summary
7.4.2 Switchcraft Business Overview
7.4.3 Switchcraft Harsh Environment Connector Major Product Offerings
7.4.4 Switchcraft Harsh Environment Connector Sales and Revenue in Global (2020-2025)
7.4.5 Switchcraft Key News & Latest Developments
7.5 Staubli
7.5.1 Staubli Company Summary
7.5.2 Staubli Business Overview
7.5.3 Staubli Harsh Environment Connector Major Product Offerings
7.5.4 Staubli Harsh Environment Connector Sales and Revenue in Global (2020-2025)
7.5.5 Staubli Key News & Latest Developments
7.6 Cenflex
7.6.1 Cenflex Company Summary
7.6.2 Cenflex Business Overview
7.6.3 Cenflex Harsh Environment Connector Major Product Offerings
7.6.4 Cenflex Harsh Environment Connector Sales and Revenue in Global (2020-2025)
7.6.5 Cenflex Key News & Latest Developments
7.7 ITT Cannon
7.7.1 ITT Cannon Company Summary
7.7.2 ITT Cannon Business Overview
7.7.3 ITT Cannon Harsh Environment Connector Major Product Offerings
7.7.4 ITT Cannon Harsh Environment Connector Sales and Revenue in Global (2020-2025)
7.7.5 ITT Cannon Key News & Latest Developments
7.8 Smiths Interconnect
7.8.1 Smiths Interconnect Company Summary
7.8.2 Smiths Interconnect Business Overview
7.8.3 Smiths Interconnect Harsh Environment Connector Major Product Offerings
7.8.4 Smiths Interconnect Harsh Environment Connector Sales and Revenue in Global (2020-2025)
7.8.5 Smiths Interconnect Key News & Latest Developments
7.9 TE Connectivity
7.9.1 TE Connectivity Company Summary
7.9.2 TE Connectivity Business Overview
7.9.3 TE Connectivity Harsh Environment Connector Major Product Offerings
7.9.4 TE Connectivity Harsh Environment Connector Sales and Revenue in Global (2020-2025)
7.9.5 TE Connectivity Key News & Latest Developments
7.10 Glenair
7.10.1 Glenair Company Summary
7.10.2 Glenair Business Overview
7.10.3 Glenair Harsh Environment Connector Major Product Offerings
7.10.4 Glenair Harsh Environment Connector Sales and Revenue in Global (2020-2025)
7.10.5 Glenair Key News & Latest Developments
7.11 Conesys
7.11.1 Conesys Company Summary
7.11.2 Conesys Business Overview
7.11.3 Conesys Harsh Environment Connector Major Product Offerings
7.11.4 Conesys Harsh Environment Connector Sales and Revenue in Global (2020-2025)
7.11.5 Conesys Key News & Latest Developments
7.12 Power Dynamics
7.12.1 Power Dynamics Company Summary
7.12.2 Power Dynamics Business Overview
7.12.3 Power Dynamics Harsh Environment Connector Major Product Offerings
7.12.4 Power Dynamics Harsh Environment Connector Sales and Revenue in Global (2020-2025)
7.12.5 Power Dynamics Key News & Latest Developments
7.13 Lemo
7.13.1 Lemo Company Summary
7.13.2 Lemo Business Overview
7.13.3 Lemo Harsh Environment Connector Major Product Offerings
7.13.4 Lemo Harsh Environment Connector Sales and Revenue in Global (2020-2025)
7.13.5 Lemo Key News & Latest Developments
7.14 Optical Cable Corporation
7.14.1 Optical Cable Corporation Company Summary
7.14.2 Optical Cable Corporation Business Overview
7.14.3 Optical Cable Corporation Harsh Environment Connector Major Product Offerings
7.14.4 Optical Cable Corporation Harsh Environment Connector Sales and Revenue in Global (2020-2025)
7.14.5 Optical Cable Corporation Key News & Latest Developments
7.15 Eaton
7.15.1 Eaton Company Summary
7.15.2 Eaton Business Overview
7.15.3 Eaton Harsh Environment Connector Major Product Offerings
7.15.4 Eaton Harsh Environment Connector Sales and Revenue in Global (2020-2025)
7.15.5 Eaton Key News & Latest Developments
7.16 Smiths Group
7.16.1 Smiths Group Company Summary
7.16.2 Smiths Group Business Overview
7.16.3 Smiths Group Harsh Environment Connector Major Product Offerings
7.16.4 Smiths Group Harsh Environment Connector Sales and Revenue in Global (2020-2025)
7.16.5 Smiths Group Key News & Latest Developments
7.17 Molex
7.17.1 Molex Company Summary
7.17.2 Molex Business Overview
7.17.3 Molex Harsh Environment Connector Major Product Offerings
7.17.4 Molex Harsh Environment Connector Sales and Revenue in Global (2020-2025)
7.17.5 Molex Key News & Latest Developments
7.18 Rojone
7.18.1 Rojone Company Summary
7.18.2 Rojone Business Overview
7.18.3 Rojone Harsh Environment Connector Major Product Offerings
7.18.4 Rojone Harsh Environment Connector Sales and Revenue in Global (2020-2025)
7.18.5 Rojone Key News & Latest Developments
7.19 AMETEK
7.19.1 AMETEK Company Summary
7.19.2 AMETEK Business Overview
7.19.3 AMETEK Harsh Environment Connector Major Product Offerings
7.19.4 AMETEK Harsh Environment Connector Sales and Revenue in Global (2020-2025)
7.19.5 AMETEK Key News & Latest Developments
7.20 Marechal Electric
7.20.1 Marechal Electric Company Summary
7.20.2 Marechal Electric Business Overview
7.20.3 Marechal Electric Harsh Environment Connector Major Product Offerings
7.20.4 Marechal Electric Harsh Environment Connector Sales and Revenue in Global (2020-2025)
7.20.5 Marechal Electric Key News & Latest Developments
8 Global Harsh Environment Connector Production Capacity, Analysis
8.1 Global Harsh Environment Connector Production Capacity, 2020-2032
8.2 Harsh Environment Connector Production Capacity of Key Manufacturers in Global Market
8.3 Global Harsh Environment Connector Production by Region
9 Key Market Trends, Opportunity, Drivers and Restraints
9.1 Market Opportunities & Trends
9.2 Market Drivers
9.3 Market Restraints
10 Harsh Environment Connector Supply Chain Analysis
10.1 Harsh Environment Connector Industry Value Chain
10.2 Harsh Environment Connector Upstream Market
10.3 Harsh Environment Connector Downstream and Clients
10.4 Marketing Channels Analysis
10.4.1 Marketing Channels
10.4.2 Harsh Environment Connector Distributors and Sales Agents in Global
11 Conclusion
12 Appendix
12.1 Note
12.2 Examples of Clients
12.3 DisclaimerList of Tables
Table 1. Key Players of Harsh Environment Connector in Global Market
Table 2. Top Harsh Environment Connector Players in Global Market, Ranking by Revenue (2024)
Table 3. Global Harsh Environment Connector Revenue by Companies, (US$, Mn), 2020-2025
Table 4. Global Harsh Environment Connector Revenue Share by Companies, 2020-2025
Table 5. Global Harsh Environment Connector Sales by Companies, (K Units), 2020-2025
Table 6. Global Harsh Environment Connector Sales Share by Companies, 2020-2025
Table 7. Key Manufacturers Harsh Environment Connector Price (2020-2025) & (US$/Unit)
Table 8. Global Manufacturers Harsh Environment Connector Product Type
Table 9. List of Global Tier 1 Harsh Environment Connector Companies, Revenue (US$, Mn) in 2024 and Market Share
Table 10. List of Global Tier 2 and Tier 3 Harsh Environment Connector Companies, Revenue (US$, Mn) in 2024 and Market Share
Table 11. Segment by Type – Global Harsh Environment Connector Revenue, (US$, Mn), 2024 & 2032
Table 12. Segment by Type – Global Harsh Environment Connector Revenue (US$, Mn), 2020-2025
Table 13. Segment by Type – Global Harsh Environment Connector Revenue (US$, Mn), 2026-2032
Table 14. Segment by Type – Global Harsh Environment Connector Sales (K Units), 2020-2025
Table 15. Segment by Type – Global Harsh Environment Connector Sales (K Units), 2026-2032
Table 16. Segment by Application – Global Harsh Environment Connector Revenue, (US$, Mn), 2024 & 2032
Table 17. Segment by Application – Global Harsh Environment Connector Revenue, (US$, Mn), 2020-2025
Table 18. Segment by Application – Global Harsh Environment Connector Revenue, (US$, Mn), 2026-2032
Table 19. Segment by Application – Global Harsh Environment Connector Sales, (K Units), 2020-2025
Table 20. Segment by Application – Global Harsh Environment Connector Sales, (K Units), 2026-2032
Table 21. By Region – Global Harsh Environment Connector Revenue, (US$, Mn), 2025-2032
Table 22. By Region – Global Harsh Environment Connector Revenue, (US$, Mn), 2020-2025
Table 23. By Region – Global Harsh Environment Connector Revenue, (US$, Mn), 2026-2032
Table 24. By Region – Global Harsh Environment Connector Sales, (K Units), 2020-2025
Table 25. By Region – Global Harsh Environment Connector Sales, (K Units), 2026-2032
Table 26. By Country – North America Harsh Environment Connector Revenue, (US$, Mn), 2020-2025
Table 27. By Country – North America Harsh Environment Connector Revenue, (US$, Mn), 2026-2032
Table 28. By Country – North America Harsh Environment Connector Sales, (K Units), 2020-2025
Table 29. By Country – North America Harsh Environment Connector Sales, (K Units), 2026-2032
Table 30. By Country – Europe Harsh Environment Connector Revenue, (US$, Mn), 2020-2025
Table 31. By Country – Europe Harsh Environment Connector Revenue, (US$, Mn), 2026-2032
Table 32. By Country – Europe Harsh Environment Connector Sales, (K Units), 2020-2025
Table 33. By Country – Europe Harsh Environment Connector Sales, (K Units), 2026-2032
Table 34. By Region – Asia Harsh Environment Connector Revenue, (US$, Mn), 2020-2025
Table 35. By Region – Asia Harsh Environment Connector Revenue, (US$, Mn), 2026-2032
Table 36. By Region – Asia Harsh Environment Connector Sales, (K Units), 2020-2025
Table 37. By Region – Asia Harsh Environment Connector Sales, (K Units), 2026-2032
Table 38. By Country – South America Harsh Environment Connector Revenue, (US$, Mn), 2020-2025
Table 39. By Country – South America Harsh Environment Connector Revenue, (US$, Mn), 2026-2032
Table 40. By Country – South America Harsh Environment Connector Sales, (K Units), 2020-2025
Table 41. By Country – South America Harsh Environment Connector Sales, (K Units), 2026-2032
Table 42. By Country – Middle East & Africa Harsh Environment Connector Revenue, (US$, Mn), 2020-2025
Table 43. By Country – Middle East & Africa Harsh Environment Connector Revenue, (US$, Mn), 2026-2032
Table 44. By Country – Middle East & Africa Harsh Environment Connector Sales, (K Units), 2020-2025
Table 45. By Country – Middle East & Africa Harsh Environment Connector Sales, (K Units), 2026-2032
Table 46. Huber+Suhner Company Summary
Table 47. Huber+Suhner Harsh Environment Connector Product Offerings
Table 48. Huber+Suhner Harsh Environment Connector Sales (K Units), Revenue (US$, Mn) and Average Price (US$/Unit) & (2020-2025)
Table 49. Huber+Suhner Key News & Latest Developments
Table 50. Amphenol Communications Solutions Company Summary
Table 51. Amphenol Communications Solutions Harsh Environment Connector Product Offerings
Table 52. Amphenol Communications Solutions Harsh Environment Connector Sales (K Units), Revenue (US$, Mn) and Average Price (US$/Unit) & (2020-2025)
Table 53. Amphenol Communications Solutions Key News & Latest Developments
Table 54. Diamond SA Company Summary
Table 55. Diamond SA Harsh Environment Connector Product Offerings
Table 56. Diamond SA Harsh Environment Connector Sales (K Units), Revenue (US$, Mn) and Average Price (US$/Unit) & (2020-2025)
Table 57. Diamond SA Key News & Latest Developments
Table 58. Switchcraft Company Summary
Table 59. Switchcraft Harsh Environment Connector Product Offerings
Table 60. Switchcraft Harsh Environment Connector Sales (K Units), Revenue (US$, Mn) and Average Price (US$/Unit) & (2020-2025)
Table 61. Switchcraft Key News & Latest Developments
Table 62. Staubli Company Summary
Table 63. Staubli Harsh Environment Connector Product Offerings
Table 64. Staubli Harsh Environment Connector Sales (K Units), Revenue (US$, Mn) and Average Price (US$/Unit) & (2020-2025)
Table 65. Staubli Key News & Latest Developments
Table 66. Cenflex Company Summary
Table 67. Cenflex Harsh Environment Connector Product Offerings
Table 68. Cenflex Harsh Environment Connector Sales (K Units), Revenue (US$, Mn) and Average Price (US$/Unit) & (2020-2025)
Table 69. Cenflex Key News & Latest Developments
Table 70. ITT Cannon Company Summary
Table 71. ITT Cannon Harsh Environment Connector Product Offerings
Table 72. ITT Cannon Harsh Environment Connector Sales (K Units), Revenue (US$, Mn) and Average Price (US$/Unit) & (2020-2025)
Table 73. ITT Cannon Key News & Latest Developments
Table 74. Smiths Interconnect Company Summary
Table 75. Smiths Interconnect Harsh Environment Connector Product Offerings
Table 76. Smiths Interconnect Harsh Environment Connector Sales (K Units), Revenue (US$, Mn) and Average Price (US$/Unit) & (2020-2025)
Table 77. Smiths Interconnect Key News & Latest Developments
Table 78. TE Connectivity Company Summary
Table 79. TE Connectivity Harsh Environment Connector Product Offerings
Table 80. TE Connectivity Harsh Environment Connector Sales (K Units), Revenue (US$, Mn) and Average Price (US$/Unit) & (2020-2025)
Table 81. TE Connectivity Key News & Latest Developments
Table 82. Glenair Company Summary
Table 83. Glenair Harsh Environment Connector Product Offerings
Table 84. Glenair Harsh Environment Connector Sales (K Units), Revenue (US$, Mn) and Average Price (US$/Unit) & (2020-2025)
Table 85. Glenair Key News & Latest Developments
Table 86. Conesys Company Summary
Table 87. Conesys Harsh Environment Connector Product Offerings
Table 88. Conesys Harsh Environment Connector Sales (K Units), Revenue (US$, Mn) and Average Price (US$/Unit) & (2020-2025)
Table 89. Conesys Key News & Latest Developments
Table 90. Power Dynamics Company Summary
Table 91. Power Dynamics Harsh Environment Connector Product Offerings
Table 92. Power Dynamics Harsh Environment Connector Sales (K Units), Revenue (US$, Mn) and Average Price (US$/Unit) & (2020-2025)
Table 93. Power Dynamics Key News & Latest Developments
Table 94. Lemo Company Summary
Table 95. Lemo Harsh Environment Connector Product Offerings
Table 96. Lemo Harsh Environment Connector Sales (K Units), Revenue (US$, Mn) and Average Price (US$/Unit) & (2020-2025)
Table 97. Lemo Key News & Latest Developments
Table 98. Optical Cable Corporation Company Summary
Table 99. Optical Cable Corporation Harsh Environment Connector Product Offerings
Table 100. Optical Cable Corporation Harsh Environment Connector Sales (K Units), Revenue (US$, Mn) and Average Price (US$/Unit) & (2020-2025)
Table 101. Optical Cable Corporation Key News & Latest Developments
Table 102. Eaton Company Summary
Table 103. Eaton Harsh Environment Connector Product Offerings
Table 104. Eaton Harsh Environment Connector Sales (K Units), Revenue (US$, Mn) and Average Price (US$/Unit) & (2020-2025)
Table 105. Eaton Key News & Latest Developments
Table 106. Smiths Group Company Summary
Table 107. Smiths Group Harsh Environment Connector Product Offerings
Table 108. Smiths Group Harsh Environment Connector Sales (K Units), Revenue (US$, Mn) and Average Price (US$/Unit) & (2020-2025)
Table 109. Smiths Group Key News & Latest Developments
Table 110. Molex Company Summary
Table 111. Molex Harsh Environment Connector Product Offerings
Table 112. Molex Harsh Environment Connector Sales (K Units), Revenue (US$, Mn) and Average Price (US$/Unit) & (2020-2025)
Table 113. Molex Key News & Latest Developments
Table 114. Rojone Company Summary
Table 115. Rojone Harsh Environment Connector Product Offerings
Table 116. Rojone Harsh Environment Connector Sales (K Units), Revenue (US$, Mn) and Average Price (US$/Unit) & (2020-2025)
Table 117. Rojone Key News & Latest Developments
Table 118. AMETEK Company Summary
Table 119. AMETEK Harsh Environment Connector Product Offerings
Table 120. AMETEK Harsh Environment Connector Sales (K Units), Revenue (US$, Mn) and Average Price (US$/Unit) & (2020-2025)
Table 121. AMETEK Key News & Latest Developments
Table 122. Marechal Electric Company Summary
Table 123. Marechal Electric Harsh Environment Connector Product Offerings
Table 124. Marechal Electric Harsh Environment Connector Sales (K Units), Revenue (US$, Mn) and Average Price (US$/Unit) & (2020-2025)
Table 125. Marechal Electric Key News & Latest Developments
Table 126. Harsh Environment Connector Capacity of Key Manufacturers in Global Market, 2023-2025 (K Units)
Table 127. Global Harsh Environment Connector Capacity Market Share of Key Manufacturers, 2023-2025
Table 128. Global Harsh Environment Connector Production by Region, 2020-2025 (K Units)
Table 129. Global Harsh Environment Connector Production by Region, 2026-2032 (K Units)
Table 130. Harsh Environment Connector Market Opportunities & Trends in Global Market
Table 131. Harsh Environment Connector Market Drivers in Global Market
Table 132. Harsh Environment Connector Market Restraints in Global Market
Table 133. Harsh Environment Connector Raw Materials
Table 134. Harsh Environment Connector Raw Materials Suppliers in Global Market
Table 135. Typical Harsh Environment Connector Downstream
Table 136. Harsh Environment Connector Downstream Clients in Global Market
Table 137. Harsh Environment Connector Distributors and Sales Agents in Global Market

List of Figures
Figure 1. Harsh Environment Connector Product Picture
Figure 2. Harsh Environment Connector Segment by Type in 2024
Figure 3. Harsh Environment Connector Segment by Application in 2024
Figure 4. Global Harsh Environment Connector Market Overview: 2024
Figure 5. Key Caveats
Figure 6. Global Harsh Environment Connector Market Size: 2024 VS 2032 (US$, Mn)
Figure 7. Global Harsh Environment Connector Revenue: 2020-2032 (US$, Mn)
Figure 8. Harsh Environment Connector Sales in Global Market: 2020-2032 (K Units)
Figure 9. The Top 3 and 5 Players Market Share by Harsh Environment Connector Revenue in 2024
Figure 10. Segment by Type – Global Harsh Environment Connector Revenue, (US$, Mn), 2024 & 2032
Figure 11. Segment by Type – Global Harsh Environment Connector Revenue Market Share, 2020-2032
Figure 12. Segment by Type – Global Harsh Environment Connector Sales Market Share, 2020-2032
Figure 13. Segment by Type – Global Harsh Environment Connector Price (US$/Unit), 2020-2032
Figure 14. Segment by Application – Global Harsh Environment Connector Revenue, (US$, Mn), 2024 & 2032
Figure 15. Segment by Application – Global Harsh Environment Connector Revenue Market Share, 2020-2032
Figure 16. Segment by Application – Global Harsh Environment Connector Sales Market Share, 2020-2032
Figure 17. Segment by Application -Global Harsh Environment Connector Price (US$/Unit), 2020-2032
Figure 18. By Region – Global Harsh Environment Connector Revenue, (US$, Mn), 2025 & 2032
Figure 19. By Region – Global Harsh Environment Connector Revenue Market Share, 2020 VS 2024 VS 2032
Figure 20. By Region – Global Harsh Environment Connector Revenue Market Share, 2020-2032
Figure 21. By Region – Global Harsh Environment Connector Sales Market Share, 2020-2032
Figure 22. By Country – North America Harsh Environment Connector Revenue Market Share, 2020-2032
Figure 23. By Country – North America Harsh Environment Connector Sales Market Share, 2020-2032
Figure 24. United States Harsh Environment Connector Revenue, (US$, Mn), 2020-2032
Figure 25. Canada Harsh Environment Connector Revenue, (US$, Mn), 2020-2032
Figure 26. Mexico Harsh Environment Connector Revenue, (US$, Mn), 2020-2032
Figure 27. By Country – Europe Harsh Environment Connector Revenue Market Share, 2020-2032
Figure 28. By Country – Europe Harsh Environment Connector Sales Market Share, 2020-2032
Figure 29. Germany Harsh Environment Connector Revenue, (US$, Mn), 2020-2032
Figure 30. France Harsh Environment Connector Revenue, (US$, Mn), 2020-2032
Figure 31. U.K. Harsh Environment Connector Revenue, (US$, Mn), 2020-2032
Figure 32. Italy Harsh Environment Connector Revenue, (US$, Mn), 2020-2032
Figure 33. Russia Harsh Environment Connector Revenue, (US$, Mn), 2020-2032
Figure 34. Nordic Countries Harsh Environment Connector Revenue, (US$, Mn), 2020-2032
Figure 35. Benelux Harsh Environment Connector Revenue, (US$, Mn), 2020-2032
Figure 36. By Region – Asia Harsh Environment Connector Revenue Market Share, 2020-2032
Figure 37. By Region – Asia Harsh Environment Connector Sales Market Share, 2020-2032
Figure 38. China Harsh Environment Connector Revenue, (US$, Mn), 2020-2032
Figure 39. Japan Harsh Environment Connector Revenue, (US$, Mn), 2020-2032
Figure 40. South Korea Harsh Environment Connector Revenue, (US$, Mn), 2020-2032
Figure 41. Southeast Asia Harsh Environment Connector Revenue, (US$, Mn), 2020-2032
Figure 42. India Harsh Environment Connector Revenue, (US$, Mn), 2020-2032
Figure 43. By Country – South America Harsh Environment Connector Revenue Market Share, 2020-2032
Figure 44. By Country – South America Harsh Environment Connector Sales, Market Share, 2020-2032
Figure 45. Brazil Harsh Environment Connector Revenue, (US$, Mn), 2020-2032
Figure 46. Argentina Harsh Environment Connector Revenue, (US$, Mn), 2020-2032
Figure 47. By Country – Middle East & Africa Harsh Environment Connector Revenue, Market Share, 2020-2032
Figure 48. By Country – Middle East & Africa Harsh Environment Connector Sales, Market Share, 2020-2032
Figure 49. Turkey Harsh Environment Connector Revenue, (US$, Mn), 2020-2032
Figure 50. Israel Harsh Environment Connector Revenue, (US$, Mn), 2020-2032
Figure 51. Saudi Arabia Harsh Environment Connector Revenue, (US$, Mn), 2020-2032
Figure 52. UAE Harsh Environment Connector Revenue, (US$, Mn), 2020-2032
Figure 53. Global Harsh Environment Connector Production Capacity (K Units), 2020-2032
Figure 54. The Percentage of Production Harsh Environment Connector by Region, 2024 VS 2032
Figure 55. Harsh Environment Connector Industry Value Chain
Figure 56. Marketing Channels