Halogen-free Cables Market Trends, Business Strategies 2025-2032

Global Halogen-free Cables market size was estimated at USD 332.10 million in 2023 and is projected to reach USD 407.52 million by 2032, exhibiting a CAGR of 2.30% during the forecast period.

PDF Icon Download Sample Report PDF
  • Quick Dispatch

    All Orders

  • Secure Payment

    100% Secure Payment

Price range: $1,500.00 through $4,250.00

Clear

Halogen-free Cables Market Overview

Halogen free cables are engineered and designed so that emissions during a fire offer low toxicity and low smoke. This type of cabling is increasingly of relevance in public sector housing and major new developments.

This report provides a deep insight into the global Halogen-free Cables market covering all its essential aspects. This ranges from a macro overview of the market to micro details of the market size, competitive landscape, development trend, niche market, key market drivers and challenges, SWOT analysis, value chain analysis, etc.

The analysis helps the reader to shape the competition within the industries and strategies for the competitive environment to enhance the potential profit. Furthermore, it provides a simple framework for evaluating and accessing the position of the business organization. The report structure also focuses on the competitive landscape of the Global Halogen-free Cables Market, this report introduces in detail the market share, market performance, product situation, operation situation, etc. of the main players, which helps the readers in the industry to identify the main competitors and deeply understand the competition pattern of the market.
In a word, this report is a must-read for industry players, investors, researchers, consultants, business strategists, and all those who have any kind of stake or are planning to foray into the Halogen-free Cables market in any manner.

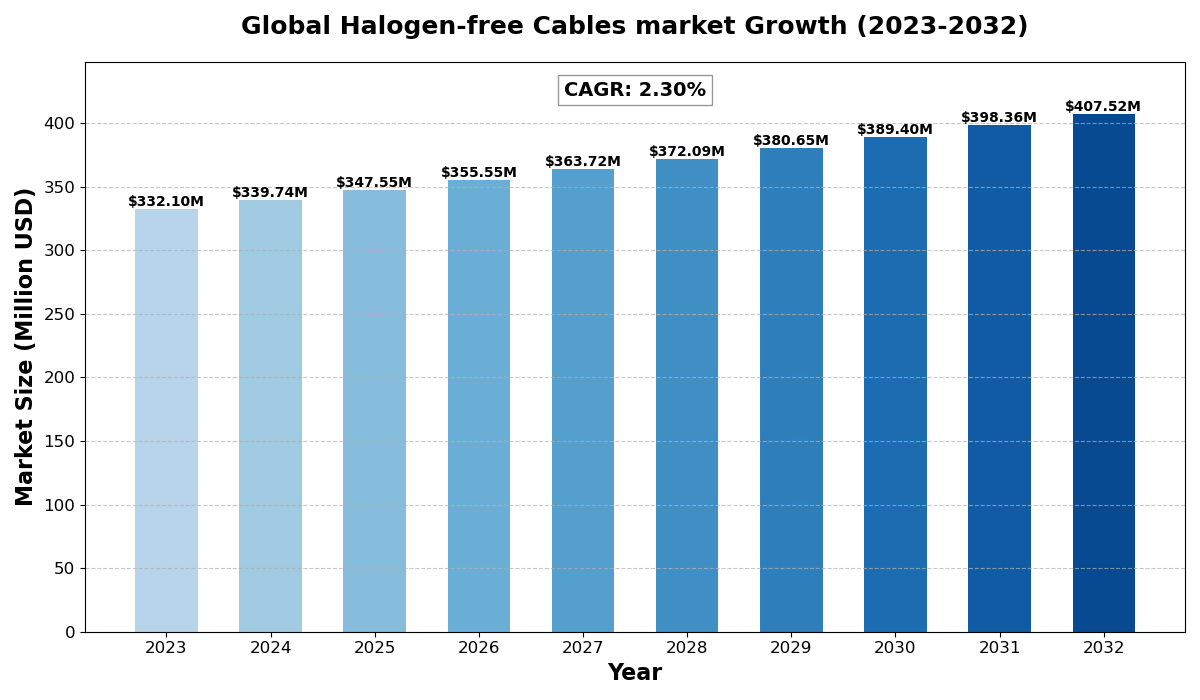
Halogen-free Cables Market Analysis:

The global Halogen-free Cables market size was estimated at USD 332.10 million in 2023 and is projected to reach USD 407.52 million by 2032, exhibiting a CAGR of 2.30% during the forecast period.

North America Halogen-free Cables market size was estimated at USD 89.98 million in 2023, at a CAGR of 1.97% during the forecast period of 2025 through 2032.

Halogen-free Cables Key Market Trends  

  1. Rising Demand for Fire-Safe and Low-Smoke Cables
    Halogen-free cables reduce toxic emissions and smoke generation, making them a preferred choice in safety-critical applications.

  2. Stringent Environmental and Fire Safety Regulations
    Governments and regulatory bodies worldwide are enforcing strict safety standards, boosting the adoption of halogen-free cables.

  3. Increasing Adoption in Data Centers and IT Infrastructure
    The rapid expansion of data centers is driving demand for low-smoke, halogen-free cables to ensure operational safety.

  4. Growing Use in Automotive and Transportation
    The automotive sector is increasingly using halogen-free cables in electric vehicles (EVs) and high-speed rail networks for enhanced safety.

  5. Advancements in Material Technologies
    Ongoing innovations in polymer compounds and flame-retardant materials are improving the performance and durability of halogen-free cables.

Halogen-free Cables Market Regional Analysis

semi insight

  • North America:Strong demand driven by EVs, 5G infrastructure, and renewable energy, with the U.S. leading the market.
  • Europe:Growth fueled by automotive electrification, renewable energy, and strong regulatory support, with Germany as a key player.
  • Asia-Pacific:Dominates the market due to large-scale manufacturing in China and Japan, with growing demand from EVs, 5G, and semiconductors.
  • South America:Emerging market, driven by renewable energy and EV adoption, with Brazil leading growth.
  • Middle East & Africa:Gradual growth, mainly due to investments in renewable energy and EV infrastructure, with Saudi Arabia and UAE as key contributors.

Halogen-free Cables Market Segmentation

The research report includes specific segments by region (country), manufacturers, Type, and Application. Market segmentation creates subsets of a market based on product type, end-user or application, Geographic, and other factors. By understanding the market segments, the decision-maker can leverage this targeting in the product, sales, and marketing strategies. Market segments can power your product development cycles by informing how you create product offerings for different segments.

Key Company

  • Prysmian Group
  • Nexans
  • Sumitomo Electric
  • LS Cable Group
  • GeneralCable
  • Furukawa Electric
  • Southwire
  • Fujikura
  • Walsin
  • Far East Holding
  • Hitachi Cable
  • SAB Cable

Market Segmentation (by Type)

  • Electric Cables
  • Submarine Cable
  • Solar Cable
  • Welding Cable
  • Borehole Cable
  • Others

Market Segmentation (by Application)

  • Electrical Infrastructure
  • Metallurgy and Petrochemical Industry
  • Railway
  • Automotive
  • Others

Drivers

  • Increasing Infrastructure Development and Smart Cities
    The rise in urbanization and smart city projects is fueling demand for fire-resistant and eco-friendly cables.

  • Expansion of Renewable Energy Projects
    Halogen-free cables are widely used in wind and solar power installations due to their safety and durability.

  • Rising Awareness of Environmental Sustainability
    Industries are shifting toward halogen-free materials to reduce environmental impact and improve workplace safety.

Restraints

  • Higher Cost Compared to Conventional Cables
    The production of halogen-free cables involves advanced materials, making them more expensive than traditional alternatives.

  • Limited Flexibility and Mechanical Strength
    Some halogen-free materials have lower flexibility and mechanical strength, which can limit their application in certain industries.

  • Compatibility Issues in Older Installations
    Retrofitting halogen-free cables into existing infrastructure can be challenging due to differences in material properties.

Opportunities

  • Growing Adoption in Electric Vehicles (EVs)
    The shift toward EVs is increasing the need for high-performance, flame-retardant cables in battery systems and power electronics.

  • Expansion of 5G and High-Speed Connectivity Networks
    The telecom industry’s demand for safer and more durable cables presents significant growth opportunities.

  • Development of Cost-Effective Halogen-Free Compounds
    Research into new flame-retardant materials and cost-efficient production techniques can enhance market penetration.

Challenges

  • Complex Manufacturing Process
    Producing halogen-free cables requires advanced processing techniques, increasing production complexity.

  • Market Competition from Traditional Cables
    Conventional PVC-insulated cables remain widely used due to their lower cost and established infrastructure.

  • Stringent Quality and Safety Standards
    Compliance with multiple regional and international safety regulations adds to the complexity of manufacturing and distribution.

Key Benefits of This Market Research:

  • Industry drivers, restraints, and opportunities covered in the study
  • Neutral perspective on the market performance
  • Recent industry trends and developments
  • Competitive landscape & strategies of key players
  • Potential & niche segments and regions exhibiting promising growth covered
  • Historical, current, and projected market size, in terms of value
  • In-depth analysis of the Halogen-free Cables Market
  • Overview of the regional outlook of the Halogen-free Cables Market:

Key Reasons to Buy this Report:

  • Access to date statistics compiled by our researchers. These provide you with historical and forecast data, which is analyzed to tell you why your market is set to change
  • This enables you to anticipate market changes to remain ahead of your competitors
  • You will be able to copy data from the Excel spreadsheet straight into your marketing plans, business presentations, or other strategic documents
  • The concise analysis, clear graph, and table format will enable you to pinpoint the information you require quickly
  • Provision of market value data for each segment and sub-segment
  • Indicates the region and segment that is expected to witness the fastest growth as well as to dominate the market
  • Provides insight into the market through Value Chain
  • Market dynamics scenario, along with growth opportunities of the market in the years to come
  • 6-month post-sales analyst support

Customization of the Report
In case of any queries or customization requirements, please connect with our sales team, who will ensure that your requirements are met.

FAQs

Q: What are the key driving factors and opportunities in the halogen-free cables market?
A: Growth in infrastructure, EV adoption, and renewable energy projects drive the market. Opportunities exist in telecom expansion and cost-effective material innovations.


Q: Which region is projected to have the largest market share?
A: Europe is expected to lead due to stringent fire safety regulations and high demand for sustainable cable solutions in industries like construction and automotive.


Q: Who are the top players in the global halogen-free cables market?
A: Key companies include Nexans, Prysmian Group, LS Cable & System, Leoni AG, and Sumitomo Electric Industries.


Q: What are the latest technological advancements in the industry?
A: Innovations include new flame-retardant polymers, improved manufacturing techniques, and higher-performance cable insulation materials.


Q: What is the current size of the global halogen-free cables market?
A: The market is projected to grow steadily from 2025 to 2032, driven by increasing safety regulations and demand for eco-friendly cable solutions.

Halogen-free Cables Market Trends,  Business Strategies 2025-2032

Get Sample Report PDF for Exclusive Insights

Report Sample Includes

  • Table of Contents
  • List of Tables & Figures
  • Charts, Research Methodology, and more...
PDF Icon Download Sample Report PDF

Download Sample Report

Table of Content

Table of Contents
1 Research Methodology and Statistical Scope
1.1 Market Definition and Statistical Scope of Halogen-free Cables
1.2 Key Market Segments
1.2.1 Halogen-free Cables Segment by Type
1.2.2 Halogen-free Cables Segment by Application
1.3 Methodology & Sources of Information
1.3.1 Research Methodology
1.3.2 Research Process
1.3.3 Market Breakdown and Data Triangulation
1.3.4 Base Year
1.3.5 Report Assumptions & Caveats
2 Halogen-free Cables Market Overview
2.1 Global Market Overview
2.1.1 Global Halogen-free Cables Market Size (M USD) Estimates and Forecasts (2019-2032)
2.1.2 Global Halogen-free Cables Sales Estimates and Forecasts (2019-2032)
2.2 Market Segment Executive Summary
2.3 Global Market Size by Region
3 Halogen-free Cables Market Competitive Landscape
3.1 Global Halogen-free Cables Sales by Manufacturers (2019-2025)
3.2 Global Halogen-free Cables Revenue Market Share by Manufacturers (2019-2025)
3.3 Halogen-free Cables Market Share by Company Type (Tier 1, Tier 2, and Tier 3)
3.4 Global Halogen-free Cables Average Price by Manufacturers (2019-2025)
3.5 Manufacturers Halogen-free Cables Sales Sites, Area Served, Product Type
3.6 Halogen-free Cables Market Competitive Situation and Trends
3.6.1 Halogen-free Cables Market Concentration Rate
3.6.2 Global 5 and 10 Largest Halogen-free Cables Players Market Share by Revenue
3.6.3 Mergers & Acquisitions, Expansion
4 Halogen-free Cables Industry Chain Analysis
4.1 Halogen-free Cables Industry Chain Analysis
4.2 Market Overview of Key Raw Materials
4.3 Midstream Market Analysis
4.4 Downstream Customer Analysis
5 The Development and Dynamics of Halogen-free Cables Market
5.1 Key Development Trends
5.2 Driving Factors
5.3 Market Challenges
5.4 Market Restraints
5.5 Industry News
5.5.1 New Product Developments
5.5.2 Mergers & Acquisitions
5.5.3 Expansions
5.5.4 Collaboration/Supply Contracts
5.6 Industry Policies
6 Halogen-free Cables Market Segmentation by Type
6.1 Evaluation Matrix of Segment Market Development Potential (Type)
6.2 Global Halogen-free Cables Sales Market Share by Type (2019-2025)
6.3 Global Halogen-free Cables Market Size Market Share by Type (2019-2025)
6.4 Global Halogen-free Cables Price by Type (2019-2025)
7 Halogen-free Cables Market Segmentation by Application
7.1 Evaluation Matrix of Segment Market Development Potential (Application)
7.2 Global Halogen-free Cables Market Sales by Application (2019-2025)
7.3 Global Halogen-free Cables Market Size (M USD) by Application (2019-2025)
7.4 Global Halogen-free Cables Sales Growth Rate by Application (2019-2025)
8 Halogen-free Cables Market Consumption by Region
8.1 Global Halogen-free Cables Sales by Region
8.1.1 Global Halogen-free Cables Sales by Region
8.1.2 Global Halogen-free Cables Sales Market Share by Region
8.2 North America
8.2.1 North America Halogen-free Cables Sales by Country
8.2.2 U.S.
8.2.3 Canada
8.2.4 Mexico
8.3 Europe
8.3.1 Europe Halogen-free Cables Sales by Country
8.3.2 Germany
8.3.3 France
8.3.4 U.K.
8.3.5 Italy
8.3.6 Russia
8.4 Asia Pacific
8.4.1 Asia Pacific Halogen-free Cables Sales by Region
8.4.2 China
8.4.3 Japan
8.4.4 South Korea
8.4.5 India
8.4.6 Southeast Asia
8.5 South America
8.5.1 South America Halogen-free Cables Sales by Country
8.5.2 Brazil
8.5.3 Argentina
8.5.4 Columbia
8.6 Middle East and Africa
8.6.1 Middle East and Africa Halogen-free Cables Sales by Region
8.6.2 Saudi Arabia
8.6.3 UAE
8.6.4 Egypt
8.6.5 Nigeria
8.6.6 South Africa
9 Halogen-free Cables Market Production by Region
9.1 Global Production of Halogen-free Cables by Region (2019-2025)
9.2 Global Halogen-free Cables Revenue Market Share by Region (2019-2025)
9.3 Global Halogen-free Cables Production, Revenue, Price and Gross Margin (2019-2025)
9.4 North America Halogen-free Cables Production
9.4.1 North America Halogen-free Cables Production Growth Rate (2019-2025)
9.4.2 North America Halogen-free Cables Production, Revenue, Price and Gross Margin (2019-2025)
9.5 Europe Halogen-free Cables Production
9.5.1 Europe Halogen-free Cables Production Growth Rate (2019-2025)
9.5.2 Europe Halogen-free Cables Production, Revenue, Price and Gross Margin (2019-2025)
9.6 Japan Halogen-free Cables Production (2019-2025)
9.6.1 Japan Halogen-free Cables Production Growth Rate (2019-2025)
9.6.2 Japan Halogen-free Cables Production, Revenue, Price and Gross Margin (2019-2025)
9.7 China Halogen-free Cables Production (2019-2025)
9.7.1 China Halogen-free Cables Production Growth Rate (2019-2025)
9.7.2 China Halogen-free Cables Production, Revenue, Price and Gross Margin (2019-2025)
10 Key Companies Profile
10.1 Prysmian Group
10.1.1 Prysmian Group Halogen-free Cables Basic Information
10.1.2 Prysmian Group Halogen-free Cables Product Overview
10.1.3 Prysmian Group Halogen-free Cables Product Market Performance
10.1.4 Prysmian Group Business Overview
10.1.5 Prysmian Group Halogen-free Cables SWOT Analysis
10.1.6 Prysmian Group Recent Developments
10.2 Nexans
10.2.1 Nexans Halogen-free Cables Basic Information
10.2.2 Nexans Halogen-free Cables Product Overview
10.2.3 Nexans Halogen-free Cables Product Market Performance
10.2.4 Nexans Business Overview
10.2.5 Nexans Halogen-free Cables SWOT Analysis
10.2.6 Nexans Recent Developments
10.3 Sumitomo Electric
10.3.1 Sumitomo Electric Halogen-free Cables Basic Information
10.3.2 Sumitomo Electric Halogen-free Cables Product Overview
10.3.3 Sumitomo Electric Halogen-free Cables Product Market Performance
10.3.4 Sumitomo Electric Halogen-free Cables SWOT Analysis
10.3.5 Sumitomo Electric Business Overview
10.3.6 Sumitomo Electric Recent Developments
10.4 LS Cable Group
10.4.1 LS Cable Group Halogen-free Cables Basic Information
10.4.2 LS Cable Group Halogen-free Cables Product Overview
10.4.3 LS Cable Group Halogen-free Cables Product Market Performance
10.4.4 LS Cable Group Business Overview
10.4.5 LS Cable Group Recent Developments
10.5 GeneralCable
10.5.1 GeneralCable Halogen-free Cables Basic Information
10.5.2 GeneralCable Halogen-free Cables Product Overview
10.5.3 GeneralCable Halogen-free Cables Product Market Performance
10.5.4 GeneralCable Business Overview
10.5.5 GeneralCable Recent Developments
10.6 Furukawa Electric
10.6.1 Furukawa Electric Halogen-free Cables Basic Information
10.6.2 Furukawa Electric Halogen-free Cables Product Overview
10.6.3 Furukawa Electric Halogen-free Cables Product Market Performance
10.6.4 Furukawa Electric Business Overview
10.6.5 Furukawa Electric Recent Developments
10.7 Southwire
10.7.1 Southwire Halogen-free Cables Basic Information
10.7.2 Southwire Halogen-free Cables Product Overview
10.7.3 Southwire Halogen-free Cables Product Market Performance
10.7.4 Southwire Business Overview
10.7.5 Southwire Recent Developments
10.8 Fujikura
10.8.1 Fujikura Halogen-free Cables Basic Information
10.8.2 Fujikura Halogen-free Cables Product Overview
10.8.3 Fujikura Halogen-free Cables Product Market Performance
10.8.4 Fujikura Business Overview
10.8.5 Fujikura Recent Developments
10.9 Walsin
10.9.1 Walsin Halogen-free Cables Basic Information
10.9.2 Walsin Halogen-free Cables Product Overview
10.9.3 Walsin Halogen-free Cables Product Market Performance
10.9.4 Walsin Business Overview
10.9.5 Walsin Recent Developments
10.10 Far East Holding
10.10.1 Far East Holding Halogen-free Cables Basic Information
10.10.2 Far East Holding Halogen-free Cables Product Overview
10.10.3 Far East Holding Halogen-free Cables Product Market Performance
10.10.4 Far East Holding Business Overview
10.10.5 Far East Holding Recent Developments
10.11 Hitachi Cable
10.11.1 Hitachi Cable Halogen-free Cables Basic Information
10.11.2 Hitachi Cable Halogen-free Cables Product Overview
10.11.3 Hitachi Cable Halogen-free Cables Product Market Performance
10.11.4 Hitachi Cable Business Overview
10.11.5 Hitachi Cable Recent Developments
10.12 SAB Cable
10.12.1 SAB Cable Halogen-free Cables Basic Information
10.12.2 SAB Cable Halogen-free Cables Product Overview
10.12.3 SAB Cable Halogen-free Cables Product Market Performance
10.12.4 SAB Cable Business Overview
10.12.5 SAB Cable Recent Developments
11 Halogen-free Cables Market Forecast by Region
11.1 Global Halogen-free Cables Market Size Forecast
11.2 Global Halogen-free Cables Market Forecast by Region
11.2.1 North America Market Size Forecast by Country
11.2.2 Europe Halogen-free Cables Market Size Forecast by Country
11.2.3 Asia Pacific Halogen-free Cables Market Size Forecast by Region
11.2.4 South America Halogen-free Cables Market Size Forecast by Country
11.2.5 Middle East and Africa Forecasted Consumption of Halogen-free Cables by Country
12 Forecast Market by Type and by Application (2025-2032)
12.1 Global Halogen-free Cables Market Forecast by Type (2025-2032)
12.1.1 Global Forecasted Sales of Halogen-free Cables by Type (2025-2032)
12.1.2 Global Halogen-free Cables Market Size Forecast by Type (2025-2032)
12.1.3 Global Forecasted Price of Halogen-free Cables by Type (2025-2032)
12.2 Global Halogen-free Cables Market Forecast by Application (2025-2032)
12.2.1 Global Halogen-free Cables Sales (K Units) Forecast by Application
12.2.2 Global Halogen-free Cables Market Size (M USD) Forecast by Application (2025-2032)
13 Conclusion and Key FindingsList of Tables
Table 1. Introduction of the Type
Table 2. Introduction of the Application
Table 3. Market Size (M USD) Segment Executive Summary
Table 4. Halogen-free Cables Market Size Comparison by Region (M USD)
Table 5. Global Halogen-free Cables Sales (K Units) by Manufacturers (2019-2025)
Table 6. Global Halogen-free Cables Sales Market Share by Manufacturers (2019-2025)
Table 7. Global Halogen-free Cables Revenue (M USD) by Manufacturers (2019-2025)
Table 8. Global Halogen-free Cables Revenue Share by Manufacturers (2019-2025)
Table 9. Company Type (Tier 1, Tier 2, and Tier 3) & (based on the Revenue in Halogen-free Cables as of 2022)
Table 10. Global Market Halogen-free Cables Average Price (USD/Unit) of Key Manufacturers (2019-2025)
Table 11. Manufacturers Halogen-free Cables Sales Sites and Area Served
Table 12. Manufacturers Halogen-free Cables Product Type
Table 13. Global Halogen-free Cables Manufacturers Market Concentration Ratio (CR5 and HHI)
Table 14. Mergers & Acquisitions, Expansion Plans
Table 15. Industry Chain Map of Halogen-free Cables
Table 16. Market Overview of Key Raw Materials
Table 17. Midstream Market Analysis
Table 18. Downstream Customer Analysis
Table 19. Key Development Trends
Table 20. Driving Factors
Table 21. Halogen-free Cables Market Challenges
Table 22. Global Halogen-free Cables Sales by Type (K Units)
Table 23. Global Halogen-free Cables Market Size by Type (M USD)
Table 24. Global Halogen-free Cables Sales (K Units) by Type (2019-2025)
Table 25. Global Halogen-free Cables Sales Market Share by Type (2019-2025)
Table 26. Global Halogen-free Cables Market Size (M USD) by Type (2019-2025)
Table 27. Global Halogen-free Cables Market Size Share by Type (2019-2025)
Table 28. Global Halogen-free Cables Price (USD/Unit) by Type (2019-2025)
Table 29. Global Halogen-free Cables Sales (K Units) by Application
Table 30. Global Halogen-free Cables Market Size by Application
Table 31. Global Halogen-free Cables Sales by Application (2019-2025) & (K Units)
Table 32. Global Halogen-free Cables Sales Market Share by Application (2019-2025)
Table 33. Global Halogen-free Cables Sales by Application (2019-2025) & (M USD)
Table 34. Global Halogen-free Cables Market Share by Application (2019-2025)
Table 35. Global Halogen-free Cables Sales Growth Rate by Application (2019-2025)
Table 36. Global Halogen-free Cables Sales by Region (2019-2025) & (K Units)
Table 37. Global Halogen-free Cables Sales Market Share by Region (2019-2025)
Table 38. North America Halogen-free Cables Sales by Country (2019-2025) & (K Units)
Table 39. Europe Halogen-free Cables Sales by Country (2019-2025) & (K Units)
Table 40. Asia Pacific Halogen-free Cables Sales by Region (2019-2025) & (K Units)
Table 41. South America Halogen-free Cables Sales by Country (2019-2025) & (K Units)
Table 42. Middle East and Africa Halogen-free Cables Sales by Region (2019-2025) & (K Units)
Table 43. Global Halogen-free Cables Production (K Units) by Region (2019-2025)
Table 44. Global Halogen-free Cables Revenue (US$ Million) by Region (2019-2025)
Table 45. Global Halogen-free Cables Revenue Market Share by Region (2019-2025)
Table 46. Global Halogen-free Cables Production (K Units), Revenue (US$ Million), Price (USD/Unit) and Gross Margin (2019-2025)
Table 47. North America Halogen-free Cables Production (K Units), Revenue (US$ Million), Price (USD/Unit) and Gross Margin (2019-2025)
Table 48. Europe Halogen-free Cables Production (K Units), Revenue (US$ Million), Price (USD/Unit) and Gross Margin (2019-2025)
Table 49. Japan Halogen-free Cables Production (K Units), Revenue (US$ Million), Price (USD/Unit) and Gross Margin (2019-2025)
Table 50. China Halogen-free Cables Production (K Units), Revenue (US$ Million), Price (USD/Unit) and Gross Margin (2019-2025)
Table 51. Prysmian Group Halogen-free Cables Basic Information
Table 52. Prysmian Group Halogen-free Cables Product Overview
Table 53. Prysmian Group Halogen-free Cables Sales (K Units), Revenue (M USD), Price (USD/Unit) and Gross Margin (2019-2025)
Table 54. Prysmian Group Business Overview
Table 55. Prysmian Group Halogen-free Cables SWOT Analysis
Table 56. Prysmian Group Recent Developments
Table 57. Nexans Halogen-free Cables Basic Information
Table 58. Nexans Halogen-free Cables Product Overview
Table 59. Nexans Halogen-free Cables Sales (K Units), Revenue (M USD), Price (USD/Unit) and Gross Margin (2019-2025)
Table 60. Nexans Business Overview
Table 61. Nexans Halogen-free Cables SWOT Analysis
Table 62. Nexans Recent Developments
Table 63. Sumitomo Electric Halogen-free Cables Basic Information
Table 64. Sumitomo Electric Halogen-free Cables Product Overview
Table 65. Sumitomo Electric Halogen-free Cables Sales (K Units), Revenue (M USD), Price (USD/Unit) and Gross Margin (2019-2025)
Table 66. Sumitomo Electric Halogen-free Cables SWOT Analysis
Table 67. Sumitomo Electric Business Overview
Table 68. Sumitomo Electric Recent Developments
Table 69. LS Cable Group Halogen-free Cables Basic Information
Table 70. LS Cable Group Halogen-free Cables Product Overview
Table 71. LS Cable Group Halogen-free Cables Sales (K Units), Revenue (M USD), Price (USD/Unit) and Gross Margin (2019-2025)
Table 72. LS Cable Group Business Overview
Table 73. LS Cable Group Recent Developments
Table 74. GeneralCable Halogen-free Cables Basic Information
Table 75. GeneralCable Halogen-free Cables Product Overview
Table 76. GeneralCable Halogen-free Cables Sales (K Units), Revenue (M USD), Price (USD/Unit) and Gross Margin (2019-2025)
Table 77. GeneralCable Business Overview
Table 78. GeneralCable Recent Developments
Table 79. Furukawa Electric Halogen-free Cables Basic Information
Table 80. Furukawa Electric Halogen-free Cables Product Overview
Table 81. Furukawa Electric Halogen-free Cables Sales (K Units), Revenue (M USD), Price (USD/Unit) and Gross Margin (2019-2025)
Table 82. Furukawa Electric Business Overview
Table 83. Furukawa Electric Recent Developments
Table 84. Southwire Halogen-free Cables Basic Information
Table 85. Southwire Halogen-free Cables Product Overview
Table 86. Southwire Halogen-free Cables Sales (K Units), Revenue (M USD), Price (USD/Unit) and Gross Margin (2019-2025)
Table 87. Southwire Business Overview
Table 88. Southwire Recent Developments
Table 89. Fujikura Halogen-free Cables Basic Information
Table 90. Fujikura Halogen-free Cables Product Overview
Table 91. Fujikura Halogen-free Cables Sales (K Units), Revenue (M USD), Price (USD/Unit) and Gross Margin (2019-2025)
Table 92. Fujikura Business Overview
Table 93. Fujikura Recent Developments
Table 94. Walsin Halogen-free Cables Basic Information
Table 95. Walsin Halogen-free Cables Product Overview
Table 96. Walsin Halogen-free Cables Sales (K Units), Revenue (M USD), Price (USD/Unit) and Gross Margin (2019-2025)
Table 97. Walsin Business Overview
Table 98. Walsin Recent Developments
Table 99. Far East Holding Halogen-free Cables Basic Information
Table 100. Far East Holding Halogen-free Cables Product Overview
Table 101. Far East Holding Halogen-free Cables Sales (K Units), Revenue (M USD), Price (USD/Unit) and Gross Margin (2019-2025)
Table 102. Far East Holding Business Overview
Table 103. Far East Holding Recent Developments
Table 104. Hitachi Cable Halogen-free Cables Basic Information
Table 105. Hitachi Cable Halogen-free Cables Product Overview
Table 106. Hitachi Cable Halogen-free Cables Sales (K Units), Revenue (M USD), Price (USD/Unit) and Gross Margin (2019-2025)
Table 107. Hitachi Cable Business Overview
Table 108. Hitachi Cable Recent Developments
Table 109. SAB Cable Halogen-free Cables Basic Information
Table 110. SAB Cable Halogen-free Cables Product Overview
Table 111. SAB Cable Halogen-free Cables Sales (K Units), Revenue (M USD), Price (USD/Unit) and Gross Margin (2019-2025)
Table 112. SAB Cable Business Overview
Table 113. SAB Cable Recent Developments
Table 114. Global Halogen-free Cables Sales Forecast by Region (2025-2032) & (K Units)
Table 115. Global Halogen-free Cables Market Size Forecast by Region (2025-2032) & (M USD)
Table 116. North America Halogen-free Cables Sales Forecast by Country (2025-2032) & (K Units)
Table 117. North America Halogen-free Cables Market Size Forecast by Country (2025-2032) & (M USD)
Table 118. Europe Halogen-free Cables Sales Forecast by Country (2025-2032) & (K Units)
Table 119. Europe Halogen-free Cables Market Size Forecast by Country (2025-2032) & (M USD)
Table 120. Asia Pacific Halogen-free Cables Sales Forecast by Region (2025-2032) & (K Units)
Table 121. Asia Pacific Halogen-free Cables Market Size Forecast by Region (2025-2032) & (M USD)
Table 122. South America Halogen-free Cables Sales Forecast by Country (2025-2032) & (K Units)
Table 123. South America Halogen-free Cables Market Size Forecast by Country (2025-2032) & (M USD)
Table 124. Middle East and Africa Halogen-free Cables Consumption Forecast by Country (2025-2032) & (Units)
Table 125. Middle East and Africa Halogen-free Cables Market Size Forecast by Country (2025-2032) & (M USD)
Table 126. Global Halogen-free Cables Sales Forecast by Type (2025-2032) & (K Units)
Table 127. Global Halogen-free Cables Market Size Forecast by Type (2025-2032) & (M USD)
Table 128. Global Halogen-free Cables Price Forecast by Type (2025-2032) & (USD/Unit)
Table 129. Global Halogen-free Cables Sales (K Units) Forecast by Application (2025-2032)
Table 130. Global Halogen-free Cables Market Size Forecast by Application (2025-2032) & (M USD)
List of Figures
Figure 1. Product Picture of Halogen-free Cables
Figure 2. Data Triangulation
Figure 3. Key Caveats
Figure 4. Global Halogen-free Cables Market Size (M USD), 2019-2032
Figure 5. Global Halogen-free Cables Market Size (M USD) (2019-2032)
Figure 6. Global Halogen-free Cables Sales (K Units) & (2019-2032)
Figure 7. Evaluation Matrix of Segment Market Development Potential (Type)
Figure 8. Evaluation Matrix of Segment Market Development Potential (Application)
Figure 9. Evaluation Matrix of Regional Market Development Potential
Figure 10. Halogen-free Cables Market Size by Country (M USD)
Figure 11. Halogen-free Cables Sales Share by Manufacturers in 2023
Figure 12. Global Halogen-free Cables Revenue Share by Manufacturers in 2023
Figure 13. Halogen-free Cables Market Share by Company Type (Tier 1, Tier 2 and Tier 3): 2023
Figure 14. Global Market Halogen-free Cables Average Price (USD/Unit) of Key Manufacturers in 2023
Figure 15. The Global 5 and 10 Largest Players: Market Share by Halogen-free Cables Revenue in 2023
Figure 16. Evaluation Matrix of Segment Market Development Potential (Type)
Figure 17. Global Halogen-free Cables Market Share by Type
Figure 18. Sales Market Share of Halogen-free Cables by Type (2019-2025)
Figure 19. Sales Market Share of Halogen-free Cables by Type in 2023
Figure 20. Market Size Share of Halogen-free Cables by Type (2019-2025)
Figure 21. Market Size Market Share of Halogen-free Cables by Type in 2023
Figure 22. Evaluation Matrix of Segment Market Development Potential (Application)
Figure 23. Global Halogen-free Cables Market Share by Application
Figure 24. Global Halogen-free Cables Sales Market Share by Application (2019-2025)
Figure 25. Global Halogen-free Cables Sales Market Share by Application in 2023
Figure 26. Global Halogen-free Cables Market Share by Application (2019-2025)
Figure 27. Global Halogen-free Cables Market Share by Application in 2023
Figure 28. Global Halogen-free Cables Sales Growth Rate by Application (2019-2025)
Figure 29. Global Halogen-free Cables Sales Market Share by Region (2019-2025)
Figure 30. North America Halogen-free Cables Sales and Growth Rate (2019-2025) & (K Units)
Figure 31. North America Halogen-free Cables Sales Market Share by Country in 2023
Figure 32. U.S. Halogen-free Cables Sales and Growth Rate (2019-2025) & (K Units)
Figure 33. Canada Halogen-free Cables Sales (K Units) and Growth Rate (2019-2025)
Figure 34. Mexico Halogen-free Cables Sales (Units) and Growth Rate (2019-2025)
Figure 35. Europe Halogen-free Cables Sales and Growth Rate (2019-2025) & (K Units)
Figure 36. Europe Halogen-free Cables Sales Market Share by Country in 2023
Figure 37. Germany Halogen-free Cables Sales and Growth Rate (2019-2025) & (K Units)
Figure 38. France Halogen-free Cables Sales and Growth Rate (2019-2025) & (K Units)
Figure 39. U.K. Halogen-free Cables Sales and Growth Rate (2019-2025) & (K Units)
Figure 40. Italy Halogen-free Cables Sales and Growth Rate (2019-2025) & (K Units)
Figure 41. Russia Halogen-free Cables Sales and Growth Rate (2019-2025) & (K Units)
Figure 42. Asia Pacific Halogen-free Cables Sales and Growth Rate (K Units)
Figure 43. Asia Pacific Halogen-free Cables Sales Market Share by Region in 2023
Figure 44. China Halogen-free Cables Sales and Growth Rate (2019-2025) & (K Units)
Figure 45. Japan Halogen-free Cables Sales and Growth Rate (2019-2025) & (K Units)
Figure 46. South Korea Halogen-free Cables Sales and Growth Rate (2019-2025) & (K Units)
Figure 47. India Halogen-free Cables Sales and Growth Rate (2019-2025) & (K Units)
Figure 48. Southeast Asia Halogen-free Cables Sales and Growth Rate (2019-2025) & (K Units)
Figure 49. South America Halogen-free Cables Sales and Growth Rate (K Units)
Figure 50. South America Halogen-free Cables Sales Market Share by Country in 2023
Figure 51. Brazil Halogen-free Cables Sales and Growth Rate (2019-2025) & (K Units)
Figure 52. Argentina Halogen-free Cables Sales and Growth Rate (2019-2025) & (K Units)
Figure 53. Columbia Halogen-free Cables Sales and Growth Rate (2019-2025) & (K Units)
Figure 54. Middle East and Africa Halogen-free Cables Sales and Growth Rate (K Units)
Figure 55. Middle East and Africa Halogen-free Cables Sales Market Share by Region in 2023
Figure 56. Saudi Arabia Halogen-free Cables Sales and Growth Rate (2019-2025) & (K Units)
Figure 57. UAE Halogen-free Cables Sales and Growth Rate (2019-2025) & (K Units)
Figure 58. Egypt Halogen-free Cables Sales and Growth Rate (2019-2025) & (K Units)
Figure 59. Nigeria Halogen-free Cables Sales and Growth Rate (2019-2025) & (K Units)
Figure 60. South Africa Halogen-free Cables Sales and Growth Rate (2019-2025) & (K Units)
Figure 61. Global Halogen-free Cables Production Market Share by Region (2019-2025)
Figure 62. North America Halogen-free Cables Production (K Units) Growth Rate (2019-2025)
Figure 63. Europe Halogen-free Cables Production (K Units) Growth Rate (2019-2025)
Figure 64. Japan Halogen-free Cables Production (K Units) Growth Rate (2019-2025)
Figure 65. China Halogen-free Cables Production (K Units) Growth Rate (2019-2025)
Figure 66. Global Halogen-free Cables Sales Forecast by Volume (2019-2032) & (K Units)
Figure 67. Global Halogen-free Cables Market Size Forecast by Value (2019-2032) & (M USD)
Figure 68. Global Halogen-free Cables Sales Market Share Forecast by Type (2025-2032)
Figure 69. Global Halogen-free Cables Market Share Forecast by Type (2025-2032)
Figure 70. Global Halogen-free Cables Sales Forecast by Application (2025-2032)
Figure 71. Global Halogen-free Cables Market Share Forecast by Application (2025-2032)