Graphics Add-in Board (AIB) Market Size, Share, Trends, Market Growth and Forecast 2026-2034

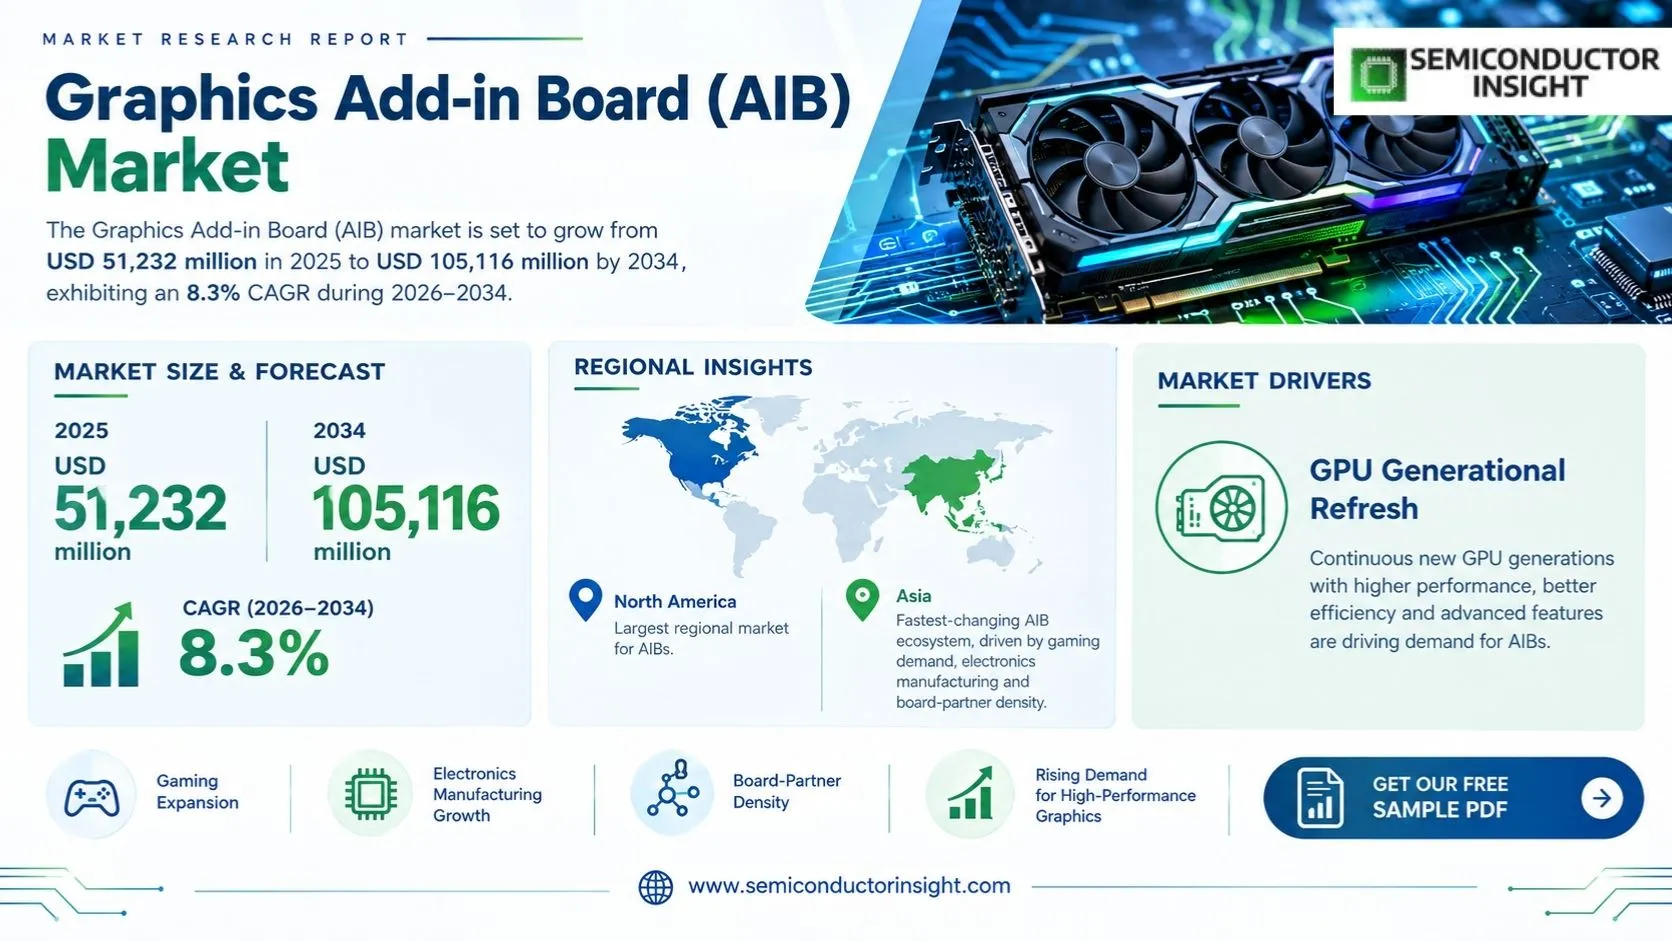
Graphics Add-in Board (AIB) market is USD 51,232 million in 2025 and USD 105,116 million by 2034, implying an 8.3% CAGR for 2026–2034.

PDF Icon Download Sample Report PDF
  • Quick Dispatch

    All Orders

  • Secure Payment

    100% Secure Payment

Price range: $1,500.00 through $4,250.00

Clear

Key Statistics

2025 Market Size
USD 51,232 million
2034 Projected Size
USD 105,116 million
CAGR (2026–2034)
8.3%
Largest Market in 2025
North America

Key Takeaways

  • USD 51,232 million in 2025 and 8.3% CAGR. AIB demand is supported by GPU refreshes, gaming, creator workloads and local AI acceleration.
  • Discrete boards remain the market anchor. Dedicated memory, higher throughput and specialized acceleration preserve the clearest value gap over integrated graphics.
  • Gaming stays broad; AI is reshaping product value. NVIDIA, AMD and Intel increasingly position desktop GPUs around neural rendering, AI acceleration and creator workflows.
  • North America leads while Asia changes fastest. Mature upgrade channels in North America contrast with Asia’s manufacturing density, gaming growth and aggressive price competition.
  • Cooling and power engineering are now strategic differentiators. Multiple board designs can share one GPU, so thermal execution and channel timing increasingly determine product competitiveness.

Graphics Add-in Board (AIB) Market Overview

Graphics Add-in Board (AIB) market is USD 51,232 million in 2025 and USD 105,116 million by 2034, implying an 8.3% CAGR for 2026–2034. North America is the largest regional context in the supplied scope, while Asia is the fastest-changing because gaming, PC manufacturing, creator workloads and AI acceleration converge in the same ecosystem.

Base year: 2025 · Forecast period: 2026–2034 · Historical data: 2020–2024 · Values in USD million unless otherwise stated; power, memory and price use manufacturer units.

An AIB is a dedicated graphics board containing a GPU, graphics memory, power-delivery circuitry, PCB, cooling and display connectivity. It is purchased when dedicated graphics performance or memory delivers a material advantage over integrated graphics. Board partners create the physical product around a shared GPU platform, so the market is shaped by both semiconductor architecture and board engineering. Cooler design, PCB layout, voltage regulation, acoustics, firmware, dimensions and warranty support determine the user experience and the manufacturer’s margin.

The technology direction is shifting from pure raster performance toward AI-assisted rendering, ray tracing, frame generation and local inference. NVIDIA’s RTX 50 family uses fifth-generation Tensor Cores and fourth-generation ray-tracing cores, AMD’s RX 9000 family adds AI accelerators, and Intel’s Arc B-Series integrates XMX AI engines. The effect is a broader workload proposition: the same dedicated GPU can support gaming, image generation, video processing, professional visualization and selected enterprise or edge AI workloads.

AIB demand is also tightly coupled to GPU generation timing. When a new architecture launches, multiple board partners release their own versions, creating a concentrated demand window and a rapid transition from one product generation to the next. Suppliers therefore need early GPU allocations, graphics-memory supply, PCB capacity, cooler production, validation and channel inventory. A strong board manufacturer is not simply a contract assembler; it synchronizes semiconductor availability, mechanical engineering, thermals, pricing and retail timing around every GPU generation.

Segment Analysis: By Type

The supplied type segmentation contains discrete and integrated graphics. Discrete boards are the core AIB product because they use dedicated memory and independent board-level power and cooling. Integrated graphics remain the most important substitute because they can satisfy mainstream workloads without a separate card. The result is a market in which AIB suppliers must continuously prove that the additional hardware cost delivers a meaningful performance, memory, AI or feature advantage.

Type Function / Definition Market position / demand characteristics
Discrete Discrete boards place a dedicated GPU, graphics memory and supporting circuitry on a separate PCB. They are used when compute throughput, dedicated memory bandwidth, rendering quality or specialized acceleration exceeds what integrated graphics can provide. They also offer upgradeability in desktop systems, which creates an aftermarket channel that does not depend on complete PC replacement. Board partners differentiate the physical implementation even when the GPU source is shared. Largest structural segment. Discrete boards serve gaming, creators, workstations and increasingly local AI. The commercial advantage is a clear performance or feature gap that users can observe, while manufacturers compete through cooling, power delivery, acoustics, factory tuning and industrial design. Demand is strongest when a new GPU generation creates a visible uplift, but profitability depends on matching the board specification to the GPU power envelope and target price tier.
Integrated Integrated graphics place graphics capability inside a processor or system-on-chip and use shared system resources. They reduce system cost, board complexity, power consumption and physical footprint, making them attractive for mainstream PCs and mobile products. Although they are not themselves AIBs, their performance improvement changes the addressable market by eliminating the need for a separate card in more use cases. This substitution is strongest in entry-level and space-constrained systems. Integrated graphics create persistent pressure on entry-level AIB demand. The commercial response is to emphasize dedicated memory, higher throughput, specialized AI acceleration, better display support and stronger gaming performance. AIB suppliers must therefore maintain a visible value gap rather than rely on generic graphics capability. The market implication is a polarization toward products that clearly outperform integrated solutions and toward premium boards where users value capability more than minimum system cost.

Specification differentiation

Board-level differentiation is now a central source of value. NVIDIA’s RTX 50 family spans seven desktop models in the current product comparison, from RTX 5090 through RTX 5050, while individual board partners release several physical designs around a GPU. The RTX 5090 is specified with 32GB of GDDR7, a 512-bit interface and 1,792GB/s bandwidth, while lower models use different memory capacities and interfaces. This variation creates room for board partners to optimize products for premium, mainstream, compact, quiet or value-focused customers.

Cooling and power delivery are increasingly decisive because high-performance boards can operate at power levels above 300W. Heat sinks, vapor chambers, heat pipes, fan design, PCB thickness, VRM components and power connectors all affect sustained performance and chassis compatibility. GIGABYTE’s 2026 AORUS RTX 50 INFINITY series explicitly emphasizes its WINDFORCE HYPERBURST and Double Flow Through architecture, illustrating how board engineering can become a product feature in its own right. The market implication is that a GPU supplier does not fully determine the final AIB value proposition; the board partner still controls the physical execution.

Segment Analysis: By Application

The supplied application segmentation contains desktops, notebooks and tablets, workstations and others. Desktop systems remain the strongest interchangeable AIB channel because users can upgrade the graphics board independently. Workstations create high-value professional demand, while notebooks and tablets influence the market mainly through substitution because their graphics are generally integrated or soldered rather than retail-upgradeable. Specialized systems create project-driven demand where form factor, reliability and customization can outweigh volume.

Application Demand characteristics
Desktops Desktops are the core AIB application because they provide room for dedicated graphics boards, auxiliary power and larger cooling systems. Demand is triggered by gaming upgrades, new PC builds, creator workloads and enthusiast refresh cycles. Board partners can release multiple variants around the same GPU, from compact models to premium overclocked designs, creating a broad aftermarket. The commercial implication is that launch timing and channel inventory can materially affect sales around 2025–2034 GPU cycles.
Notebooks and Tablets Mobile systems use integrated graphics or soldered discrete GPUs rather than interchangeable AIBs. Their importance is therefore indirect: stronger mobile graphics raises the minimum performance that an entry-level desktop card must exceed. OEM platforms also impose tighter thermal and power budgets, so technology development in mobile GPUs influences efficiency expectations for desktop boards. AIB vendors benefit when they can translate performance-per-watt improvements into quieter, smaller desktop products without giving up too much performance.
Workstations Workstations use graphics hardware in CAD, simulation, 3D content creation, visualization, scientific workloads and local AI. Buyers emphasize driver stability, application certification, memory capacity, long availability and predictable performance. The segment can therefore support premium economics even at lower volume. Board and system suppliers compete by combining hardware with validated software support and lifecycle commitments, creating a market that is commercially distinct from consumer gaming despite using related GPU architectures.
Others Specialized applications include edge visualization, industrial systems and other project-based computing uses where form factor or workload requirements differ from mainstream desktop gaming. Purchasers may specify short cards, low-power configurations, unusual connectors or long support periods. Suppliers with flexible engineering and validation can win these programmes even when volumes are modest. The commercial value comes from customization and qualification, not from the sheer number of cards shipped in one product cycle.

Graphics Add-in Board (AIB) Market Size & Share
Regional Analysis

North America is the largest regional context in the supplied scope, while Asia represents the fastest-changing AIB ecosystem because gaming demand, electronics manufacturing and board-partner density are concentrated there. Europe is more specification and efficiency conscious, while South America and Middle East & Africa are more sensitive to landed cost, distribution and support. The same GPU generation therefore creates different commercial opportunities by region even when the underlying silicon is identical.

How do AIB purchasing mechanisms differ across regions?

AIB buyers evaluate the same GPU family through different commercial filters. North American users emphasize upgrade cycles, performance and premium channel availability; European customers place greater weight on acoustics, efficiency and compliance; Asian markets combine very large gaming demand with manufacturing density and aggressive price competition; and emerging regions rely more heavily on import economics and distributor inventory. Board partners therefore need regional SKU, pricing and distribution strategies even when the GPU architecture is global.

Region Position Growth outlook Demand profile What decides supplier selection
North America Largest High refresh intensity Gaming, creators, workstations, local AI Channel breadth, launch timing, brand, cooling and software support.
Europe High specification Steady Gaming, creator, professional Efficiency, acoustics, compliance, documentation and distribution.
Asia Fastest-changing High Gaming, PC building, creators, AI Cost, board variety, manufacturing access and channel reach.
South America Developing Steady Gaming and creators Landed cost, currencies, inventory and distributor coverage.
Middle East & Africa Emerging Project and gaming led Premium Gulf, price-sensitive Africa Service, warranty, thermal performance and reliable local channels.
North America LARGEST

Why does North America remain the leading AIB market context?

North America combines strong gaming, creator, workstation and local-AI demand with high purchasing power and a mature upgrade-oriented distribution network. Desktop users can replace the graphics board without replacing the entire PC, creating a recurring aftermarket around GPU generations. Premium products also have a clearer addressable audience because buyers value performance, memory, cooling and software ecosystems. The commercial implication is strong demand for well-supported, high-performance AIBs and premium board implementations.

Market positionLargest regional context
Growth outlookGPU refresh driven
Demand profileGaming, creators, workstations
Access gateChannel and product differentiation
Country Position in region What drives demand
United States Dominant The U.S. combines gaming, creator and professional workloads with high adoption of new GPU architectures. Buyers compare memory, benchmark performance, acoustics and software features, while distributors and system builders determine launch visibility. Premium board designs can therefore sustain demand where thermal quality and warranty support are strong.
Canada Established premium market Canada shares the North American gaming and creator ecosystem but has a smaller addressable base. Product quality, cooling and reliable availability remain important, making established board partners competitive. Inventory planning is more important because lower-volume SKUs can tie up channel working capital.
Mexico Manufacturing and price sensitive Mexico links AIB demand to electronics and automotive manufacturing while also supporting a growing PC market. Mid-range products with strong performance-per-dollar can be more commercially relevant than flagship cards, and distribution partnerships are essential because price changes can be amplified by currency and import effects.

Market instances

  • The January 2025 RTX 5090 launch created a premium platform for North American board partners, with 92 billion transistors and more than 3,352 trillion AI operations per second. Such specifications support a wide board ecosystem because the thermal and power requirements create space for differentiated cooling and PCB designs.
  • AMD reported USD 3.9 billion of gaming revenue in 2025, up 51% from 2024, providing a company-level indicator that demand for Radeon gaming products was strong. The commercial implication for AIB partners is continued relevance of gaming as a high-volume purchase driver.
  • The region’s upgrade channel means AIB demand can grow without one-for-one growth in complete PC shipments. Users can change the graphics board while retaining CPUs, storage and chassis, making GPU generations a direct replacement trigger and supporting recurring aftermarket revenue.
In the full report: country-level market size, sales volume, technology mix, production footprint and customer demand can be evaluated against the commercial logic of this regional block.
Europe HIGH-SPECIFICATION

What differentiates Europe’s AIB market?

Europe is more sensitive to efficiency, acoustics, compliance and total system quality than a purely performance-maximizing market. Gaming and creator demand remain important, but workstation and industrial applications also raise the value of certified drivers and long-term support. Board partners therefore compete through cooler efficiency, lower noise, power management and documentation. The commercial implication is a market where the best product is not always the fastest one; thermal and system behavior can materially change purchase decisions.

Market positionHigh-specification
Growth outlookSteady premium demand
Demand profileGaming and professional
Access gateEfficiency, acoustics and compliance
Country Position in region What drives demand
Germany Industrial and gaming anchor Germany combines enthusiast graphics demand with industrial and workstation applications. Buyers evaluate performance and system reliability, while professional users require stable drivers and longer support. Premium AIB designs can therefore command value when their cooling and noise characteristics improve system-level performance.
United Kingdom Fast-refresh consumer market The UK has an active gaming and creator channel where buyers are highly informed about specifications and pricing. Mid-range boards remain important because consumers compare performance-per-dollar closely. Retail timing and promotions can therefore change channel demand quickly around new GPU launches.
France Mixed consumer and professional France combines gaming, creators and professional visualization. Buyers can be more sensitive to acoustic and efficiency characteristics than pure enthusiasts, so board partners benefit from products that combine strong performance with efficient thermals and clear technical support.
Italy Price-performance focused Italy has active PC and gaming communities but stronger price sensitivity in mainstream channels. Mid-range and efficient board designs can therefore outperform extreme premium products on volume, while distributor depth remains important for maintaining availability across changing demand cycles.

Market instances

  • European users often treat cooling, noise and power consumption as part of product quality, so board engineering can create differentiation even when GPU silicon is identical. Suppliers with efficient thermal designs can protect premium positioning better than those competing only on raw clock speed.
  • Professional applications add a second commercial axis. Workstation buyers value driver support, application compatibility and lifecycle availability, so vendors can earn higher-value revenue without depending entirely on consumer gaming cycles.
  • The European market can therefore support a mixed portfolio: premium gaming cards for enthusiasts, quieter and efficient variants for mainstream buyers, and professionally validated boards for long-cycle workloads. The key is configuration, not simply GPU brand.
In the full report: country-level market size, sales volume, technology mix, production footprint and customer demand can be evaluated against the commercial logic of this regional block.
Asia FASTEST-CHANGING

Why is Asia the fastest-changing AIB ecosystem?

Asia combines large gaming populations, fast PC adoption, dense board manufacturing, graphics-memory and PCB supply, and rapid growth in AI-enabled computing. China, Japan, South Korea and Southeast Asia have different demand patterns, but together they create a high-volume environment where board partners can introduce many SKUs quickly. The trade-off is intense price competition. Suppliers therefore win through manufacturing efficiency, channel breadth, cooling engineering and launch speed as much as through brand alone.

Market positionFastest-changing
Growth outlookHigh refresh intensity
Demand profileGaming, PC building, AI
Access gateCost, partner access and manufacturing
Country Position in region What drives demand
China Large and competitive China combines large gaming demand with a deep PC component manufacturing ecosystem. Buyers are price aware, while local board partners compete on cooler design, factory tuning and form factor. Supply and trade conditions can influence GPU availability, making inventory planning important.
Japan High specification Japan is a mature enthusiast and creator market where acoustics, compact design and product quality matter. Smaller physical boards and efficient coolers can have a stronger proposition than oversized flagship implementations, especially where chassis space is limited.
South Korea Gaming and technology led South Korea has strong gaming and esports demand plus advanced computing users. Performance, launch timing and AI capability matter, while premium board partners compete through product design and software support.
Southeast Asia Emerging volume Southeast Asia combines rapid PC adoption with wide differences in income. Suppliers need multiple price tiers, strong distributor coverage and careful inventory planning because tariffs, currencies and local channel practices differ substantially by country.

Market instances

  • AMD’s RX 9000 launch in February 2025 named 9 board partners for initial availability, including ASRock, ASUS, Gigabyte, Sapphire and XFX. The RX 9070 XT was specified with 16GB memory, 64 compute units, 304W board power and a USD 599 suggested price. The event demonstrates how Asian board ecosystems convert one GPU generation into multiple retail designs.
  • Intel’s Arc B-Series launch supported board models from Acer, ASRock, GUNNIR, ONIX, MAXSUN and Sparkle, with the B580 starting at USD 249 and the B570 at USD 219. This expands competition by giving customers more physical designs around a third GPU architecture.
  • Asia’s manufacturing density lowers time-to-market but intensifies price competition because PCB, memory, cooling and electronics assembly suppliers are nearby. The commercial implication is that board partners must control BOM cost and launch execution while preserving reliability at high volume.
In the full report: country-level market size, sales volume, technology mix, production footprint and customer demand can be evaluated against the commercial logic of this regional block.
South America DEVELOPING

What shapes the South American AIB market?

South America is more price-sensitive and import dependent than North America, so landed cost, currency movements and distributor inventory can materially influence product demand. Gaming remains the primary visible use case, but creators and workstation users also support demand. Mid-range cards often offer a better addressable opportunity than extreme flagships. The commercial mechanism is therefore value optimization: board partners need efficient designs that survive local price pressure while maintaining recognizable brand and warranty support.

Market positionDeveloping
Growth outlookSteady gaming growth
Demand profileGaming and creators
Access gateLanded cost and local inventory
Country Position in region What drives demand
Brazil Largest regional base Brazil has the region’s largest electronics and gaming ecosystem, but import costs and currency conditions can widen retail price differences. Mid-range AIBs with efficient cooling and strong performance-per-dollar are therefore important. Distribution and local warranty capability influence consumer confidence.
Argentina High volatility Currency and import changes can rapidly move graphics-card prices. Buyers may switch between current, previous-generation and refurbished products depending on the price gap. Suppliers therefore need flexible inventory and channel policies to protect margins and avoid overstock.
Chile Premium niche Chile has a smaller but active gaming and professional-computing market with a relatively international technology channel. Premium cooling and recognized brands can find demand, but import availability remains an important consideration for high-value cards.

Market instances

  • Global MSRP is not the final purchase price in South America. Taxes, freight, distributor margins and currency movements can change the market position of the same GPU within weeks. That means regional supply planning is a commercial discipline, not simply a logistics task.
  • Previous-generation cards remain competitive because they offer lower prices while still meeting many gaming workloads. This creates a restraint on new-board launches: a premium product must show enough performance or feature improvement to overcome the installed base of older cards.
  • Cloud gaming can substitute for some local GPU demand, but connectivity and latency constraints preserve local hardware requirements in many markets. The near-term opportunity therefore remains strongest where gaming culture and local PC-building ecosystems support dedicated hardware ownership.
In the full report: country-level market size, sales volume, technology mix, production footprint and customer demand can be evaluated against the commercial logic of this regional block.
Middle East & Africa EMERGING

How is demand developing in Middle East & Africa?

The region is uneven. Gulf markets can absorb premium gaming and workstation hardware, while many African markets are more constrained by price, import cost and service availability. Digital infrastructure and gaming culture create demand, but distribution and warranty support can be more limiting than technical demand. The commercial implication is that AIB suppliers need reliable local partners and thermal designs suited to warm operating environments. Product success can depend as much on service as on benchmark performance.

Market positionEmerging
Growth outlookProject and gaming led
Demand profilePremium Gulf, price-sensitive Africa
Access gateService, warranty and distribution
Country Position in region What drives demand
Saudi Arabia Premium gaming and digital Higher purchasing power and digital investment support gaming and workstation demand. Thermal performance and service are important because high-end cards operate under warm ambient conditions. Local distribution can protect availability and warranty response.
UAE Regional technology hub The UAE combines gaming, creator and enterprise demand with strong distribution infrastructure. It can also function as a channel hub for nearby markets. Suppliers benefit when they maintain regional inventory and support system integrators.
South Africa Industrial and enthusiast South Africa combines gaming with engineering, mining and industrial demand. The market favors dependable products and distributor support because system downtime can be expensive. Mid-range and professional boards can coexist depending on application.
Turkey Price-sensitive regional market Turkey has strong PC-building demand but currency volatility. Board suppliers need flexible price tiers and inventory management. Previous-generation boards can remain important alongside current products when price differences widen.

Market instances

  • GIGABYTE’s April 2026 collaboration with NVIDIA paired eligible RTX 50 boards with a game bundle for RTX 5070-and-above products, illustrating how software promotions can be used to support regional board demand without changing the GPU silicon. The mechanism is channel stimulation through added value.
  • GIGABYTE’s August 2026 RTX 50 INFINITY availability emphasized cooling and hidden connector design, showing that premium AIB differentiation continues at the board level. The significance for emerging markets is that physical design can become a visible quality signal when consumers compare several implementations of one GPU.
  • Thermal conditions in Gulf markets make cooler quality especially important. A board that maintains performance with lower fan stress can provide a more convincing value proposition than a simple clock-speed advantage. This favors vendors with strong cooler engineering and service coverage.
In the full report: country-level market size, sales volume, technology mix, production footprint and customer demand can be evaluated against the commercial logic of this regional block.

Competitive Landscape

The AIB market has two competitive layers. NVIDIA, AMD and Intel control GPU architectures, software stacks and product-generation timing, while ASUS, Gigabyte, MSI, Sapphire, ZOTAC, EVGA and other board partners turn those GPUs into finished cards. The architecture vendors influence the performance ceiling and feature set; board partners decide much of the physical customer experience through thermals, PCB design, acoustics, power delivery, industrial design and channel execution.

NVIDIA has a broad GeForce RTX 50 desktop portfolio spanning 5090, 5080, 5070 Ti, 5070, 5060 Ti, 5060 and 5050. The RTX 5090 pairs 21,760 CUDA cores with 32GB of GDDR7, a 512-bit memory interface and 1,792GB/s bandwidth. Such specifications create a large design space for board partners because the physical cooling and power architecture becomes part of the product. Competitive advantage therefore exists at both the GPU architecture level and the board implementation level.

AMD reported USD 3.9 billion of gaming revenue in 2025, up 51% from USD 2.6 billion in 2024, while launching the Radeon RX 9000 family with board partners across multiple markets. The RX 9070 XT carries 16GB of memory, 64 compute units, 304W board power and a USD 599 suggested price. The commercial strategy is to combine GPU architecture, AI features and partner designs with competitive performance-per-dollar, giving AIB manufacturers several ways to differentiate within the same Radeon platform.

Intel’s Arc B-Series provides a third source of discrete GPU architecture. The B580 carries 12GB of dedicated memory and a USD 249 starting position, while the B570 carries 10GB and starts at USD 219. Intel reported up to 70% better performance per Xe-core and 50% more performance per watt versus the previous generation. The strategic significance is broader choice: an additional architecture can pressure pricing and encourage board partners to compete on value, availability and physical design.

Board partners ultimately compete on product execution. Two AIBs can share the same GPU but differ materially in cooling, noise, dimensions, clocks, power connectors, firmware and warranty. GIGABYTE’s 2026 INFINITY series shows how cooling and cable management can become core marketing features. The commercial implication is that AIB profitability depends on design discipline, manufacturing yield and channel timing, not simply on access to high-performance silicon.

Tier Companies / supplier group Basis of competition
GPU architecture leaders NVIDIA; AMD; Intel GPU silicon, software ecosystem, AI and rendering features, driver support, generation cadence.
Premium board partners ASUS; Gigabyte; MSI; Sapphire; ZOTAC; EVGA Cooling, PCB engineering, power delivery, acoustics, factory tuning, design and warranty.
Value-focused suppliers Regional and channel-led manufacturers Performance-per-dollar, BOM control, broad distribution and rapid inventory turnover.
Professional specialists Workstation and validated-system vendors Application certification, driver stability, memory capacity and lifecycle support.

The supplied company list includes Advanced Micro Devices Inc., AsusTek Computer Inc., EVGA Corporation, Gigabyte Technology Co. Ltd., Intel Corporation, Matrox, Micro-Star International Co., Nvidia Corporation, Sapphire Technology and ZOTAC (PC Partner Limited). The list spans GPU architecture vendors and board manufacturers, so the tier view distinguishes silicon control from physical AIB manufacturing and channel execution. Not every company competes on the same axis, and the market structure is best understood as a layered ecosystem rather than a single homogeneous supplier group.

Companies covered in this report

Company Role Covered
Advanced Micro Devices Inc. GPU architecture and Radeon platform
AsusTek Computer Inc. AIB design, cooling, board engineering and distribution
EVGA Corporation Discrete graphics board partner and channel supplier
Gigabyte Technology Co. Ltd. AIB design, cooling, power delivery and channel execution
Intel Corporation GPU architecture and Arc graphics platform
Matrox Professional graphics and specialized board solutions
Micro-Star International Co. AIB design, cooling, factory tuning and distribution
Nvidia Corporation GPU architecture, GeForce platform and software ecosystem
Sapphire Technology Radeon-focused AIB design and board manufacturing
ZOTAC (PC Partner Limited) GeForce AIB design, compact boards and channel distribution

Production Capacity Analysis / Supply-Side Analysis

AIB production depends on GPU allocation, graphics memory, PCB capacity, power components, cooling hardware and final assembly rather than on GPU wafer output alone. A board can be constrained because its GPU is unavailable, its GDDR memory is late, its cooler is not ready or a particular power component is short. This creates a supply system with several independent bottlenecks. The best-performing suppliers synchronize GPU allocation, memory procurement, PCB fabrication, cooling production and channel inventory around the launch calendar.

GPU availability is the first gate. When a new architecture launches, partner brands need early allocations to create retail visibility. A missed launch window can be costly because enthusiast demand is strongest near release and later generations quickly reset the price-performance comparison. The commercial response is early planning and close coordination with GPU vendors. The market implication is that supplier relationships and launch allocation can be strategic assets, even when a board manufacturer has strong internal engineering capability.

Graphics memory is the second major input. RTX 5090 uses 32GB GDDR7 and a 512-bit interface, while RTX 5080 uses 16GB and 256-bit, and lower RTX 50 models step down further. AMD’s RX 9070 XT and RX 9070 both use 16GB configurations. These differences affect PCB routing, BOM cost, thermal design and product segmentation. AIB manufacturers need memory sourcing flexibility because a change in memory specification can affect board validation, pricing and the volume that can be released in a given quarter.

Cooling and power delivery create another bottleneck. High-end boards can exceed 300W, requiring large heat sinks, advanced fan geometries, multiple power phases and robust connectors. GIGABYTE’s 2026 INFINITY series uses a Double Flow Through cooling concept and a Hawk fan design that it says increases air pressure by 53.6% and air volume by 12.5%. The broader market implication is that thermal engineering is becoming a measurable product attribute rather than an invisible manufacturing task.

Final board assembly includes GPU and memory placement, passive-component installation, firmware loading, electrical testing, thermal validation and quality inspection. After assembly, boards move through distributors, retailers, system integrators and OEMs. Inventory decisions matter because product prices can change quickly when supply or demand shifts. A supplier that overbuilds premium inventory can suffer rapid price erosion, while a supplier that underbuilds can lose launch share. The commercial optimum is synchronized production and channel replenishment.

Regional concentration adds another supply-side risk. Many PCB, component, memory and board assembly suppliers are located in Asia, which shortens the development cycle but can amplify exposure to logistics or geopolitical disruption. North American and European markets remain important for premium demand, but their physical supply chains are tightly connected to Asian manufacturing. Diversified sourcing, flexible designs and early component planning therefore influence both availability and gross margin.

Market Dynamics

The market is driven by GPU generation refreshes, gaming and creator demand, AI-assisted graphics, workstation workloads and the upgradeability of desktop systems. Restraints include high-end power and thermal requirements, pricing, integrated-graphics substitution and supply-chain concentration. The combination creates a market where the physical board is increasingly part of the competitive proposition. A strong GPU can underperform commercially if its partner board is noisy, oversized, expensive or unavailable when customers want it.

Market Drivers

Factor Relative impact Geographic relevance Impact timeline Commercial interpretation
GPU generational refresh High Global 2025–2034 New architectures reset performance tiers and stimulate upgrade decisions.
AI-enabled graphics High Global 2026–2034 Tensor, matrix and AI acceleration make dedicated GPUs useful beyond gaming.
Gaming and esports High North America, Europe, Asia 2025–2034 Gaming remains a broad retail volume channel with recurring hardware refreshes.
Creator and workstation Medium-High North America, Europe, Asia 2025–2034 Memory capacity, driver support and performance consistency support premium demand.

GPU generational refresh

New GPU architectures create direct replacement triggers because they change performance, memory and feature baselines. NVIDIA’s January 2025 RTX 50 announcement introduced Blackwell, fifth-generation Tensor Cores and fourth-generation ray tracing, while AMD’s February 2025 RX 9000 launch added RDNA 4 and AI acceleration. The commercial mechanism is simple: users compare current cards with the new generation and board partners offer multiple versions. The market implication is recurring demand tied to architecture calendars.

AI-enabled graphics

Dedicated graphics boards are becoming local AI accelerators as GPUs add tensor or matrix engines alongside traditional graphics cores. NVIDIA’s RTX 5090 provides more than 3,352 trillion AI operations per second, while AMD and Intel increasingly highlight AI acceleration in consumer graphics. Board partners can therefore position the same card for gaming, image generation and creator workloads. The market implication is a wider addressable application base, improving the relevance of premium memory and cooling configurations.

Gaming and esports

Gaming remains a broad demand driver because software, displays and rendering features continually raise the performance baseline. Ray tracing, frame generation, high-refresh 4K displays and AI-enhanced image quality create reasons to upgrade. Board partners add value through quieter cooling, higher clocks and factory tuning. The market implication is that AIB demand can grow even when complete PC replacement is slower because users can change one major component while retaining the rest of the system.

Creator and workstation workloads

Professional users buy graphics hardware for CAD, 3D, media production, simulation and local AI. These customers care about memory capacity, driver stability, application certification and lifecycle support. The commercial response is validated hardware and longer product availability, which can support higher-value sales than consumer-only gaming. The market implication is a second demand stream that can reduce dependence on enthusiasts and can support boards that sacrifice some gaming aesthetics for reliability and professional integration.

Market Restraints

Factor Relative impact Geographic relevance Impact timeline Evidence-based interpretation
High-end power and thermals High Global 2025–2034 300W-class and higher boards require sophisticated coolers, power delivery and compatible chassis.
Pricing and affordability Medium-High Emerging markets 2025–2034 Higher board prices shift mainstream demand toward integrated or previous-generation graphics.
Supply-chain concentration Medium-High Global 2025–2034 GPU, memory, PCB and component supply chains remain geographically concentrated.
Integrated graphics substitution Medium Global 2025–2034 Improving processor graphics reduces demand for entry-level discrete cards.

High-end power and thermals

As graphics performance increases, thermal density and power delivery become system constraints. A high-end board may need multiple fans, thicker heat sinks, reinforced PCBs and high-capacity power stages, which can consume several chassis slots. The commercial response is to improve heat transfer and airflow while maintaining acceptable noise. The market implication is that the board partner’s thermal engineering can determine whether a GPU specification is practical in real systems, especially in compact or warm environments.

Pricing and affordability

AIBs are discretionary upgrades for many consumers, so price matters. Flagship cards can carry high component and cooling costs, while integrated graphics and previous-generation cards provide lower-cost substitutes. Suppliers therefore need a multi-tier portfolio to capture demand at different income and workload levels. The commercial implication is that mid-range designs with efficient BOMs can be strategically important even when premium boards receive more attention in product launches.

Supply-chain concentration

The AIB chain depends on a limited set of GPU architectures, memory suppliers, PCB manufacturers and cooling vendors. A disruption in any one component can reduce finished-board availability. Suppliers respond through dual sourcing, flexible PCB designs, inventory planning and closer supplier coordination. The market implication is that operational resilience directly affects revenue because a missed launch or delayed replenishment window can allow competitors to capture shelf space and customer mindshare.

Integrated graphics substitution

Improving integrated graphics reduces the need for a separate GPU for office work, streaming and entry-level gaming. AIB suppliers therefore must maintain a visible performance or feature advantage. Dedicated memory, advanced ray tracing, AI acceleration and higher throughput are all ways to justify the additional board cost. The restraint is strongest when consumers prioritize low system cost or small form factors, but it becomes weaker as software and displays demand more dedicated graphics capability.

Market Opportunities

AI-capable consumer boards

Where: gaming desktops, creator PCs and local-AI workstations. Who benefits: GPU vendors and board partners. What changes: AIBs increasingly perform graphics, media and AI workloads on one platform, allowing a single board architecture to address several demand pools. Commercial implication: higher-memory and stronger-cooling boards can target gaming, creator and local-AI workloads with one SKU, improving product utilization, supporting premium positioning and making board engineering more strategically valuable.

Premium thermal engineering

Where: enthusiast and workstation segments. Who benefits: board makers with proprietary cooler and power-delivery capability. What changes: acoustics, sustained performance and chassis compatibility become purchase criteria. Commercial implication: suppliers can differentiate the physical board even when the underlying GPU is common across competitors, giving them a route to margin and brand value.

Mainstream performance-per-dollar

Where: Asia, South America and price-sensitive channels. Who benefits: suppliers with efficient BOM and cooling design. What changes: users increasingly compare dedicated cards against integrated graphics and older models, so the performance threshold for a new board is rising. Commercial implication: mid-range configurations can provide volume if suppliers control memory selection, PCB complexity, cooling cost and distribution expense while maintaining a visible performance-per-dollar advantage.

Professional AI and visualization

Where: workstations, engineering, content creation and edge systems. Who benefits: vendors with certified drivers and application support. What changes: graphics hardware is specified for productivity and local AI in addition to games, increasing the importance of stability and software validation. Commercial implication: longer lifecycle requirements, validated platforms and application support can support higher-value contracts than retail gaming alone and reduce reliance on short consumer refresh cycles.

Supply Chain Analysis

UPSTREAMGPU die, graphics memory, power components, PCB materials and cooling inputs
MANUFACTURINGPCB fabrication, surface-mount assembly, firmware, electrical testing and thermal validation
CHANNELDistributors, retailers, system integrators and OEM channels
DOWNSTREAMGaming PCs, workstations, creators, local AI systems and specialized visualization

Upstream

The AIB upstream chain begins with GPU silicon and graphics memory and then expands into power semiconductors, inductors, capacitors, PCBs, connectors and cooling materials. Because GPU generations change memory type, power envelope and board requirements, component qualification is ongoing. Suppliers need design flexibility and enough sourcing redundancy to handle changes. The market implication is that AIB production can be constrained by ordinary components as easily as by headline GPU availability.

Manufacturing

Board manufacturing includes PCB fabrication, component placement, GPU and memory attachment, cooler installation, firmware and electrical tests. Physical design is where board partners create most of their differentiation. Multiple suppliers can use the same GPU while changing heat sinks, fan geometry, VRM design and clocks. The commercial implication is that manufacturing yield, assembly speed and thermal validation can create a stronger margin advantage than simple access to commodity board materials.

Channel

AIB channels are launch sensitive. New boards enter distributors, retailers and system builders soon after a GPU announcement, and demand can change quickly with review results, MSRP and availability. Suppliers therefore need accurate forecasts and enough SKU breadth without overbuilding slow-moving variants. The market implication is a trade-off between launch readiness and inventory risk, making channel relationships and replenishment discipline strategic components of the AIB business model.

Downstream

Downstream demand divides between consumer gaming, creator, workstation and specialized systems. Gaming users focus on frame rates, displays and price; professionals add driver support, memory capacity and lifecycle; specialized buyers may need unusual form factors or validation. Suppliers therefore need more than one commercialization path. The market implication is that a well-segmented portfolio can capture several demand pools from the same GPU architecture, increasing the return on board-development investment.

Recent Developments

  • 10 August 2026 Released
    GIGABYTE announces availability of AORUS GeForce RTX 50 INFINITY cards. The lineup adds RTX 5080, RTX 5070 Ti and RTX 5070 implementations using WINDFORCE HYPERBURST, Double Flow Through and Hawk fans; GIGABYTE cites 53.6% higher air pressure and 12.5% higher air volume for the fan design. The market significance is stronger board-level differentiation in thermal and mechanical engineering. Official Source: GIGABYTE
  • 1 June 2026 Announced
    NVIDIA partners unveil new RTX 50 Series AIBs at COMPUTEX 2026. NVIDIA highlighted new GeForce RTX 50 partner cards and noted more than 6,000 booths and 1,500 exhibitors at COMPUTEX 2026. The development reinforces the partner-driven structure of the AIB market, where one GPU generation creates many physical card designs and channel SKUs. Official Source: NVIDIA
  • 19 March 2026 Released
    AMD Adrenalin 26.3.1 adds FSR 4.1 support for RX 9000 graphics. The software update added FSR Upscaling 4.1 for RX 9000 boards. This matters because software features increasingly extend the useful value of an AIB after purchase, strengthening the importance of drivers and feature ecosystems alongside physical hardware. Official Source: AMD
  • 28 February 2025 Launched
    AMD introduces Radeon RX 9070 XT and RX 9070. The RX 9000 generation introduced 16GB configurations, revised ray tracing and AI accelerators. AMD set suggested prices of USD 599 for the 9070 XT and USD 549 for the 9070, with nine board partners named for initial availability on 6 March 2025. Official Source: AMD
  • 6 January 2025 Launched
    NVIDIA introduces GeForce RTX 50 Series desktop GPUs. The Blackwell family brought neural rendering, fifth-generation Tensor Cores and fourth-generation ray tracing to desktop graphics. The RTX 5090 features 92 billion transistors and more than 3,352 trillion AI operations per second, increasing the importance of power, memory and cooling engineering at the board level. Official Source: NVIDIA

Report Scope & Segmentation

Attribute Scope definition
Study Period 2020–2034, using the supplied historical scope and the target 2025–2034 overview window.
Base Year 2025; USD 51,232 million.
Estimated Year 2025.
Forecast Period 2026–2034.
Historical Period 2020–2024.
Market Size USD 51,232 million in 2025 and USD 105,116 million in 2034.
Growth Rate 8.3% CAGR for 2026–2034.
Unit USD million unless otherwise stated; graphics specifications, power and price use manufacturer units.
By Type Discrete; Integrated.
By Application Desktops; Notebooks and Tablets; Workstations; Others.
By End User Gaming; Professional Visualization; Data Centers; Others.
By Region North America; Europe; Asia; South America; Middle East and Africa.
Key Companies Profiled Advanced Micro Devices Inc.; AsusTek Computer Inc.; EVGA Corporation; Gigabyte Technology Co. Ltd.; Intel Corporation; Matrox; Micro-Star International Co.; Nvidia Corporation; Sapphire Technology; ZOTAC (PC Partner Limited).
Customization Scope Analysis may be extended by GPU generation, memory type, board configuration, price tier, workload, region, channel and supplier.

Frequently Asked Questions

What is the Graphics Add-in Board market size in 2025?

The Graphics Add-in Board market size is USD 51,232 million in 2025. This is the common base year for the 2026–2034 overview and is paired with an 8.3% CAGR and a 2034 endpoint of USD 105,116 million. The market scope separates discrete and integrated graphics and covers desktops, notebooks and tablets, workstations and other specialized applications.

What is the projected AIB market size in 2034?

The market is projected to reach USD 105,116 million in 2034 during the 2026–2034 forecast period. The 2034 outlook reflects continued expansion in high-performance graphics hardware, supported by AI computing, gaming and workstation demand. Rising accelerator performance increases the value of high-bandwidth memory, advanced substrates, thermal solutions and power delivery, while board partners compete on electrical integrity, cooling and manufacturing scalability. The result describes the market trajectory rather than identical growth across every GPU family or region.

What is the AIB market CAGR from 2026 to 2034?

The reported CAGR is 8.3% for 2026–2034. Growth is supported by GPU generational refreshes, gaming, creator workloads, workstation demand and the expansion of AI-enabled graphics. Countervailing forces include integrated-graphics substitution, pricing, power and cooling requirements, and supply-chain concentration. The compound rate is therefore best interpreted as an overall market trajectory rather than a uniform annual rate for every product class.

Which AIB type is the largest?

Discrete graphics boards are the structural anchor because they provide dedicated memory, higher throughput and specialized acceleration that integrated graphics cannot always match. They serve gaming, creators, workstations and local AI. Their upgradeability in desktop systems also creates a recurring aftermarket. Integrated graphics remains important as a substitute, especially in mainstream and mobile systems, so discrete products need to maintain a visible value gap.

What is driving AIB market growth?

AIB demand is driven by new GPU architectures, gaming refresh cycles, creator and workstation workloads and AI-enabled graphics. New GPU generations alter performance and software features, while board partners create multiple physical designs around each silicon platform. The result is a recurring product cycle in which customers can upgrade one component instead of replacing the whole PC, creating a strong aftermarket mechanism for dedicated graphics.

How is AI changing AIB products?

AI changes the AIB value proposition by adding workloads such as image generation, neural rendering, local inference and AI-assisted media processing. NVIDIA, AMD and Intel all emphasize AI acceleration in their current graphics architectures. This broadens the addressable customer base and increases the importance of memory capacity, software support and sustained thermal performance. The commercial implication is that board manufacturers can target several workloads with one graphics platform.

Which region is the largest AIB market?

North America is the largest regional context in the supplied scope. Its position is supported by mature gaming and creator markets, high purchasing power, established distributor networks and an upgrade-oriented desktop ecosystem. Consumers can replace the graphics card without replacing the entire computer, creating recurring demand around GPU generations. Premium AIBs also have a clear addressable audience because users value cooling, performance and software features.

Which region is changing fastest?

Asia is the fastest-changing regional context because it combines large gaming populations, strong electronics manufacturing and dense board-partner supply chains. China, Japan, South Korea and Southeast Asia differ in price sensitivity and channel structure, but together they support rapid product introduction and high competition. Suppliers benefit from manufacturing proximity but face strong price pressure, making efficiency, launch speed and distributor reach important competitive factors.

What are the main AIB supply-side constraints?

The key constraints are GPU allocation, graphics memory, PCB capacity, power components, cooling systems and final assembly. A problem in any one stage can reduce finished-board availability even when customer demand remains high. Launch timing makes this particularly important because new GPU generations create concentrated demand windows. Suppliers that plan memory early, qualify component alternatives and coordinate cooler production can reduce the risk of missed launches or inventory gaps.

Why are entry-level AIBs under pressure?

Integrated graphics increasingly satisfies office, streaming and basic gaming requirements, reducing the need for a separate entry-level graphics card. AIB suppliers therefore need to deliver a clear value advantage through dedicated memory, higher compute performance, AI acceleration, ray tracing or stronger display support. The substitution pressure is strongest where buyers prioritize low system cost, but it is weaker for enthusiast, creator and professional applications where dedicated throughput remains economically meaningful.
Graphics Add-in Board (AIB) Market Size, Share, Trends, Market Growth and Forecast 2026-2034

Get Sample Report PDF for Exclusive Insights

Report Sample Includes

  • Table of Contents
  • List of Tables & Figures
  • Charts, Research Methodology, and more...

PDF Icon Download Sample Report PDF

Download Sample Report

Table of Content

1 Introduction to Research & Analysis Reports
1.1 Graphics Add-in Board (AIB) Market Definition
1.2 Market Segments
1.2.1 Segment by Type
1.2.2 Segment by Application
1.3 Global Graphics Add-in Board (AIB) Market Overview
1.4 Features & Benefits of This Report
1.5 Methodology & Sources of Information
1.5.1 Research Methodology
1.5.2 Research Process
1.5.3 Base Year
1.5.4 Report Assumptions & Caveats
2 Global Graphics Add-in Board (AIB) Overall Market Size
2.1 Global Graphics Add-in Board (AIB) Market Size: 2024 VS 2032
2.2 Global Graphics Add-in Board (AIB) Market Size, Prospects & Forecasts: 2026-2034
2.3 Global Graphics Add-in Board (AIB) Sales: 2026-2034
3 Company Landscape
3.1 Top Graphics Add-in Board (AIB) Players in Global Market
3.2 Top Global Graphics Add-in Board (AIB) Companies Ranked by Revenue
3.3 Global Graphics Add-in Board (AIB) Revenue by Companies
3.4 Global Graphics Add-in Board (AIB) Sales by Companies
3.5 Global Graphics Add-in Board (AIB) Price by Manufacturer (2020-2025)
3.6 Top 3 and Top 5 Graphics Add-in Board (AIB) Companies in Global Market, by Revenue in 2024
3.7 Global Manufacturers Graphics Add-in Board (AIB) Product Type
3.8 Tier 1, Tier 2, and Tier 3 Graphics Add-in Board (AIB) Players in Global Market
3.8.1 List of Global Tier 1 Graphics Add-in Board (AIB) Companies
3.8.2 List of Global Tier 2 and Tier 3 Graphics Add-in Board (AIB) Companies
4 Sights by Product
4.1 Overview
4.1.1 Segment by Type – Global Graphics Add-in Board (AIB) Market Size Markets, 2024 & 2032
4.1.2 Discrete
4.1.3 Integrated
4.2 Segment by Type – Global Graphics Add-in Board (AIB) Revenue & Forecasts
4.2.1 Segment by Type – Global Graphics Add-in Board (AIB) Revenue, 2020-2025
4.2.2 Segment by Type – Global Graphics Add-in Board (AIB) Revenue, 2026-2032
4.2.3 Segment by Type – Global Graphics Add-in Board (AIB) Revenue Market Share, 2026-2034
4.3 Segment by Type – Global Graphics Add-in Board (AIB) Sales & Forecasts
4.3.1 Segment by Type – Global Graphics Add-in Board (AIB) Sales, 2020-2025
4.3.2 Segment by Type – Global Graphics Add-in Board (AIB) Sales, 2026-2032
4.3.3 Segment by Type – Global Graphics Add-in Board (AIB) Sales Market Share, 2026-2034
4.4 Segment by Type – Global Graphics Add-in Board (AIB) Price (Manufacturers Selling Prices), 2026-2034
5 Sights by Application
5.1 Overview
5.1.1 Segment by Application – Global Graphics Add-in Board (AIB) Market Size, 2024 & 2032
5.1.2 Desktops
5.1.3 Notebooks and Tablets
5.1.4 Workstations
5.1.5 Others
5.2 Segment by Application – Global Graphics Add-in Board (AIB) Revenue & Forecasts
5.2.1 Segment by Application – Global Graphics Add-in Board (AIB) Revenue, 2020-2025
5.2.2 Segment by Application – Global Graphics Add-in Board (AIB) Revenue, 2026-2032
5.2.3 Segment by Application – Global Graphics Add-in Board (AIB) Revenue Market Share, 2026-2034
5.3 Segment by Application – Global Graphics Add-in Board (AIB) Sales & Forecasts
5.3.1 Segment by Application – Global Graphics Add-in Board (AIB) Sales, 2020-2025
5.3.2 Segment by Application – Global Graphics Add-in Board (AIB) Sales, 2026-2032
5.3.3 Segment by Application – Global Graphics Add-in Board (AIB) Sales Market Share, 2026-2034
5.4 Segment by Application – Global Graphics Add-in Board (AIB) Price (Manufacturers Selling Prices), 2026-2034
6 Sights by Region
6.1 By Region – Global Graphics Add-in Board (AIB) Market Size, 2024 & 2032
6.2 By Region – Global Graphics Add-in Board (AIB) Revenue & Forecasts
6.2.1 By Region – Global Graphics Add-in Board (AIB) Revenue, 2020-2025
6.2.2 By Region – Global Graphics Add-in Board (AIB) Revenue, 2026-2032
6.2.3 By Region – Global Graphics Add-in Board (AIB) Revenue Market Share, 2026-2034
6.3 By Region – Global Graphics Add-in Board (AIB) Sales & Forecasts
6.3.1 By Region – Global Graphics Add-in Board (AIB) Sales, 2020-2025
6.3.2 By Region – Global Graphics Add-in Board (AIB) Sales, 2026-2032
6.3.3 By Region – Global Graphics Add-in Board (AIB) Sales Market Share, 2026-2034
6.4 North America
6.4.1 By Country – North America Graphics Add-in Board (AIB) Revenue, 2026-2034
6.4.2 By Country – North America Graphics Add-in Board (AIB) Sales, 2026-2034
6.4.3 United States Graphics Add-in Board (AIB) Market Size, 2026-2034
6.4.4 Canada Graphics Add-in Board (AIB) Market Size, 2026-2034
6.4.5 Mexico Graphics Add-in Board (AIB) Market Size, 2026-2034
6.5 Europe
6.5.1 By Country – Europe Graphics Add-in Board (AIB) Revenue, 2026-2034
6.5.2 By Country – Europe Graphics Add-in Board (AIB) Sales, 2026-2034
6.5.3 Germany Graphics Add-in Board (AIB) Market Size, 2026-2034
6.5.4 France Graphics Add-in Board (AIB) Market Size, 2026-2034
6.5.5 U.K. Graphics Add-in Board (AIB) Market Size, 2026-2034
6.5.6 Italy Graphics Add-in Board (AIB) Market Size, 2026-2034
6.5.7 Russia Graphics Add-in Board (AIB) Market Size, 2026-2034
6.5.8 Nordic Countries Graphics Add-in Board (AIB) Market Size, 2026-2034
6.5.9 Benelux Graphics Add-in Board (AIB) Market Size, 2026-2034
6.6 Asia
6.6.1 By Region – Asia Graphics Add-in Board (AIB) Revenue, 2026-2034
6.6.2 By Region – Asia Graphics Add-in Board (AIB) Sales, 2026-2034
6.6.3 China Graphics Add-in Board (AIB) Market Size, 2026-2034
6.6.4 Japan Graphics Add-in Board (AIB) Market Size, 2026-2034
6.6.5 South Korea Graphics Add-in Board (AIB) Market Size, 2026-2034
6.6.6 Southeast Asia Graphics Add-in Board (AIB) Market Size, 2026-2034
6.6.7 India Graphics Add-in Board (AIB) Market Size, 2026-2034
6.7 South America
6.7.1 By Country – South America Graphics Add-in Board (AIB) Revenue, 2026-2034
6.7.2 By Country – South America Graphics Add-in Board (AIB) Sales, 2026-2034
6.7.3 Brazil Graphics Add-in Board (AIB) Market Size, 2026-2034
6.7.4 Argentina Graphics Add-in Board (AIB) Market Size, 2026-2034
6.8 Middle East & Africa
6.8.1 By Country – Middle East & Africa Graphics Add-in Board (AIB) Revenue, 2026-2034
6.8.2 By Country – Middle East & Africa Graphics Add-in Board (AIB) Sales, 2026-2034
6.8.3 Turkey Graphics Add-in Board (AIB) Market Size, 2026-2034
6.8.4 Israel Graphics Add-in Board (AIB) Market Size, 2026-2034
6.8.5 Saudi Arabia Graphics Add-in Board (AIB) Market Size, 2026-2034
6.8.6 UAE Graphics Add-in Board (AIB) Market Size, 2026-2034
7 Manufacturers & Brands Profiles
7.1 Advanced Micro Devices Inc.
7.1.1 Advanced Micro Devices Inc. Company Summary
7.1.2 Advanced Micro Devices Inc. Business Overview
7.1.3 Advanced Micro Devices Inc. Graphics Add-in Board (AIB) Major Product Offerings
7.1.4 Advanced Micro Devices Inc. Graphics Add-in Board (AIB) Sales and Revenue in Global (2020-2025)
7.1.5 Advanced Micro Devices Inc. Key News & Latest Developments
7.2 AsusTek Computer Inc.
7.2.1 AsusTek Computer Inc. Company Summary
7.2.2 AsusTek Computer Inc. Business Overview
7.2.3 AsusTek Computer Inc. Graphics Add-in Board (AIB) Major Product Offerings
7.2.4 AsusTek Computer Inc. Graphics Add-in Board (AIB) Sales and Revenue in Global (2020-2025)
7.2.5 AsusTek Computer Inc. Key News & Latest Developments
7.3 EVGA Corporation
7.3.1 EVGA Corporation Company Summary
7.3.2 EVGA Corporation Business Overview
7.3.3 EVGA Corporation Graphics Add-in Board (AIB) Major Product Offerings
7.3.4 EVGA Corporation Graphics Add-in Board (AIB) Sales and Revenue in Global (2020-2025)
7.3.5 EVGA Corporation Key News & Latest Developments
7.4 Gigabyte Technology Co. Ltd.
7.4.1 Gigabyte Technology Co. Ltd. Company Summary
7.4.2 Gigabyte Technology Co. Ltd. Business Overview
7.4.3 Gigabyte Technology Co. Ltd. Graphics Add-in Board (AIB) Major Product Offerings
7.4.4 Gigabyte Technology Co. Ltd. Graphics Add-in Board (AIB) Sales and Revenue in Global (2020-2025)
7.4.5 Gigabyte Technology Co. Ltd. Key News & Latest Developments
7.5 Intel Corporation
7.5.1 Intel Corporation Company Summary
7.5.2 Intel Corporation Business Overview
7.5.3 Intel Corporation Graphics Add-in Board (AIB) Major Product Offerings
7.5.4 Intel Corporation Graphics Add-in Board (AIB) Sales and Revenue in Global (2020-2025)
7.5.5 Intel Corporation Key News & Latest Developments
7.6 Matrox
7.6.1 Matrox Company Summary
7.6.2 Matrox Business Overview
7.6.3 Matrox Graphics Add-in Board (AIB) Major Product Offerings
7.6.4 Matrox Graphics Add-in Board (AIB) Sales and Revenue in Global (2020-2025)
7.6.5 Matrox Key News & Latest Developments
7.7 Micro-Star International Co.
7.7.1 Micro-Star International Co. Company Summary
7.7.2 Micro-Star International Co. Business Overview
7.7.3 Micro-Star International Co. Graphics Add-in Board (AIB) Major Product Offerings
7.7.4 Micro-Star International Co. Graphics Add-in Board (AIB) Sales and Revenue in Global (2020-2025)
7.7.5 Micro-Star International Co. Key News & Latest Developments
7.8 Nvidia Corporation
7.8.1 Nvidia Corporation Company Summary
7.8.2 Nvidia Corporation Business Overview
7.8.3 Nvidia Corporation Graphics Add-in Board (AIB) Major Product Offerings
7.8.4 Nvidia Corporation Graphics Add-in Board (AIB) Sales and Revenue in Global (2020-2025)
7.8.5 Nvidia Corporation Key News & Latest Developments
7.9 Sapphire Technology
7.9.1 Sapphire Technology Company Summary
7.9.2 Sapphire Technology Business Overview
7.9.3 Sapphire Technology Graphics Add-in Board (AIB) Major Product Offerings
7.9.4 Sapphire Technology Graphics Add-in Board (AIB) Sales and Revenue in Global (2020-2025)
7.9.5 Sapphire Technology Key News & Latest Developments
7.10 ZOTAC(PC Partner Limited)
7.10.1 ZOTAC(PC Partner Limited) Company Summary
7.10.2 ZOTAC(PC Partner Limited) Business Overview
7.10.3 ZOTAC(PC Partner Limited) Graphics Add-in Board (AIB) Major Product Offerings
7.10.4 ZOTAC(PC Partner Limited) Graphics Add-in Board (AIB) Sales and Revenue in Global (2020-2025)
7.10.5 ZOTAC(PC Partner Limited) Key News & Latest Developments
8 Global Graphics Add-in Board (AIB) Production Capacity, Analysis
8.1 Global Graphics Add-in Board (AIB) Production Capacity, 2026-2034
8.2 Graphics Add-in Board (AIB) Production Capacity of Key Manufacturers in Global Market
8.3 Global Graphics Add-in Board (AIB) Production by Region
9 Key Market Trends, Opportunity, Drivers and Restraints
9.1 Market Opportunities & Trends
9.2 Market Drivers
9.3 Market Restraints
10 Graphics Add-in Board (AIB) Supply Chain Analysis
10.1 Graphics Add-in Board (AIB) Industry Value Chain
10.2 Graphics Add-in Board (AIB) Upstream Market
10.3 Graphics Add-in Board (AIB) Downstream and Clients
10.4 Marketing Channels Analysis
10.4.1 Marketing Channels
10.4.2 Graphics Add-in Board (AIB) Distributors and Sales Agents in Global
11 Conclusion
12 Appendix
12.1 Note
12.2 Examples of Clients
12.3 DisclaimerList of Tables
Table 1. Key Players of Graphics Add-in Board (AIB) in Global Market
Table 2. Top Graphics Add-in Board (AIB) Players in Global Market, Ranking by Revenue (2024)
Table 3. Global Graphics Add-in Board (AIB) Revenue by Companies, (US$, Mn), 2020-2025
Table 4. Global Graphics Add-in Board (AIB) Revenue Share by Companies, 2020-2025
Table 5. Global Graphics Add-in Board (AIB) Sales by Companies, (K Units), 2020-2025
Table 6. Global Graphics Add-in Board (AIB) Sales Share by Companies, 2020-2025
Table 7. Key Manufacturers Graphics Add-in Board (AIB) Price (2020-2025) & (US$/Unit)
Table 8. Global Manufacturers Graphics Add-in Board (AIB) Product Type
Table 9. List of Global Tier 1 Graphics Add-in Board (AIB) Companies, Revenue (US$, Mn) in 2024 and Market Share
Table 10. List of Global Tier 2 and Tier 3 Graphics Add-in Board (AIB) Companies, Revenue (US$, Mn) in 2024 and Market Share
Table 11. Segment by Type – Global Graphics Add-in Board (AIB) Revenue, (US$, Mn), 2024 & 2032
Table 12. Segment by Type – Global Graphics Add-in Board (AIB) Revenue (US$, Mn), 2020-2025
Table 13. Segment by Type – Global Graphics Add-in Board (AIB) Revenue (US$, Mn), 2026-2032
Table 14. Segment by Type – Global Graphics Add-in Board (AIB) Sales (K Units), 2020-2025
Table 15. Segment by Type – Global Graphics Add-in Board (AIB) Sales (K Units), 2026-2032
Table 16. Segment by Application – Global Graphics Add-in Board (AIB) Revenue, (US$, Mn), 2024 & 2032
Table 17. Segment by Application – Global Graphics Add-in Board (AIB) Revenue, (US$, Mn), 2020-2025
Table 18. Segment by Application – Global Graphics Add-in Board (AIB) Revenue, (US$, Mn), 2026-2032
Table 19. Segment by Application – Global Graphics Add-in Board (AIB) Sales, (K Units), 2020-2025
Table 20. Segment by Application – Global Graphics Add-in Board (AIB) Sales, (K Units), 2026-2032
Table 21. By Region – Global Graphics Add-in Board (AIB) Revenue, (US$, Mn), 2025-2032
Table 22. By Region – Global Graphics Add-in Board (AIB) Revenue, (US$, Mn), 2020-2025
Table 23. By Region – Global Graphics Add-in Board (AIB) Revenue, (US$, Mn), 2026-2032
Table 24. By Region – Global Graphics Add-in Board (AIB) Sales, (K Units), 2020-2025
Table 25. By Region – Global Graphics Add-in Board (AIB) Sales, (K Units), 2026-2032
Table 26. By Country – North America Graphics Add-in Board (AIB) Revenue, (US$, Mn), 2020-2025
Table 27. By Country – North America Graphics Add-in Board (AIB) Revenue, (US$, Mn), 2026-2032
Table 28. By Country – North America Graphics Add-in Board (AIB) Sales, (K Units), 2020-2025
Table 29. By Country – North America Graphics Add-in Board (AIB) Sales, (K Units), 2026-2032
Table 30. By Country – Europe Graphics Add-in Board (AIB) Revenue, (US$, Mn), 2020-2025
Table 31. By Country – Europe Graphics Add-in Board (AIB) Revenue, (US$, Mn), 2026-2032
Table 32. By Country – Europe Graphics Add-in Board (AIB) Sales, (K Units), 2020-2025
Table 33. By Country – Europe Graphics Add-in Board (AIB) Sales, (K Units), 2026-2032
Table 34. By Region – Asia Graphics Add-in Board (AIB) Revenue, (US$, Mn), 2020-2025
Table 35. By Region – Asia Graphics Add-in Board (AIB) Revenue, (US$, Mn), 2026-2032
Table 36. By Region – Asia Graphics Add-in Board (AIB) Sales, (K Units), 2020-2025
Table 37. By Region – Asia Graphics Add-in Board (AIB) Sales, (K Units), 2026-2032
Table 38. By Country – South America Graphics Add-in Board (AIB) Revenue, (US$, Mn), 2020-2025
Table 39. By Country – South America Graphics Add-in Board (AIB) Revenue, (US$, Mn), 2026-2032
Table 40. By Country – South America Graphics Add-in Board (AIB) Sales, (K Units), 2020-2025
Table 41. By Country – South America Graphics Add-in Board (AIB) Sales, (K Units), 2026-2032
Table 42. By Country – Middle East & Africa Graphics Add-in Board (AIB) Revenue, (US$, Mn), 2020-2025
Table 43. By Country – Middle East & Africa Graphics Add-in Board (AIB) Revenue, (US$, Mn), 2026-2032
Table 44. By Country – Middle East & Africa Graphics Add-in Board (AIB) Sales, (K Units), 2020-2025
Table 45. By Country – Middle East & Africa Graphics Add-in Board (AIB) Sales, (K Units), 2026-2032
Table 46. Advanced Micro Devices Inc. Company Summary
Table 47. Advanced Micro Devices Inc. Graphics Add-in Board (AIB) Product Offerings
Table 48. Advanced Micro Devices Inc. Graphics Add-in Board (AIB) Sales (K Units), Revenue (US$, Mn) and Average Price (US$/Unit) & (2020-2025)
Table 49. Advanced Micro Devices Inc. Key News & Latest Developments
Table 50. AsusTek Computer Inc. Company Summary
Table 51. AsusTek Computer Inc. Graphics Add-in Board (AIB) Product Offerings
Table 52. AsusTek Computer Inc. Graphics Add-in Board (AIB) Sales (K Units), Revenue (US$, Mn) and Average Price (US$/Unit) & (2020-2025)
Table 53. AsusTek Computer Inc. Key News & Latest Developments
Table 54. EVGA Corporation Company Summary
Table 55. EVGA Corporation Graphics Add-in Board (AIB) Product Offerings
Table 56. EVGA Corporation Graphics Add-in Board (AIB) Sales (K Units), Revenue (US$, Mn) and Average Price (US$/Unit) & (2020-2025)
Table 57. EVGA Corporation Key News & Latest Developments
Table 58. Gigabyte Technology Co. Ltd. Company Summary
Table 59. Gigabyte Technology Co. Ltd. Graphics Add-in Board (AIB) Product Offerings
Table 60. Gigabyte Technology Co. Ltd. Graphics Add-in Board (AIB) Sales (K Units), Revenue (US$, Mn) and Average Price (US$/Unit) & (2020-2025)
Table 61. Gigabyte Technology Co. Ltd. Key News & Latest Developments
Table 62. Intel Corporation Company Summary
Table 63. Intel Corporation Graphics Add-in Board (AIB) Product Offerings
Table 64. Intel Corporation Graphics Add-in Board (AIB) Sales (K Units), Revenue (US$, Mn) and Average Price (US$/Unit) & (2020-2025)
Table 65. Intel Corporation Key News & Latest Developments
Table 66. Matrox Company Summary
Table 67. Matrox Graphics Add-in Board (AIB) Product Offerings
Table 68. Matrox Graphics Add-in Board (AIB) Sales (K Units), Revenue (US$, Mn) and Average Price (US$/Unit) & (2020-2025)
Table 69. Matrox Key News & Latest Developments
Table 70. Micro-Star International Co. Company Summary
Table 71. Micro-Star International Co. Graphics Add-in Board (AIB) Product Offerings
Table 72. Micro-Star International Co. Graphics Add-in Board (AIB) Sales (K Units), Revenue (US$, Mn) and Average Price (US$/Unit) & (2020-2025)
Table 73. Micro-Star International Co. Key News & Latest Developments
Table 74. Nvidia Corporation Company Summary
Table 75. Nvidia Corporation Graphics Add-in Board (AIB) Product Offerings
Table 76. Nvidia Corporation Graphics Add-in Board (AIB) Sales (K Units), Revenue (US$, Mn) and Average Price (US$/Unit) & (2020-2025)
Table 77. Nvidia Corporation Key News & Latest Developments
Table 78. Sapphire Technology Company Summary
Table 79. Sapphire Technology Graphics Add-in Board (AIB) Product Offerings
Table 80. Sapphire Technology Graphics Add-in Board (AIB) Sales (K Units), Revenue (US$, Mn) and Average Price (US$/Unit) & (2020-2025)
Table 81. Sapphire Technology Key News & Latest Developments
Table 82. ZOTAC(PC Partner Limited) Company Summary
Table 83. ZOTAC(PC Partner Limited) Graphics Add-in Board (AIB) Product Offerings
Table 84. ZOTAC(PC Partner Limited) Graphics Add-in Board (AIB) Sales (K Units), Revenue (US$, Mn) and Average Price (US$/Unit) & (2020-2025)
Table 85. ZOTAC(PC Partner Limited) Key News & Latest Developments
Table 86. Graphics Add-in Board (AIB) Capacity of Key Manufacturers in Global Market, 2023-2025 (K Units)
Table 87. Global Graphics Add-in Board (AIB) Capacity Market Share of Key Manufacturers, 2023-2025
Table 88. Global Graphics Add-in Board (AIB) Production by Region, 2020-2025 (K Units)
Table 89. Global Graphics Add-in Board (AIB) Production by Region, 2026-2032 (K Units)
Table 90. Graphics Add-in Board (AIB) Market Opportunities & Trends in Global Market
Table 91. Graphics Add-in Board (AIB) Market Drivers in Global Market
Table 92. Graphics Add-in Board (AIB) Market Restraints in Global Market
Table 93. Graphics Add-in Board (AIB) Raw Materials
Table 94. Graphics Add-in Board (AIB) Raw Materials Suppliers in Global Market
Table 95. Typical Graphics Add-in Board (AIB) Downstream
Table 96. Graphics Add-in Board (AIB) Downstream Clients in Global Market
Table 97. Graphics Add-in Board (AIB) Distributors and Sales Agents in Global Market

List of Figures
Figure 1. Graphics Add-in Board (AIB) Product Picture
Figure 2. Graphics Add-in Board (AIB) Segment by Type in 2024
Figure 3. Graphics Add-in Board (AIB) Segment by Application in 2024
Figure 4. Global Graphics Add-in Board (AIB) Market Overview: 2024
Figure 5. Key Caveats
Figure 6. Global Graphics Add-in Board (AIB) Market Size: 2024 VS 2032 (US$, Mn)
Figure 7. Global Graphics Add-in Board (AIB) Revenue: 2026-2034 (US$, Mn)
Figure 8. Graphics Add-in Board (AIB) Sales in Global Market: 2026-2034 (K Units)
Figure 9. The Top 3 and 5 Players Market Share by Graphics Add-in Board (AIB) Revenue in 2024
Figure 10. Segment by Type – Global Graphics Add-in Board (AIB) Revenue, (US$, Mn), 2024 & 2032
Figure 11. Segment by Type – Global Graphics Add-in Board (AIB) Revenue Market Share, 2026-2034
Figure 12. Segment by Type – Global Graphics Add-in Board (AIB) Sales Market Share, 2026-2034
Figure 13. Segment by Type – Global Graphics Add-in Board (AIB) Price (US$/Unit), 2026-2034
Figure 14. Segment by Application – Global Graphics Add-in Board (AIB) Revenue, (US$, Mn), 2024 & 2032
Figure 15. Segment by Application – Global Graphics Add-in Board (AIB) Revenue Market Share, 2026-2034
Figure 16. Segment by Application – Global Graphics Add-in Board (AIB) Sales Market Share, 2026-2034
Figure 17. Segment by Application -Global Graphics Add-in Board (AIB) Price (US$/Unit), 2026-2034
Figure 18. By Region – Global Graphics Add-in Board (AIB) Revenue, (US$, Mn), 2025 & 2032
Figure 19. By Region – Global Graphics Add-in Board (AIB) Revenue Market Share, 2020 VS 2024 VS 2032
Figure 20. By Region – Global Graphics Add-in Board (AIB) Revenue Market Share, 2026-2034
Figure 21. By Region – Global Graphics Add-in Board (AIB) Sales Market Share, 2026-2034
Figure 22. By Country – North America Graphics Add-in Board (AIB) Revenue Market Share, 2026-2034
Figure 23. By Country – North America Graphics Add-in Board (AIB) Sales Market Share, 2026-2034
Figure 24. United States Graphics Add-in Board (AIB) Revenue, (US$, Mn), 2026-2034
Figure 25. Canada Graphics Add-in Board (AIB) Revenue, (US$, Mn), 2026-2034
Figure 26. Mexico Graphics Add-in Board (AIB) Revenue, (US$, Mn), 2026-2034
Figure 27. By Country – Europe Graphics Add-in Board (AIB) Revenue Market Share, 2026-2034
Figure 28. By Country – Europe Graphics Add-in Board (AIB) Sales Market Share, 2026-2034
Figure 29. Germany Graphics Add-in Board (AIB) Revenue, (US$, Mn), 2026-2034
Figure 30. France Graphics Add-in Board (AIB) Revenue, (US$, Mn), 2026-2034
Figure 31. U.K. Graphics Add-in Board (AIB) Revenue, (US$, Mn), 2026-2034
Figure 32. Italy Graphics Add-in Board (AIB) Revenue, (US$, Mn), 2026-2034
Figure 33. Russia Graphics Add-in Board (AIB) Revenue, (US$, Mn), 2026-2034
Figure 34. Nordic Countries Graphics Add-in Board (AIB) Revenue, (US$, Mn), 2026-2034
Figure 35. Benelux Graphics Add-in Board (AIB) Revenue, (US$, Mn), 2026-2034
Figure 36. By Region – Asia Graphics Add-in Board (AIB) Revenue Market Share, 2026-2034
Figure 37. By Region – Asia Graphics Add-in Board (AIB) Sales Market Share, 2026-2034
Figure 38. China Graphics Add-in Board (AIB) Revenue, (US$, Mn), 2026-2034
Figure 39. Japan Graphics Add-in Board (AIB) Revenue, (US$, Mn), 2026-2034
Figure 40. South Korea Graphics Add-in Board (AIB) Revenue, (US$, Mn), 2026-2034
Figure 41. Southeast Asia Graphics Add-in Board (AIB) Revenue, (US$, Mn), 2026-2034
Figure 42. India Graphics Add-in Board (AIB) Revenue, (US$, Mn), 2026-2034
Figure 43. By Country – South America Graphics Add-in Board (AIB) Revenue Market Share, 2026-2034
Figure 44. By Country – South America Graphics Add-in Board (AIB) Sales, Market Share, 2026-2034
Figure 45. Brazil Graphics Add-in Board (AIB) Revenue, (US$, Mn), 2026-2034
Figure 46. Argentina Graphics Add-in Board (AIB) Revenue, (US$, Mn), 2026-2034
Figure 47. By Country – Middle East & Africa Graphics Add-in Board (AIB) Revenue, Market Share, 2026-2034
Figure 48. By Country – Middle East & Africa Graphics Add-in Board (AIB) Sales, Market Share, 2026-2034
Figure 49. Turkey Graphics Add-in Board (AIB) Revenue, (US$, Mn), 2026-2034
Figure 50. Israel Graphics Add-in Board (AIB) Revenue, (US$, Mn), 2026-2034
Figure 51. Saudi Arabia Graphics Add-in Board (AIB) Revenue, (US$, Mn), 2026-2034
Figure 52. UAE Graphics Add-in Board (AIB) Revenue, (US$, Mn), 2026-2034
Figure 53. Global Graphics Add-in Board (AIB) Production Capacity (K Units), 2026-2034
Figure 54. The Percentage of Production Graphics Add-in Board (AIB) by Region, 2024 VS 2032
Figure 55. Graphics Add-in Board (AIB) Industry Value Chain
Figure 56. Marketing Channels