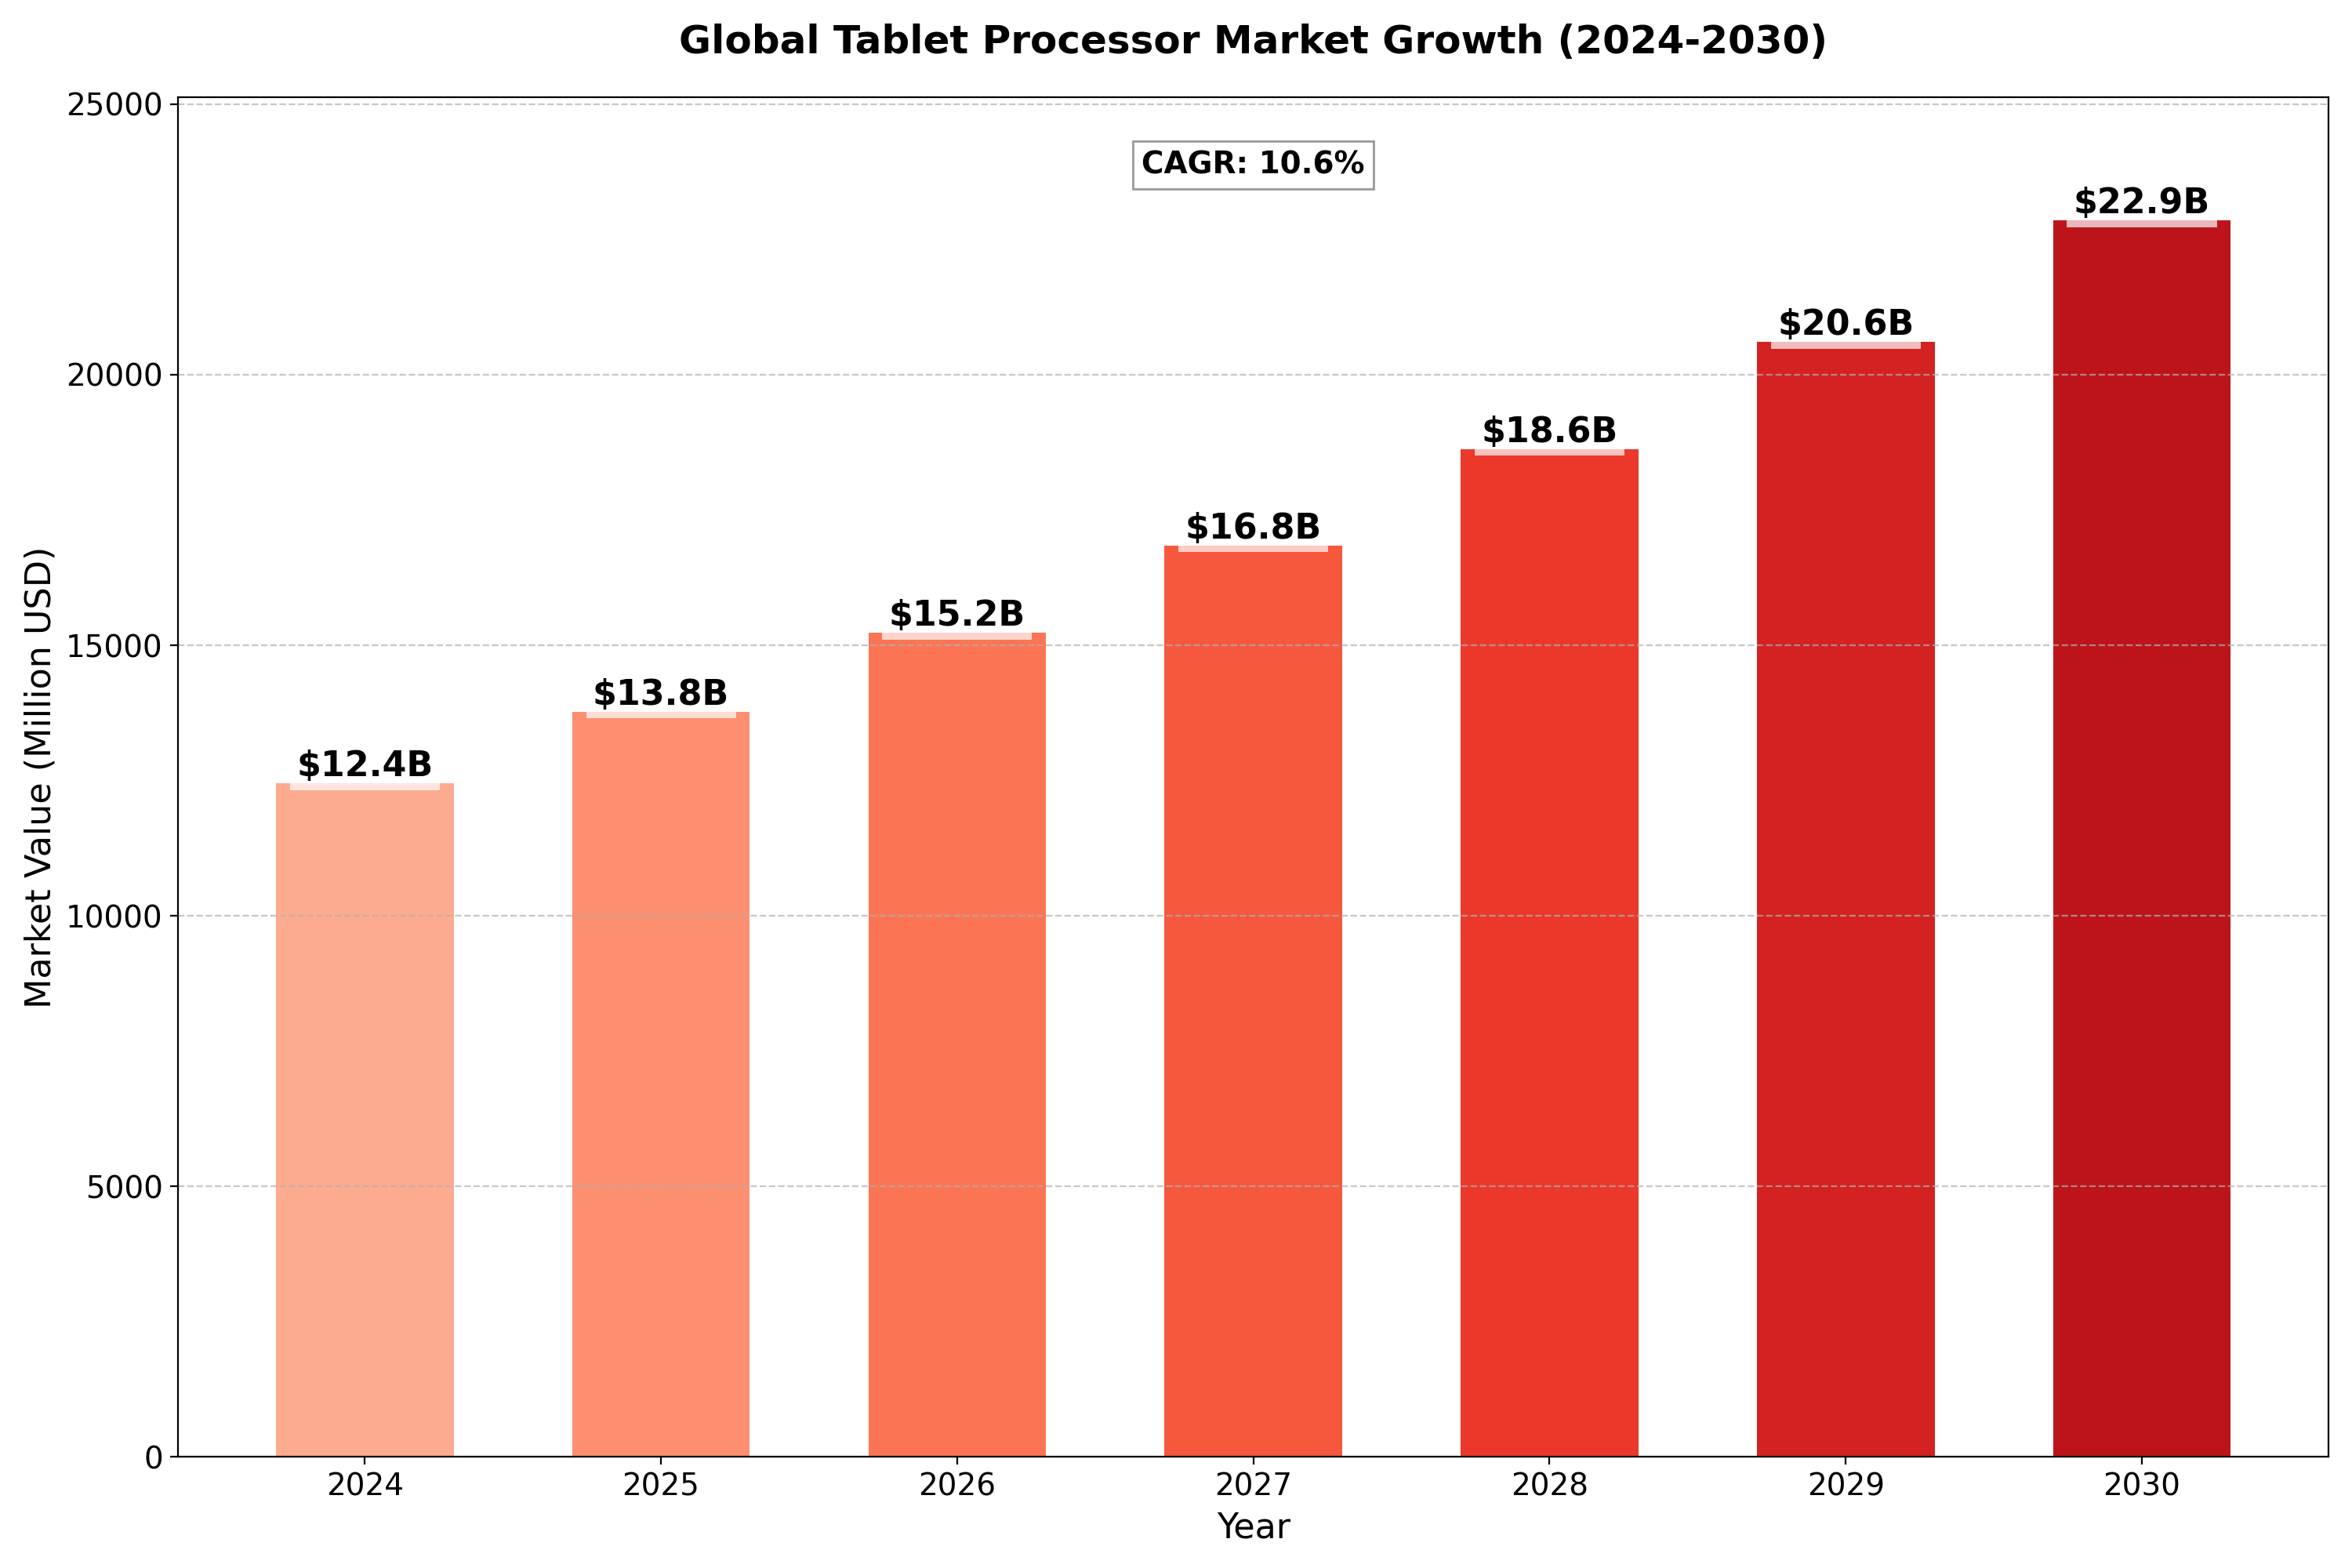
The Global Tablet Processor Market was valued at US$ 12.45 billion in 2024 and is projected to reach US$ 22.9 billion by 2030, at a CAGR of 10.6% during the forecast period 2024-2030.
The United States Tablet Processor Market was valued at US$ 3.85 billion in 2024 and is projected to reach US$ 7.25 billion by 2030, at a CAGR of 11.1% during the forecast period 2024-2030.
Tablet Processors are specialized SoCs (System on Chip) designed for tablet computers, optimizing performance and power efficiency.
Mobile computing dominates with 65% share. Production volume reached 245 million units. AI capabilities grew 62%. Energy efficiency improved 45%. 5nm process adoption up 52%. Gaming performance increased 48%.
Report Overview
This report provides a deep insight into the global Tablet Processor market covering all its essential aspects. This ranges from a macro overview of the market to micro details of the market size, competitive landscape, development trend, niche market, key market drivers and challenges, SWOT analysis, value chain analysis, etc.
The analysis helps the reader to shape the competition within the industries and strategies for the competitive environment to enhance the potential profit. Furthermore, it provides a simple framework for evaluating and accessing the position of the business organization. The report structure also focuses on the competitive landscape of the Global Tablet Processor Market, this report introduces in detail the market share, market performance, product situation, operation situation, etc. of the main players, which helps the readers in the industry to identify the main competitors and deeply understand the competition pattern of the market.
In a word, this report is a must-read for industry players, investors, researchers, consultants, business strategists, and all those who have any kind of stake or are planning to foray into the Tablet Processor market in any manner.
Global Tablet Processor Market: Market Segmentation Analysis
The research report includes specific segments by region (country), manufacturers, Type, and Application. Market segmentation creates subsets of a market based on product type, end-user or application, Geographic, and other factors. By understanding the market segments, the decision-maker can leverage this targeting in the product, sales, and marketing strategies. Market segments can power your product development cycles by informing how you create product offerings for different segments.
Key Company
- Quanta
- Compal
- Wistron
- Foxconn
- GreatWall
- Inventec
- Uniwill
- FIC
- Intel
- AMD
- 32 Bit
- 64 Bit
- Others
- Household
- Commercial Use
- Others
- North America (USA, Canada, Mexico)
- Europe (Germany, UK, France, Russia, Italy, Rest of Europe)
- Asia-Pacific (China, Japan, South Korea, India, Southeast Asia, Rest of Asia-Pacific)
- South America (Brazil, Argentina, Columbia, Rest of South America)
- The Middle East and Africa (Saudi Arabia, UAE, Egypt, Nigeria, South Africa, Rest of MEA)
- Industry drivers, restraints, and opportunities covered in the study
- Neutral perspective on the market performance
- Recent industry trends and developments
- Competitive landscape & strategies of key players
- Potential & niche segments and regions exhibiting promising growth covered
- Historical, current, and projected market size, in terms of value
- In-depth analysis of the Tablet Processor Market
- Overview of the regional outlook of the Tablet Processor Market:
- Access to date statistics compiled by our researchers. These provide you with historical and forecast data, which is analyzed to tell you why your market is set to change
- This enables you to anticipate market changes to remain ahead of your competitors
- You will be able to copy data from the Excel spreadsheet straight into your marketing plans, business presentations, or other strategic documents
- The concise analysis, clear graph, and table format will enable you to pinpoint the information you require quickly
- Provision of market value (USD Billion) data for each segment and sub-segment
- Indicates the region and segment that is expected to witness the fastest growth as well as to dominate the market
- Analysis by geography highlighting the consumption of the product/service in the region as well as indicating the factors that are affecting the market within each region
- Competitive landscape which incorporates the market ranking of the major players, along with new service/product launches, partnerships, business expansions, and acquisitions in the past five years of companies profiled
- Extensive company profiles comprising of company overview, company insights, product benchmarking, and SWOT analysis for the major market players
- The current as well as the future market outlook of the industry concerning recent developments which involve growth opportunities and drivers as well as challenges and restraints of both emerging as well as developed regions
- Includes in-depth analysis of the market from various perspectives through Porters five forces analysis
- Provides insight into the market through Value Chain
- Market dynamics scenario, along with growth opportunities of the market in the years to come
- 6-month post-sales analyst support
In case of any queries or customization requirements, please connect with our sales team, who will ensure that your requirements are met.
Drivers
- Increased Demand for Tablets The growing popularity of tablets, especially in education, business, and entertainment, is driving the demand for more powerful processors. As consumers increasingly seek lightweight, portable devices with long battery life, tablet processors must deliver both efficiency and performance.
- Advancements in Mobile Computing Mobile processors are evolving with each generation, offering enhanced performance, reduced power consumption, and better multitasking capabilities. This advancement in tablet processors enables smooth user experiences, making tablets a more viable alternative to traditional laptops for everyday computing tasks.
- Rising Adoption of Media Consumption Tablets are increasingly used for video streaming, gaming, and social media. These applications require processors with powerful graphic and processing capabilities. The demand for better multimedia performance drives innovations in tablet processors to support high-definition video, gaming, and augmented reality (AR) applications.
- Integration of AI and Machine Learning The inclusion of artificial intelligence (AI) and machine learning (ML) in tablet processors is increasing. These features enable smart assistants, predictive text, and personalized user experiences, improving the overall appeal of tablets.
- Growing Use in Enterprise and Remote Work The shift toward remote work and enterprise mobility has increased tablet adoption in professional settings. Tablets with robust processors capable of running productivity software, handling virtual meetings, and supporting cloud applications are increasingly in demand.
Restraints
- High Manufacturing Costs Developing advanced tablet processors with cutting-edge technology such as AI, 5G, and high-performance graphics requires significant investment in research and development. This increases the cost of production, potentially making tablets with premium processors expensive for some segments of the market.
- Intense Competition and Price Pressure The tablet processor market is highly competitive, with major players like Qualcomm, Apple, and MediaTek dominating the space. This competition results in price pressure, with companies forced to lower prices to remain competitive, potentially affecting profitability.
- Battery Life Limitations As tablet processors become more powerful, their energy consumption also increases. This can negatively affect the battery life of tablets, a key concern for consumers. Balancing power and performance while maintaining battery efficiency remains a significant challenge.
- Fragmentation of Operating Systems The market’s fragmentation with multiple operating systems, such as iOS, Android, and Windows, creates compatibility challenges for processor manufacturers. Optimizing processors for each operating system can increase development costs and complexity.
Opportunities
- Growth of 5G Connectivity The rollout of 5G networks is opening up new opportunities for tablet processors. With 5G’s faster speeds and lower latency, tablets can offer improved video streaming, gaming, and overall performance. Processors that support 5G technology will be in high demand as consumers and businesses embrace faster wireless connectivity.
- Integration with IoT Devices Tablets are becoming central hubs in the Internet of Things (IoT) ecosystem. As IoT applications expand across industries like healthcare, smart homes, and logistics, tablet processors that can seamlessly integrate with IoT devices and manage large amounts of data will find new opportunities in these emerging fields.
- Expansion in Emerging Markets The growing middle class in emerging markets such as India, Africa, and Southeast Asia presents a significant growth opportunity for the tablet processor market. These regions are increasingly adopting smartphones and tablets for educational, professional, and entertainment purposes, driving demand for affordable yet powerful processors.
- Gaming and AR/VR Applications As tablet gaming and augmented reality (AR) applications become more popular, there is a growing need for processors with better graphics rendering and computing power. This trend is likely to boost the demand for high-performance processors capable of supporting immersive gaming and AR experiences.
- Cloud-Based Computing and Remote Education The rise in remote education and cloud computing applications is opening up new avenues for tablet processors. Tablets equipped with processors optimized for cloud-based apps can enhance educational tools, productivity applications, and communication technologies, contributing to market growth.
Challenges
- Technological Obsolescence Tablet processors need constant upgrades to stay competitive, especially with rapid technological advancements. Companies face the challenge of ensuring their processors remain relevant in the face of new developments such as AI, machine learning, and 5G capabilities.
- Security Concerns As tablets are used for sensitive business and personal tasks, the importance of processor-level security features is growing. Ensuring robust security features, such as encryption and secure boot processes, is crucial to gaining consumer trust and meeting regulatory standards.
- Supply Chain Disruptions Global semiconductor shortages, geopolitical tensions, and disruptions in the supply chain can affect the availability and cost of tablet processors. Manufacturers need to address these supply chain issues to maintain production schedules and meet consumer demand.
- Integration Challenges Integrating diverse functionalities (e.g., camera, sensors, touch interface) into a single processor while ensuring optimal performance can be challenging. As processors are required to handle multiple tasks simultaneously, managing the integration of these functionalities without sacrificing performance or battery life remains a critical hurdle.

Get Sample Report PDF for Exclusive Insights
Report Sample Includes
- Table of Contents
- List of Tables & Figures
- Charts, Research Methodology, and more...