Key Statistics
Key Takeaways
- Market trajectory: The global silicon photonic device market reached USD 3,075 million in 2026 and is projected to reach USD 24,770 million by 2036 at 23.2% CAGR over 2027–2036. Demand follows the actual sale of silicon photonic modulators, germanium-on-silicon detectors, passive waveguides, ring resonators, grating couplers and hybrid silicon laser coupling as integrated optical circuit building blocks, rather than the full revenue of adjacent digital infrastructure.
- Active leadership: Active has the largest estimated type share at ~62% in 2026. The fastest-growing type is Active, at ~25.2% CAGR from an estimated ~62% share. Active silicon photonic devices implement electrical-to-optical modulation, optical reception or phase control, often using silicon PN junction modulators, germanium-on-silicon photodiodes and separate InP laser sources. Their value reflects higher interface complexity, fast lane speeds, external drive electronics and testing requirements.
- Telecommunications demand: Telecommunications leads application revenue at an estimated ~57% in 2026, while Telecommunications grows most rapidly near ~24.3% CAGR. Carrier optical transport, high-speed transceivers and AI data-center connectivity account for most device revenue, including 800G and 1.6T modules. Silicon PICs reduce module device count while requiring validated lasers, link budgeting and thermal performance; not every optical module deployed by a carrier uses silicon photonics.
- Asia-Pacific position: Asia-Pacific represents the largest regional revenue pool at an estimated ~44% in 2026. Asia-Pacific has the highest regional modeled growth at ~25.4% CAGR. Singapore plays a foundry and process-integration role, Japan is investing in 300mm silicon photonics, while Chinese and South Korean systems manufacturers increasingly source optical engines and chiplets for dense interconnection. Packaging and testing relationships can be as important to local silicon-photonics demand as the wafer process itself.
- Principal constraint: Photonics packaging and fiber-coupling costs is a fundamental restraint. Purchase decisions are also affected by integration of external laser materials. Both conditions limit the speed at which a promising optical product can move into enduring installations; careful lifecycle support remains vital, specifically for silicon-device suppliers evaluating active or passive integrated optical products. For adoption barriers in 2027, the purchase decision depends on explicit equipment interoperability, verifiable device performance and whether the supplier can sustain replacement support throughout the planned service interval.
Silicon Photonic Device Market Overview
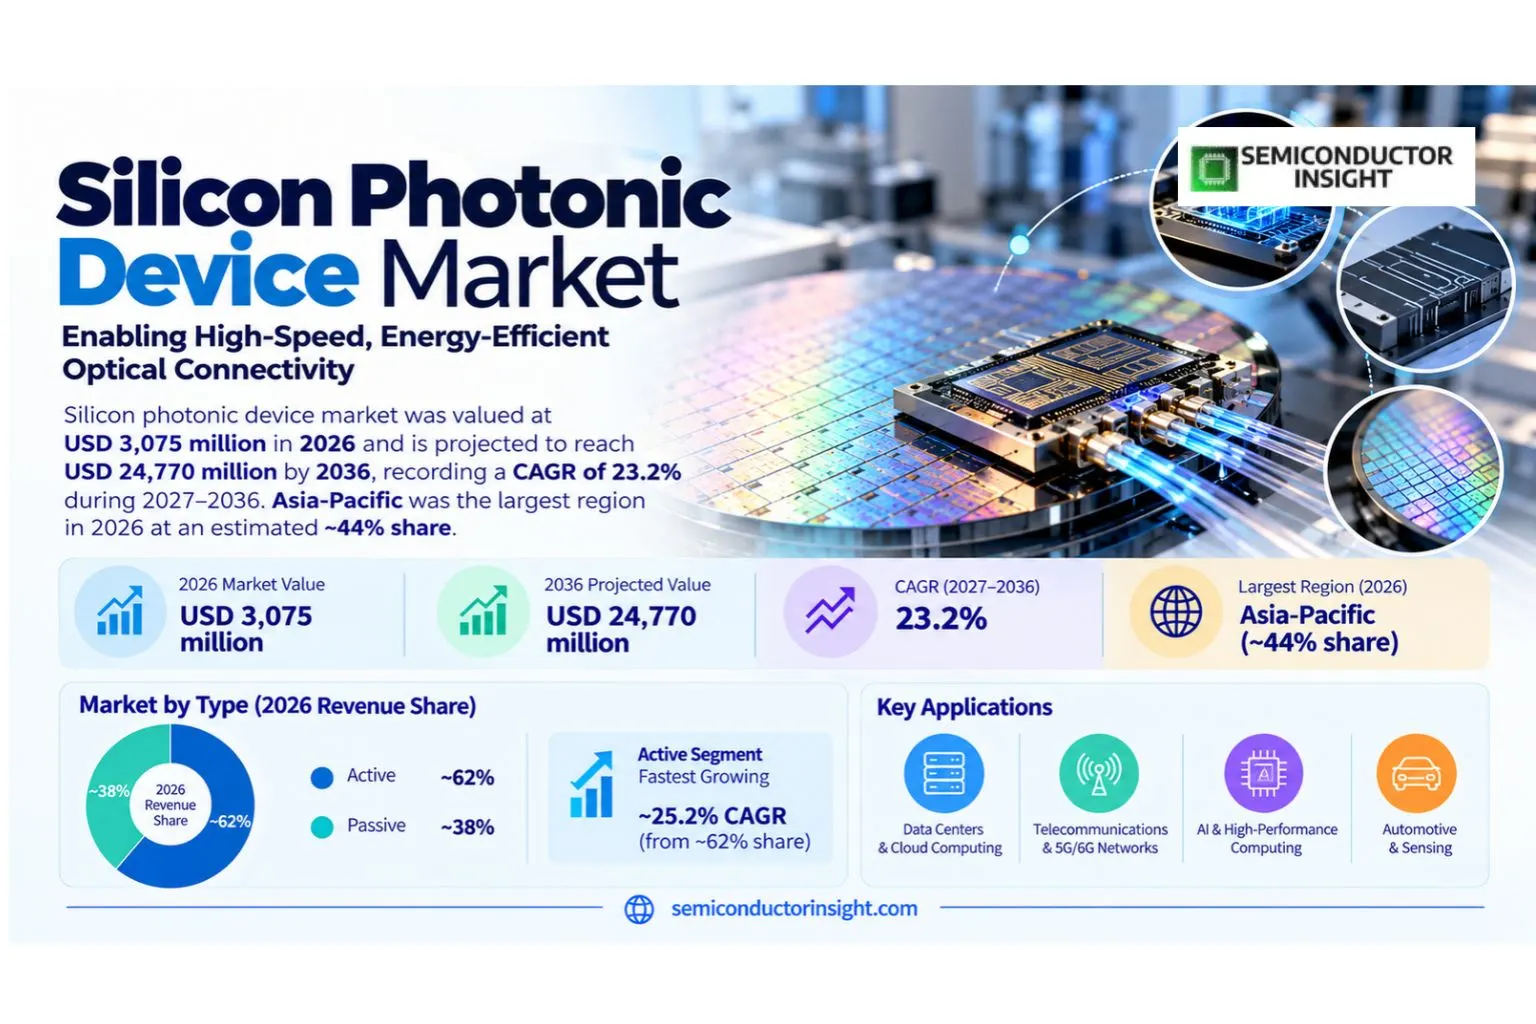
Silicon photonic device market was valued at USD 3,075 million in 2026 and is projected to reach USD 24,770 million by 2036, recording a CAGR of 23.2% during 2027–2036. Asia-Pacific was the largest region in 2026 at an estimated ~44% share. The market centers on silicon photonic modulators, germanium-on-silicon detectors, passive waveguides, ring resonators, grating couplers and hybrid silicon laser coupling as integrated optical circuit building blocks.
A silicon photonic device manipulates light on a silicon semiconductor substrate using structures such as waveguides, grating couplers, modulators, germanium photodetectors and wavelength-selective resonators. Active devices perform modulation, reception or tunable photonic functions, whereas passive devices guide, distribute or couple optical signals without requiring the same active electronic driving chain. The distinction matters commercially because performance, packaging and validation costs differ substantially among these device families.
The defined industry boundary includes silicon-platform active and passive optoelectronic devices sold as chips, optical-engine assemblies or independently priced photonic components, including silicon modulators, germanium photodetectors, waveguides and coupling structures; excludes complete routers, AI accelerators, fibre installation and merchant foundry services counted separately. This distinction prevents a finished datacenter, networking service or unrelated electronic product from being mistaken for direct sales of the specialized device. Device vendor comparisons are meaningful only when the invoiced product and its value contribution fall within the stated market boundary.
Modern integrated silicon photonics circuits connect optical waveguides to fast electronic drivers, transimpedance amplifiers and external light sources through co-designed packages. Low optical coupling loss is critical because each additional decibel increases laser output power requirements or reduces link margin. Design teams evaluate insertion loss, modulation speed, photodiode responsivity and thermal response alongside package yield. The advance from 800G to 1.6T—and early 3.2T demonstrations—is raising the industry value of active silicon photonic devices.
STMicroelectronics announced high-volume 300mm silicon PIC100 production in March 2026 for 800G and 1.6T optical transceivers, demonstrating that integrated modulators and receivers can move beyond prototype quantities. At OFC 2026, Coherent described a 400G-per-lane silicon PN-junction modulator pathway and multiple co-packaged optical architectures. Imec presented a 100GHz germanium-on-silicon avalanche detector later in September. These developments indicate rising active-device capabilities, without implying every announced speed class has already reached volume shipments.
Technology priorities are evolving toward more reliable and serviceable optical architectures. Active silicon photonic devices implement electrical-to-optical modulation, optical reception or phase control, often using silicon PN junction modulators, germanium-on-silicon photodiodes and separate InP laser sources, particularly when industry product planning depends on optical insertion-loss testing and documented yield controls. Their value reflects higher interface complexity, fast lane speeds, external drive electronics and testing requirements, particularly when industry product planning depends on optical insertion-loss testing and documented yield controls. The industry challenge is to turn those engineering characteristics into repeat purchasing, while addressing loss of interoperability, changing interfaces and the long-term economics of support.
Segment Analysis: By Type
By type, the silicon photonic device market comprises Active, Passive. Active leads with an estimated ~62% revenue share in 2026; Active expands most rapidly at about ~25.2% CAGR from a ~62% share. Different physical designs lead to different vendors, levels of validation and possible expansion rates. In the type overview setting, an engineering advantage becomes a sale only after purchasing teams review validation evidence, inventory risk, maintenance requirements and the operating economics of the intended deployment.
| Type | Function | Market position |
|---|---|---|
| Active | Active silicon photonic devices implement electrical-to-optical modulation, optical reception or phase control, often using silicon PN junction modulators, germanium-on-silicon photodiodes and separate InP laser sources, which makes Active sensitive to engineering design changes and device lead times. Their value reflects higher interface complexity, fast lane speeds, external drive electronics and testing requirements, which makes Active sensitive to engineering design changes and device lead times. Each product specification maps to a different material bill, operating environment and validation procedure. Device vendors therefore need to establish how the Active variant affects installation requirements and ongoing service. | Estimated ~62% of 2026 revenue and ~25.2% CAGR. Active is the largest type by value, with demand linked to the particular requirements of its purchasers. Active silicon photonic devices implement electrical-to-optical modulation, optical reception or phase control, often using silicon PN junction modulators, germanium-on-silicon photodiodes and separate InP laser sources, where the economics of Active reflect vendor validation and integration tolerances. Their value reflects higher interface complexity, fast lane speeds, external drive electronics and testing requirements, where the economics of Active reflect vendor validation and integration tolerances. Procurement teams evaluate device availability, unit cost and the necessary test records. |
| Passive | Passive devices guide, split, route or couple light using etched silicon waveguides, multimode interferometers, resonators and grating couplers. These structures are essential to dense optical circuits but typically carry lower individual selling values than integrated active transmission and detection elements. Each product specification maps to a different material bill, operating environment and validation procedure, since equipment purchasers evaluate Passive against validation risk and long-term fabrication support. Device vendors therefore need to establish how the Passive variant affects installation requirements and ongoing service. | Estimated ~38% of 2026 revenue and ~19.2% CAGR. Passive is a distinct product category, with demand linked to the particular requirements of its purchasers. Passive devices guide, split, route or couple light using etched silicon waveguides, multimode interferometers, resonators and grating couplers, since equipment purchasers evaluate Passive against validation risk and long-term fabrication support. These structures are essential to dense optical circuits but typically carry lower individual selling values than integrated active transmission and detection elements, since equipment purchasers evaluate Passive against validation risk and long-term fabrication support. Procurement teams evaluate device availability, unit cost and the necessary test records, since equipment purchasers evaluate Passive against validation risk and long-term fabrication support. |
Segment Analysis: By Application
Application segments are Telecommunications, Medical, Defense, Consumer Electronics, Others. Telecommunications takes the largest estimated 2026 revenue share at ~57%, whereas Telecommunications is the fastest-growing application at ~24.3% CAGR. Channel structure, end-user servicing needs and purchasing cadence create distinct addressable opportunities despite shared underlying optical technologies, specifically for silicon-device suppliers evaluating active or passive integrated optical products. This matters for application overview, because the technically feasible option must also be installable, serviceable and properly documented across the operating life of the equipment and its supporting software.
| Application | Demand characteristics |
|---|---|
| Telecommunications | Estimated ~57% of 2026 revenue and ~24.3% CAGR. The leading telecom application combines carrier optical links with datacenter-scale interconnects; faster 800G and 1.6T optics increase reliance on validated silicon PICs. Silicon PICs reduce module device count while requiring validated lasers, link budgeting and thermal performance; not every optical module deployed by a carrier uses silicon photonics, since equipment purchasers evaluate Telecommunications against validation risk and long-term fabrication support. Purchasers assess the entire cost of deploying and operating the optical function, including testability, compatible equipment and purchasing lead times. |
| Medical | Estimated ~12% of 2026 revenue and ~19.9% CAGR. Optical instruments can use photonic waveguides and detectors for interferometry, lab-on-chip sensing and spectroscopic analysis. The sale of a photonic device must remain separate from the price of a full diagnostic instrument, patient services or consumable reagent volumes. Purchasers assess the entire cost of deploying and operating the optical function, including testability, compatible equipment and purchasing lead times, since equipment purchasers evaluate Medical against validation risk and long-term fabrication support. |
| Defense | Estimated ~9% of 2026 revenue and ~20.9% CAGR. Rugged sensing, coherent optical links and specialized photonic processing motivate validation of silicon photonic components. Military requirements emphasize reliability, traceable materials and secure supply; broad defense communications spending is not a proxy for photonic device revenue. Purchasers assess the entire cost of deploying and operating the optical function, including testability, compatible equipment and purchasing lead times, which makes Defense sensitive to engineering design changes and device lead times. |
| Consumer Electronics | Estimated ~13% of 2026 revenue and ~23.3% CAGR. Miniaturized optical engines, structured-light interfaces and compact sensing may adopt silicon photonics selectively, but consumer designs have severe power, cost and packaging constraints. Many current products still rely on discrete VCSEL and camera components, making integration penetration uncertain. Purchasers assess the entire cost of deploying and operating the optical function, including testability, compatible equipment and purchasing lead times, where the economics of Consumer Electronics reflect vendor validation and integration tolerances. |
| Others | Estimated ~9% of 2026 revenue and ~21.6% CAGR. Scientific metrology, industrial sensing, quantum-photonics research and specialized optical monitoring use niche silicon photonic circuits. Prototypes may be technically promising but industry revenue is limited by long evaluation cycles, proprietary interfaces and fragmented customer specifications. Purchasers assess the entire cost of deploying and operating the optical function, including testability, compatible equipment and purchasing lead times, particularly as Others shifts to higher-density photonic assemblies and more demanding inspection. |
The industry channel is shaped by optical transceiver makers, telecom equipment product engineers, AI network integrators, sensing developers and specialist government purchasers buying photonic components. Direct equipment purchase, specialist distributor supply and OEM validation have different order economics. Volume can be won through stable specifications and documented reliability, while replacement sales depend on spare availability and retained interface interoperability over the 2027–2036 period.
Regional Analysis
Asia-Pacific leads global revenue with an estimated ~44% share in 2026. North America follows at ~24% and Europe at ~22%. Asia-Pacific has the fastest growth at ~25.4% CAGR. Regional purchases and supplier fabrication footprints must be distinguished for market comparisons. A industry evaluation of regional lead therefore compares the cost of validated materials, process yield, lead times, quality assurance and post-installation support rather than product specifications alone.
How do regional purchasing patterns differ in silicon photonic device?
Asia-Pacific: Singapore plays a foundry and process-integration role, Japan is investing in 300mm silicon photonics, while Chinese and South Korean systems manufacturers increasingly source optical engines and chiplets for dense interconnection. Packaging and testing relationships can be as important to local silicon-photonics demand as the wafer process itself, with the strongest implication for photonics fabrication appearing in device packaging and repeatability. North America: US hyperscaler purchasing influences chip architecture, photonic integrated circuit requirements and the timing of optical I/O design wins. Silicon-based modulators and photodetectors are selected alongside external laser technology. Canadian telecom and data infrastructure spending matters through purchases of integrated optical equipment rather than domestic silicon photonic wafer volumes. Europe has distinct validation and network compliance requirements; South America and the Middle East and Africa rely more heavily on imported products and local distribution service.
| Region | Position | Growth outlook | Demand profile | What decides supplier selection |
|---|---|---|---|---|
| Asia-Pacific | Largest (~44%) | ~25.4% CAGR | Singapore plays a foundry and process-integration role, Japan is investing in 300mm silicon photonics, while Chinese and South Korean systems manufacturers increasingly source optical engines and chiplets for dense interconnection, since equipment purchasers evaluate photonics fabrication against validation risk and long-term fabrication support. Packaging and testing relationships can be as important to local silicon-photonics demand as the wafer process itself, which makes photonics fabrication sensitive to engineering design changes and device lead times. Within Asia-Pacific, design wins may be awarded to chip producers offshore even when the finished optical equipment is installed locally, making customer validation and international logistics decisive industry factors. | Purchasers in Asia-Pacific require engineering fit, credible warranty conditions, appropriate import arrangements, and a validated local service path. For silicon photonic modulators, germanium-on-silicon detectors, passive waveguides, ring resonators, grating couplers and hybrid silicon laser coupling as integrated optical circuit building blocks, interface stability and the availability of replacement products can determine whether a promising order proceeds beyond initial evaluation. |
| North America | Second (~24%) | ~19.9% CAGR | US hyperscaler purchasing influences chip architecture, photonic integrated circuit requirements and the timing of optical I/O design wins. Silicon-based modulators and photodetectors are selected alongside external laser technology. Canadian telecom and data infrastructure spending matters through purchases of integrated optical equipment rather than domestic silicon photonic wafer volumes, since equipment purchasers evaluate photonics fabrication against validation risk and long-term fabrication support. Within North America, design wins may be awarded to chip producers offshore even when the finished optical equipment is installed locally, making customer validation and international logistics decisive industry factors. | Purchasers in North America require engineering fit, credible warranty conditions, appropriate import arrangements, and a validated local service path. For silicon photonic modulators, germanium-on-silicon detectors, passive waveguides, ring resonators, grating couplers and hybrid silicon laser coupling as integrated optical circuit building blocks, interface stability and the availability of replacement products can determine whether a promising order proceeds beyond initial evaluation, since equipment purchasers evaluate photonics fabrication against validation risk and long-term fabrication support. |
| Europe | Third (~22%) | ~22.1% CAGR | France supplies production-scale PIC100 silicon-photonics processing at STMicroelectronics, while Belgium and EU partners contribute research on integrated receivers, wafer-level testing and heterogeneous materials. German and British purchasers influence network equipment requirements. Europe is distinctively shaped by pilot-line fabrication access and platform integration roadmaps. Within Europe, design wins may be awarded to chip producers offshore even when the finished optical equipment is installed locally, making customer validation and international logistics decisive industry factors. | Purchasers in Europe require engineering fit, credible warranty conditions, appropriate import arrangements, and a validated local service path. For silicon photonic modulators, germanium-on-silicon detectors, passive waveguides, ring resonators, grating couplers and hybrid silicon laser coupling as integrated optical circuit building blocks, interface stability and the availability of replacement products can determine whether a promising order proceeds beyond initial evaluation, which makes photonics fabrication sensitive to engineering design changes and device lead times. |
| South America | Fourth (~5%) | ~21.7% CAGR | Brazil and Chile deploy optical networking and cloud connectivity infrastructure but source most integrated silicon photonic chip content through imported transceivers and switch platforms. Technological uptake depends on carrier replacement schedules, long-haul bandwidth planning and price/performance against direct-detect optics. Chip-module purchasing should not be confused with fibre infrastructure revenue. Within South America, design wins may be awarded to chip producers offshore even when the finished optical equipment is installed locally, making customer validation and international logistics decisive industry factors. | Purchasers in South America require engineering fit, credible warranty conditions, appropriate import arrangements, and a validated local service path. For silicon photonic modulators, germanium-on-silicon detectors, passive waveguides, ring resonators, grating couplers and hybrid silicon laser coupling as integrated optical circuit building blocks, interface stability and the availability of replacement products can determine whether a promising order proceeds beyond initial evaluation, where the economics of photonics fabrication reflect vendor validation and integration tolerances. |
| Middle East & Africa | Fifth (~5%) | ~21.7% CAGR | Gulf data-center investments can support higher-speed optics demand, while African carrier upgrades often prioritize reliable modular components and longer product support. Integrated photonic devices arrive within validated module and platform deliveries; local device fabrication remains constrained. The demand profile places greater weight on service and network build timing than wafer-level process innovation. Within Middle East & Africa, design wins may be awarded to chip producers offshore even when the finished optical equipment is installed locally, making customer validation and international logistics decisive industry factors. | Purchasers in Middle East & Africa require engineering fit, credible warranty conditions, appropriate import arrangements, and a validated local service path. For silicon photonic modulators, germanium-on-silicon detectors, passive waveguides, ring resonators, grating couplers and hybrid silicon laser coupling as integrated optical circuit building blocks, interface stability and the availability of replacement products can determine whether a promising order proceeds beyond initial evaluation, particularly as photonics fabrication shifts to higher-density photonic assemblies and more demanding inspection. |
Competitive Landscape
Competition is led by firms with relevant silicon photonic modulators, germanium-on-silicon detectors, passive waveguides, ring resonators, grating couplers and hybrid silicon laser coupling as integrated optical circuit building blocks. The competitive field includes established manufacturers, original equipment vendors and historical product brands whose present scope differs. Purchasers compare product-specific engineering evidence and order terms instead of total corporate turnover, because an optical device represents only part of a finished digital system.
Cisco Systems and Intel illustrate different capabilities within the sector. Their product portfolios, production locations and support arrangements cannot be assumed identical, specifically for silicon-device suppliers evaluating active or passive integrated optical products. Procurement departments typically request specification sheets, samples, aging or thermal data and a long-term sourcing plan before designating a fabrication source for a multi-year contract. The 2027–2036 opportunity in manufacturer capability is linked to deployment timing and customer acceptance, with supplier selection reflecting reliability, supply continuity, interface requirements and actual unit economics.
IBM, STMicroelectronics, Broadcom, Acacia, Finisar appear in the wider manufacturer and distributor field. The roles of those entities require separation: wafer fabrication, device integration, systems engineering and test operations do not produce the same category of invoice, specifically for silicon-device suppliers evaluating active or passive integrated optical products. Market rivalry occurs at the level of the particular sold device, not across unrelated corporate divisions, specifically for silicon-device suppliers evaluating active or passive integrated optical products.
Other vendors and historical business names include Huawei, Wuhan Research Institute of Posts and Telecommunications, Hisense Broadband Multimedia Technologies, Shandong Yunhai Guochuang. Legacy corporate names and regional branches may persist in industry directories, while actual current production must be checked against updated company disclosures, specifically for silicon-device suppliers evaluating active or passive integrated optical products. Product-life-cycle changes can alter sourcing validation even if an installed system continues to function with existing spare inventories.
For 2027–2036, vendor differentiation will depend on fabrication yield, documentation, reliable delivery and interoperability with demanding optical interfaces. Price competition may intensify in mature configurations, whereas improved wafer process controls or optical packaging designs offer specialized margins, specifically for silicon-device suppliers evaluating active or passive integrated optical products. A customer switching supplier must weigh requalification, sample validation and operational interruption against lower unit costs, specifically for silicon-device suppliers evaluating active or passive integrated optical products. For competitive economics in 2032, the purchase decision depends on explicit equipment interoperability, verifiable device performance and whether the supplier can sustain replacement support throughout the planned service interval.
Tier structure
| Tier | Companies | Basis of competition |
|---|---|---|
| Tier 1 | Cisco Systems; Intel; IBM | Direct manufacturers with published optical product or packaging activities differentiate through established process control and established engineering catalogs. The first engineering gate is the ability to supply silicon photonic modulators, germanium-on-silicon detectors, passive waveguides, ring resonators, grating couplers and hybrid silicon laser coupling as integrated optical circuit building blocks in a documented, reproducible format, followed by customer validation and reliable lead times. |
| Tier 2 | STMicroelectronics; Broadcom; Acacia; Finisar | Regional producers and equipment vendors compete through specialized configurations, responsive design assistance and local service. Purchasers generally request traceable quality records and samples in the exact form factor they need. Lower production scale can be balanced by shorter engineering response times or customization of critical interfaces, specifically for silicon-device suppliers evaluating active or passive integrated optical products. In the tier 2 setting, an engineering advantage becomes a sale only after purchasing teams review validation evidence, inventory risk, maintenance requirements and the operating economics of the intended deployment. |
| Tier 3 | Infinera; Luxtera; Hamamatsu; Juniper; Rockley Photonics; Reflex Photonics; Huawei; Wuhan Research Institute of Posts and Telecommunications; Hisense Broadband Multimedia Technologies; Shandong Yunhai Guochuang | The broader value chain includes historical participants, distributors, integrators and device companies with adjacent expertise. Their names may appear in sector coverage without establishing that each currently sells an identical validated device. Product applicability is determined by specific device families, production status and customer approvals, specifically for silicon-device suppliers evaluating active or passive integrated optical products. This matters for tier 3, because the technically feasible option must also be installable, serviceable and properly documented across the operating life of the equipment and its supporting software. |
Key companies profiled
- Cisco Systems
- Intel
- IBM
- STMicroelectronics
- Broadcom
- Acacia
- Finisar
- Infinera
- Luxtera
- Hamamatsu
- Juniper
- Rockley Photonics
- Reflex Photonics
- Huawei
- Wuhan Research Institute of Posts and Telecommunications
- Hisense Broadband Multimedia Technologies
- Shandong Yunhai Guochuang
Production Capacity Analysis
Production capacity relies on specialized fabrication and testing for silicon photonic modulators, germanium-on-silicon detectors, passive waveguides, ring resonators, grating couplers and hybrid silicon laser coupling as integrated optical circuit building blocks. Effective output is constrained by validated material lots, process yield, equipment availability and completion of electrical, optical and environmental tests. Announced industrial capability should not be equated automatically with installed sales or usable nameplate capacity, specifically for silicon-device suppliers evaluating active or passive integrated optical products.
Initial fabrication operations include silicon photonic modulators, germanium-on-silicon detectors, passive waveguides, ring resonators, grating couplers and hybrid silicon laser coupling as integrated optical circuit building blocks. Yield is influenced by each fabrication and assembly stage, while changes in materials or process equipment can require formal requalification, specifically for silicon-device suppliers evaluating active or passive integrated optical products. Japan, China and other Asia-Pacific fabrication centers support considerable supplier capacity, although customer purchasing decisions may originate elsewhere.
Diversified capacity can reduce country-of-origin exposure and help supply different validation requirements. However, transferring tooling and process knowledge between plants takes time, and products made in new locations may require fresh validation. Strong inventory controls and device traceability are important during a period of changing designs and volatile customer orders. A industry evaluation of capacity diversification therefore compares the cost of validated materials, process yield, lead times, quality assurance and post-installation support rather than product specifications alone.
Upstream constraints include materials, specialized assembly equipment and trained optical fabrication staff. For silicon photonic device, packaging, testing and maintenance infrastructure shape the ability to convert a engineering design into reproducible revenue. Companies should distinguish capacity for direct in-scope products from headline capacity for the much larger adjacent electronics fabrication market. The 2027–2036 opportunity in capacity bottlenecks is linked to deployment timing and customer acceptance, with supplier selection reflecting reliability, supply continuity, interface requirements and actual unit economics.
Market Dynamics
Demand is driven by 800g and 1.6t optical interface upgrades and energy per bit reduction in ai clusters. Growth depends on matching the optical product to validation requirements, logistics and total ownership cost. Device vendor economics also reflect the negative impact of photonics packaging and fiber-coupling costs, particularly when purchasers require long operational support.
MARKET DRIVERS
Drivers Impact Analysis*
| Driver | (~) % impact on CAGR forecast | Geographic relevance | Impact timeline |
|---|---|---|---|
| 800G and 1.6T optical interface upgrades | +1.8% | Asia-Pacific | 2027–2036 |
| Energy per bit reduction in AI clusters | +1.4% | Global | 2028–2034 |
| CMOS-compatible optical integration | +1.1% | North America | 2027–2031 |
| High-density optical I/O for switching | +0.9% | Europe | 2029–2036 |
| Expansion of photonic sensor architectures | +0.7% | Global | 2028–2035 |
800G and 1.6T optical interface upgrades
800G and 1.6T optical interface upgrades supports specialized purchases for silicon photonic device. silicon photonic modulators, germanium-on-silicon detectors, passive waveguides, ring resonators, grating couplers and hybrid silicon laser coupling as integrated optical circuit building blocks must be integrated into customer processes, inspected and supported. The growth effect is directional, not a separate addition to the headline CAGR, specifically for silicon-device suppliers evaluating active or passive integrated optical products. Actual adoption depends on confirmed orders, service requirements and the lifecycle of equipment already installed, specifically for silicon-device suppliers evaluating active or passive integrated optical products.
Energy per bit reduction in AI clusters
Energy per bit reduction in AI clusters supports specialized purchases for silicon photonic device. For active photonic receivers, validation includes detector responsivity, dark-current stability and the electrical transimpedance interface after module assembly. The growth effect is directional, not a separate addition to the headline CAGR, since equipment purchasers evaluate engineering adoption against validation risk and long-term fabrication support. Actual adoption depends on confirmed orders, service requirements and the lifecycle of equipment already installed, since equipment purchasers evaluate engineering adoption against validation risk and long-term fabrication support.
CMOS-compatible optical integration
CMOS-compatible optical integration supports specialized purchases for silicon photonic device. For passive optical routing, process checks focus on waveguide propagation loss, coupling alignment and temperature-dependent spectral response over the product life. The growth effect is directional, not a separate addition to the headline CAGR, which makes engineering adoption sensitive to engineering design changes and device lead times. Actual adoption depends on confirmed orders, service requirements and the lifecycle of equipment already installed, which makes engineering adoption sensitive to engineering design changes and device lead times.
High-density optical I/O for switching
High-density optical I/O for switching supports specialized purchases for silicon photonic device. In integrated transmitter circuits, engineering validation must cover modulator extinction ratio, driver bandwidth and laser coupling under worst-case operating conditions. The growth effect is directional, not a separate addition to the headline CAGR, where the economics of engineering adoption reflect vendor validation and integration tolerances. Actual adoption depends on confirmed orders, service requirements and the lifecycle of equipment already installed, where the economics of engineering adoption reflect vendor validation and integration tolerances.
MARKET RESTRAINTS
Restraints Impact Analysis*
| Restraint | (~) % impact on CAGR forecast | Geographic relevance | Impact timeline |
|---|---|---|---|
| Photonics packaging and fiber-coupling costs | −1.5% | Global | 2027–2036 |
| Integration of external laser materials | −1.1% | Europe and North America | 2027–2034 |
| Reliability testing for active PIC structures | −0.8% | Asia-Pacific | 2028–2035 |
| Price pressure from alternative discrete optics | −0.6% | Global | 2029–2036 |
Photonics packaging and fiber-coupling costs
Photonics packaging and fiber-coupling costs increases the effort required to qualify or replace silicon photonic device. A engineering disadvantage can translate into delayed purchasing, more maintenance work or poorer economics for the user. Device vendors that demonstrate stable performance and clear service processes may offset some of this industry risk, but the constraint remains important for 2027–2036 forecasts. For Photonics packaging and fiber-coupling costs restraint in 2027, the purchase decision depends on explicit equipment interoperability, verifiable device performance and whether the supplier can sustain replacement support throughout the planned service interval.
Integration of external laser materials
Integration of external laser materials increases the effort required to qualify or replace silicon photonic device. A engineering disadvantage can translate into delayed purchasing, more maintenance work or poorer economics for the user, since equipment purchasers evaluate engineering adoption against validation risk and long-term fabrication support. Device vendors that demonstrate stable performance and clear service processes may offset some of this industry risk, but the constraint remains important for 2027–2036 forecasts, since equipment purchasers evaluate engineering adoption against validation risk and long-term fabrication support. In the Integration of external laser materials restraint setting, an engineering advantage becomes a sale only after purchasing teams review validation evidence, inventory risk, maintenance requirements and the operating economics of the intended deployment.
Reliability testing for active PIC structures
Reliability testing for active PIC structures increases the effort required to qualify or replace silicon photonic device. A engineering disadvantage can translate into delayed purchasing, more maintenance work or poorer economics for the user, which makes engineering adoption sensitive to engineering design changes and device lead times. Device vendors that demonstrate stable performance and clear service processes may offset some of this industry risk, but the constraint remains important for 2027–2036 forecasts, which makes engineering adoption sensitive to engineering design changes and device lead times. This matters for Reliability testing for active PIC structures restraint, because the technically feasible option must also be installable, serviceable and properly documented across the operating life of the equipment and its supporting software.
Price pressure from alternative discrete optics
Price pressure from alternative discrete optics increases the effort required to qualify or replace silicon photonic device. A engineering disadvantage can translate into delayed purchasing, more maintenance work or poorer economics for the user, where the economics of engineering adoption reflect vendor validation and integration tolerances. Device vendors that demonstrate stable performance and clear service processes may offset some of this industry risk, but the constraint remains important for 2027–2036 forecasts, where the economics of engineering adoption reflect vendor validation and integration tolerances. A industry evaluation of Price pressure from alternative discrete optics restraint therefore compares the cost of validated materials, process yield, lead times, quality assurance and post-installation support rather than product specifications alone.
MARKET OPPORTUNITIES
High-bandwidth co-packaged optical engines
High-bandwidth co-packaged optical engines creates an opportunity to improve deployment or the supplier value proposition. The relevant engineering work concerns silicon photonic modulators, germanium-on-silicon detectors, passive waveguides, ring resonators, grating couplers and hybrid silicon laser coupling as integrated optical circuit building blocks. Purchasers still require evidence of stable operation, a practical purchasing channel, training and a predictable replacement schedule. The industry impact is strongest where those requirements can be standardized across several purchasers.
Photonics for specialty biosensing
Photonics for specialty biosensing creates an opportunity to improve deployment or the supplier value proposition. The relevant engineering work concerns silicon photonic modulators, germanium-on-silicon detectors, passive waveguides, ring resonators, grating couplers and hybrid silicon laser coupling as integrated optical circuit building blocks, since equipment purchasers evaluate engineering adoption against validation risk and long-term fabrication support. Purchasers still require evidence of stable operation, a practical purchasing channel, training and a predictable replacement schedule, since equipment purchasers evaluate engineering adoption against validation risk and long-term fabrication support. The industry impact is strongest where those requirements can be standardized across several purchasers, since equipment purchasers evaluate engineering adoption against validation risk and long-term fabrication support.
Heterogeneous integration with electronics
Heterogeneous integration with electronics creates an opportunity to improve deployment or the supplier value proposition. The relevant engineering work concerns silicon photonic modulators, germanium-on-silicon detectors, passive waveguides, ring resonators, grating couplers and hybrid silicon laser coupling as integrated optical circuit building blocks, which makes engineering adoption sensitive to engineering design changes and device lead times. Purchasers still require evidence of stable operation, a practical purchasing channel, training and a predictable replacement schedule, which makes engineering adoption sensitive to engineering design changes and device lead times. The industry impact is strongest where those requirements can be standardized across several purchasers, which makes engineering adoption sensitive to engineering design changes and device lead times.
Low-power optical receiver innovation
Low-power optical receiver innovation creates an opportunity to improve deployment or the supplier value proposition. The relevant engineering work concerns silicon photonic modulators, germanium-on-silicon detectors, passive waveguides, ring resonators, grating couplers and hybrid silicon laser coupling as integrated optical circuit building blocks, where the economics of engineering adoption reflect vendor validation and integration tolerances. Purchasers still require evidence of stable operation, a practical purchasing channel, training and a predictable replacement schedule, where the economics of engineering adoption reflect vendor validation and integration tolerances. The industry impact is strongest where those requirements can be standardized across several purchasers, where the economics of engineering adoption reflect vendor validation and integration tolerances.
Supply Chain Analysis
The supply chain links specialized raw materials, device fabrication, verification, system integration and servicing for silicon photonic device. A failure at any stage can invalidate the validated end product. Vendor selection is therefore affected by more than selling price: replacement-device availability, inspection data, lead time and the ability to support legacy interfaces are commercially significant.
Upstream materials. Materials and optical substrates required for silicon photonic modulators, germanium-on-silicon detectors, passive waveguides, ring resonators, grating couplers and hybrid silicon laser coupling as integrated optical circuit building blocks; inspection before assembly, since equipment purchasers evaluate wafer-to-package integration against validation risk and long-term fabrication support. For silicon photonic device, controlling change across this stage enables traceability, reliability and repeatable delivery. Purchasing teams demand engineering records that explain product behavior and clarify responsibility if a device fails after deployment.
Manufacturing. Fabrication, alignment, sealing or recording operations matched to the market boundary. For silicon photonic device, controlling change across this stage enables traceability, reliability and repeatable delivery, since equipment purchasers evaluate wafer-to-package integration against validation risk and long-term fabrication support. Purchasing teams demand engineering records that explain product behavior and clarify responsibility if a device fails after deployment, since equipment purchasers evaluate wafer-to-package integration against validation risk and long-term fabrication support. In the Fabrication chain setting, an engineering advantage becomes a sale only after purchasing teams review validation evidence, inventory risk, maintenance requirements and the operating economics of the intended deployment.
Channels. OEM engineering contracts, engineering distributors and integrated storage or optical equipment vendors, since equipment purchasers evaluate wafer-to-package integration against validation risk and long-term fabrication support. For silicon photonic device, controlling change across this stage enables traceability, reliability and repeatable delivery, which makes wafer-to-package integration sensitive to engineering design changes and device lead times. Purchasing teams demand engineering records that explain product behavior and clarify responsibility if a device fails after deployment, which makes wafer-to-package integration sensitive to engineering design changes and device lead times. This matters for Channels chain, because the technically feasible option must also be installable, serviceable and properly documented across the operating life of the equipment and its supporting software.
Downstream users. optical transceiver makers, telecom equipment product engineers, AI network integrators, sensing developers and specialist government purchasers buying photonic components; validation, deployment and lifecycle support, since equipment purchasers evaluate wafer-to-package integration against validation risk and long-term fabrication support. For silicon photonic device, controlling change across this stage enables traceability, reliability and repeatable delivery, where the economics of wafer-to-package integration reflect vendor validation and integration tolerances. Purchasing teams demand engineering records that explain product behavior and clarify responsibility if a device fails after deployment, where the economics of wafer-to-package integration reflect vendor validation and integration tolerances.
Recent Developments
- 21 September 2026 Published
Imec demonstrated a 100GHz germanium-silicon avalanche photodiode in a 300mm photonic process, supporting a net 400Gbps receiver link at 5V. The active device targets higher optical sensitivity and bandwidth; commercial adoption requires receiver-assembly and signal-processing qualifications beyond successful wafer fabrication. A commercial evaluation of Silicon Photonic Device development 21 September 2026 therefore compares the cost of qualified materials, process yield, lead times, quality assurance and post-installation support rather than product specifications alone. Source - 20 September 2026 Announced
Coherent showcased a 3.2T pluggable optical architecture and a 6.4T near-packaged engine at ECOC 2026. These demonstrations depend on integrated silicon photonic paths, high-power laser supply and dense fibre attach. Product readiness depends on system power, thermal management and qualified manufacturing yield. The 2027–2036 opportunity in Silicon Photonic Device development 20 September 2026 is linked to deployment timing and customer acceptance, with supplier selection reflecting reliability, supply continuity, interface requirements and actual unit economics. Source - 14 July 2026 Announced
Tower Semiconductor said it would expand silicon photonics and SiGe manufacturing in Japan with government support. This additional processing capacity can support regional device designers and diversified sourcing, although wafer availability and merchant photonic device shipments are separate commercial measures. For Silicon Photonic Device development 14 July 2026 in 2032, the purchase decision depends on explicit equipment compatibility, verifiable component performance and whether the supplier can sustain replacement support throughout the planned service interval. Source - 4 May 2026 Announced
GlobalFoundries introduced the SCALE CPO platform, using dense wavelength division and silicon photonics for optical compute connections. The event underscores interest in putting optical engines close to processing silicon while preserving system-level distinctions between a functional photonic device and a finished accelerated-compute system. In the Silicon Photonic Device development 4 May 2026 setting, an engineering advantage becomes a sale only after procurement teams review validation evidence, inventory risk, maintenance requirements and the operating economics of the intended deployment. Source - 17 March 2026 Announced
Coherent demonstrated multiple 1.6T silicon photonics options and next-generation 3.2T signal chains, including a silicon PN junction modulator for 400G-per-lane transmission. High-lane-speed device suppliers must balance modulation performance, insertion loss, wavelength control and power efficiency as customers select optical module architectures. This matters for Silicon Photonic Device development 17 March 2026, because the technically feasible option must also be installable, serviceable and properly documented across the operating life of the equipment and its supporting software. Source - 9 March 2026 Announced
STMicroelectronics entered high-volume production of PIC100 devices for 800G and 1.6T optical modules, with publicly announced growth plans for the 300mm manufacturing base. This is direct industrial evidence of silicon photonic device commercialization, rather than just laboratory feasibility. A commercial evaluation of Silicon Photonic Device development 9 March 2026 therefore compares the cost of qualified materials, process yield, lead times, quality assurance and post-installation support rather than product specifications alone. Source - 23 September 2025 Announced
The STARLight consortium announced a European 300mm silicon-photonics programme joining twenty-four companies and universities. The project supports active and passive PIC process maturity and aims at datacenter, telecom and automotive applications, but does not itself disclose sales volumes for each device category. The 2027–2036 opportunity in Silicon Photonic Device development 23 September 2025 is linked to deployment timing and customer acceptance, with supplier selection reflecting reliability, supply continuity, interface requirements and actual unit economics. Source - 31 March 2025 Announced
Coherent demonstrated a 1.6T-DR8 silicon-photonics transceiver with a 3nm optical DSP. Reducing electrical signal-processing power by design can improve module economics, while the integrated photonic circuit must still be qualified separately for optical losses, manufacturing tolerances and lifetime. For Silicon Photonic Device development 31 March 2025 in 2027, the purchase decision depends on explicit equipment compatibility, verifiable component performance and whether the supplier can sustain replacement support throughout the planned service interval. Source
REPORT SCOPE & SEGMENTATION
| Attribute | Details |
|---|---|
| Study Period | 2021–2036 |
| Base Year | 2026 |
| Estimated Year | 2027 |
| Forecast Period | 2027–2036 |
| Historical Period | 2021–2025 |
| Base Year Market Size | USD 3,075 million |
| Estimated Year Market Size | USD 3,788 million |
| Forecast Year Market Size | USD 24,770 million |
| CAGR | 23.2% |
| Unit | USD million |
| Market Definition | silicon-platform active and passive optoelectronic devices sold as chips, optical-engine assemblies or independently priced photonic components, including silicon modulators, germanium photodetectors, waveguides and coupling structures; excludes complete routers, AI accelerators, fibre installation and merchant foundry services counted separately |
| By Type | Active · Passive |
| By Application | Telecommunications · Medical · Defense · Consumer Electronics · Others |
| By Region | Five region market segmentation is based on where the final specialized optical equipment is sold, not the location of raw-material fabrication. Asia-PacificChina · Japan · India · South Korea North AmericaUnited States · Canada · Mexico EuropeGermany · United Kingdom · France South AmericaBrazil · Chile · Argentina Middle East & AfricaSaudi Arabia · United Arab Emirates · South Africa |
| Key Companies Profiled | Cisco Systems; Intel; IBM; STMicroelectronics; Broadcom; Acacia; Finisar; Infinera; Luxtera; Hamamatsu; Juniper; Rockley Photonics; Reflex Photonics; Huawei; Wuhan Research Institute of Posts and Telecommunications; Hisense Broadband Multimedia Technologies; Shandong Yunhai Guochuang |
| Customization Scope | Supplier, type, application and regional price analysis for silicon photonic device; estimated market shares in 2026 and differentiated growth paths for 2027–2036. |
Frequently Asked Questions
What is the global silicon photonic device market size?
The global silicon photonic device market is valued at USD 3,075 million in 2026 and is forecast to reach USD 24,770 million by 2036, with 23.2% CAGR during 2027–2036. The demand boundary is specific to the optical equipment and technology defined here rather than the full revenue of all data-center, media, automotive or electronics systems, specifically for silicon-device suppliers evaluating active or passive integrated optical products.
Which geographic region is the largest market?
Asia-Pacific is the leading 2026 regional market with an estimated ~44% of revenue. North America and Europe follow at ~24% and ~22%, respectively. Differences in OEM fabrication locations and customer purchasing geography can otherwise distort region comparisons. In the FAQ 2 setting, an engineering advantage becomes a sale only after purchasing teams review validation evidence, inventory risk, maintenance requirements and the operating economics of the intended deployment.
Which region has the fastest growth rate?
Asia-Pacific has the highest estimated regional expansion at ~25.4% CAGR through 2036. Singapore plays a foundry and process-integration role, Japan is investing in 300mm silicon photonics, while Chinese and South Korean systems manufacturers increasingly source optical engines and chiplets for dense interconnection, which makes buyer decision-making sensitive to engineering design changes and device lead times. Packaging and testing relationships can be as important to local silicon-photonics demand as the wafer process itself, where the economics of buyer decision-making reflect vendor validation and integration tolerances. The rate is linked to equipment deployment, supplier validation and the technology mix, rather than broad GDP growth alone.
Which type holds the largest revenue share?
Active represents an estimated ~62% of the 2026 market. Active silicon photonic devices implement electrical-to-optical modulation, optical reception or phase control, often using silicon PN junction modulators, germanium-on-silicon photodiodes and separate InP laser sources, where the economics of buyer decision-making reflect vendor validation and integration tolerances. Their value reflects higher interface complexity, fast lane speeds, external drive electronics and testing requirements, where the economics of buyer decision-making reflect vendor validation and integration tolerances. Purchasers need to verify its performance, equipment interoperability and the available delivery chain before treating it as an interchangeable substitute for another optical format.
Which type is projected to expand fastest?
Active carries the strongest estimated type growth at ~25.2% CAGR, from around ~62% of 2026 revenue. The product mix changes as users adopt performance-enhancing configurations, but engineering validation and lifecycle servicing determine how quickly that potential converts into orders. This matters for FAQ 5, because the technically feasible option must also be installable, serviceable and properly documented across the operating life of the equipment and its supporting software.
What is the leading application?
Telecommunications is the largest application at approximately ~57% of 2026 revenue. Carrier optical transport, high-speed transceivers and AI data-center connectivity account for most device revenue, including 800G and 1.6T modules, with the strongest implication for buyer decision-making appearing in device packaging and repeatability. Silicon PICs reduce module device count while requiring validated lasers, link budgeting and thermal performance; not every optical module deployed by a carrier uses silicon photonics, since equipment purchasers evaluate buyer decision-making against validation risk and long-term fabrication support. Procurement specifications depend on actual operating conditions; total revenue in the wider user industry is not a direct proxy for the value of optical equipment purchased, specifically for silicon-device suppliers evaluating active or passive integrated optical products.
Which application grows fastest?
Telecommunications is projected to grow at ~24.3% CAGR from approximately ~57% of 2026 revenue. Carrier optical transport, high-speed transceivers and AI data-center connectivity account for most device revenue, including 800G and 1.6T modules, since equipment purchasers evaluate buyer decision-making against validation risk and long-term fabrication support. Silicon PICs reduce module device count while requiring validated lasers, link budgeting and thermal performance; not every optical module deployed by a carrier uses silicon photonics, which makes buyer decision-making sensitive to engineering design changes and device lead times. Growth is affected by price changes and supplier validation as well as physical unit demand.
Which companies are included?
The profiled market participants include Cisco Systems, Intel, IBM, STMicroelectronics, Broadcom, Acacia. These companies may operate in different parts of the value chain and in some cases retain historical naming, specifically for silicon-device suppliers evaluating active or passive integrated optical products. Comparisons need to distinguish direct in-scope equipment fabrication from distribution, materials and wider group revenues. A industry evaluation of FAQ 8 therefore compares the cost of validated materials, process yield, lead times, quality assurance and post-installation support rather than product specifications alone.
What restrains adoption?
Photonics packaging and fiber-coupling costs is a notable limitation, alongside integration of external laser materials. Purchasers must also examine service cost, quality-control requirements and purchasing terms. Engineering improvement will not necessarily produce corresponding annual revenue growth without reproducible production and access to validated purchasers. The 2027–2036 opportunity in FAQ 9 is linked to deployment timing and customer acceptance, with supplier selection reflecting reliability, supply continuity, interface requirements and actual unit economics.
What is the study period and segmentation scope?
The base year is 2026, the estimated year is 2027, and the forecast runs through 2036 with historical context from 2021–2025, specifically for silicon-device suppliers evaluating active or passive integrated optical products. Segmentation by type covers Active, Passive and by application covers Telecommunications, Medical, Defense, Consumer Electronics, Others. Five geographic regions are included. For FAQ 10 in 2032, the purchase decision depends on explicit equipment interoperability, verifiable device performance and whether the supplier can sustain replacement support throughout the planned service interval.
Research Sources & Evidence Base
Get Sample Report PDF for Exclusive Insights
Report Sample Includes
- Table of Contents
- List of Tables & Figures
- Charts, Research Methodology, and more...
 Download Sample Report PDF