Global Semiconductor Assembly and Test Equipment Market, Trends, Business Strategies 2026-2034

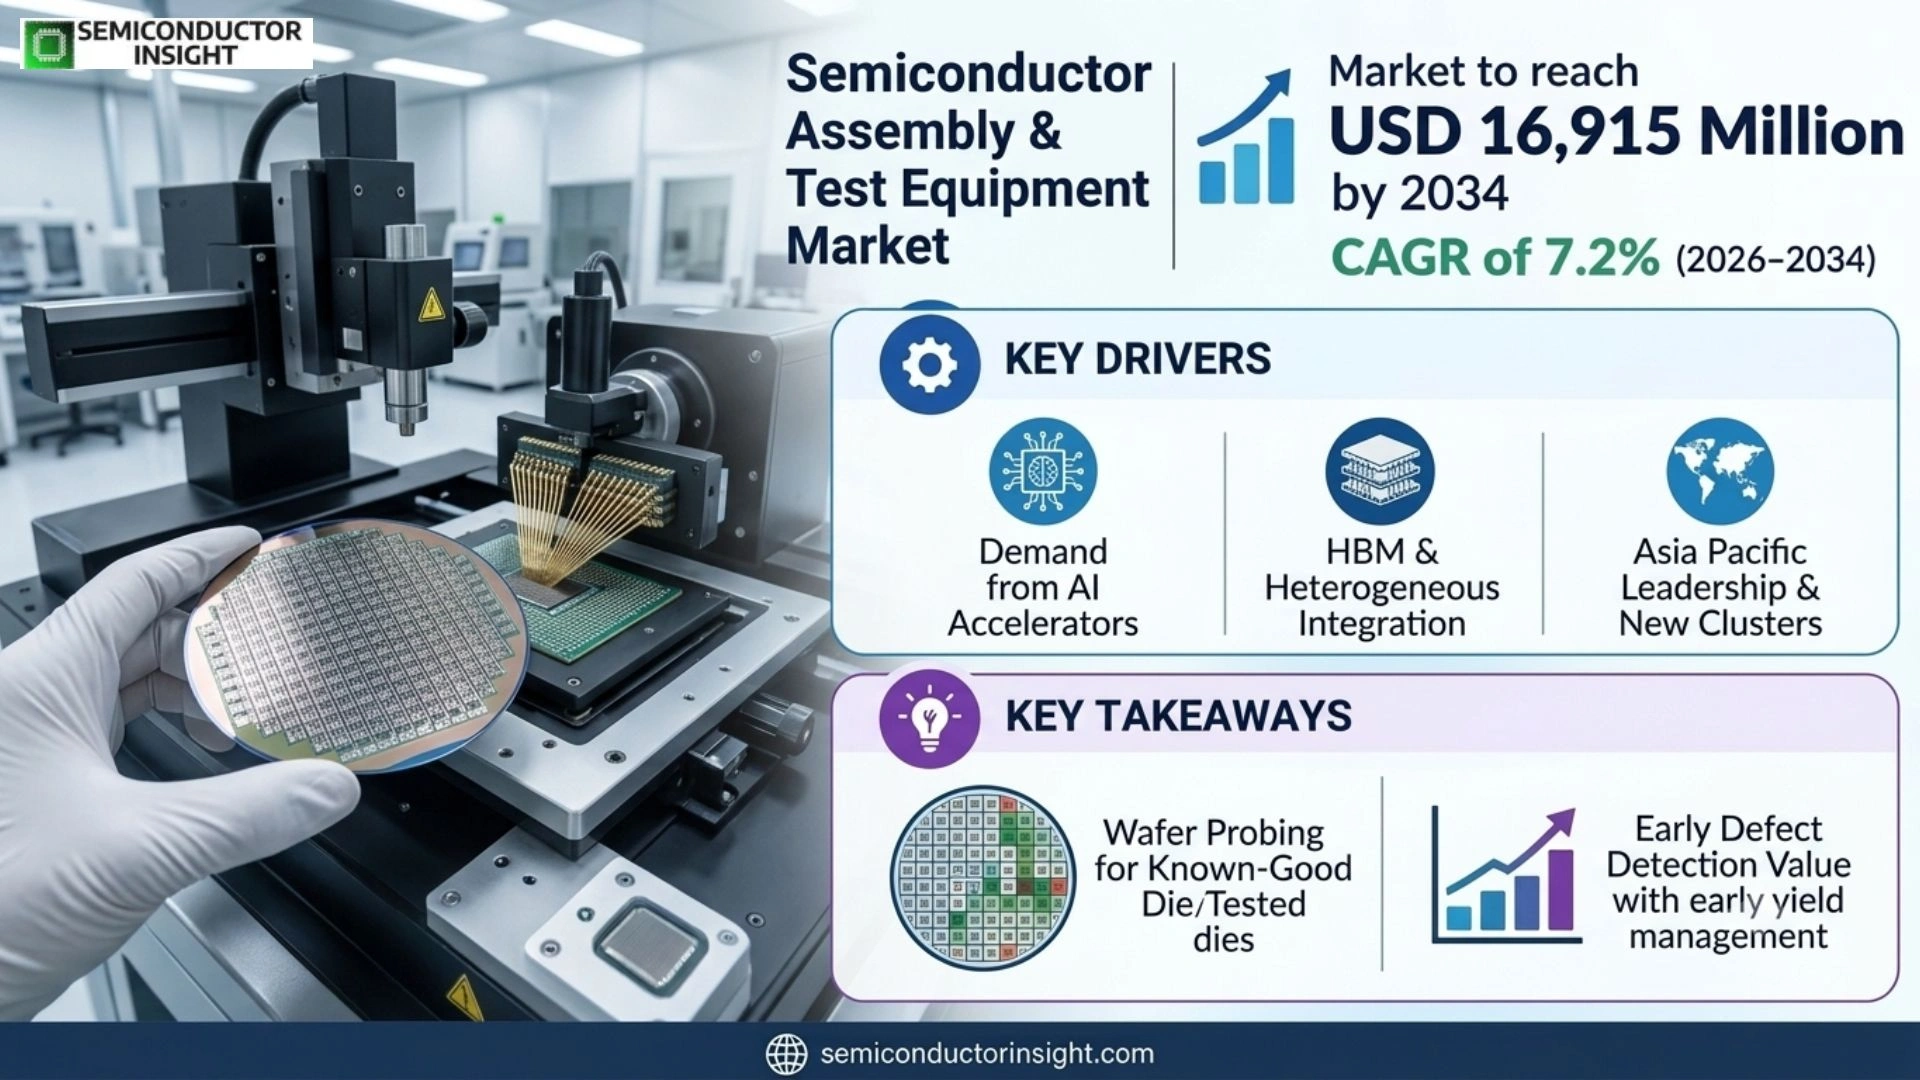
Semiconductor Assembly and Test Equipment Market is projected to reach US$ 16,915 million by 2034, representing a 7.2% CAGR during 2026–2034. The estimated 2026 market size is US$ 9,727 million. Asia Pacific is the largest regional market in 2025, while the strongest growth is concentrated in Asia Pacific and new advanced-packaging clusters in North America and India. Demand is being reshaped by AI accelerators, HBM and heterogeneous integration, which increase assembly precision and electrical-test intensity per device even when semiconductor unit growth is more moderate.

PDF Icon Download Sample Report PDF
  • Quick Dispatch

    All Orders

  • Secure Payment

    100% Secure Payment

Price range: $1,500.00 through $4,250.00

Clear

Key Statistics

2025 Market Size
US$ 9,077 million
2034 Projected Size
US$ 16,915 million
CAGR (2026–2034)
7.2%
Largest Market in 2025
Asia Pacific

Key Takeaways

  • Wafer probe stations remain the leading type because wafer-level screening identifies known-good die before expensive packaging. The economic value of early defect detection is increasing as AI and HBM packages combine multiple high-value dies, making probe accuracy, contact integrity and parallelism more important to yield and cost than in conventional single-die devices.
  • Foundries are the leading application in the source scope, while OSAT demand is the strongest structural growth channel because advanced packaging transfers more value creation to dedicated assembly-and-test specialists. Suppliers therefore need platforms that can move across foundry and OSAT process flows instead of serving only one conventional packaging step.
  • Asia Pacific is the largest region because most global packaging, memory, foundry and OSAT capacity is concentrated in China, Taiwan, South Korea, Japan and Southeast Asia. Equipment vendors need dense local applications engineering, spare-parts inventory and field service because tool uptime and ramp-to-yield are decisive purchasing criteria in high-volume back-end factories.
  • AI, HBM and advanced packaging are expanding back-end equipment intensity. SEMI projected 2025 semiconductor test-equipment sales of US$11.2 billion and assembly-and-packaging equipment sales of US$6.0 billion, with continued growth into 2026 and 2027, indicating that back-end capital spending is becoming a larger part of the performance-scaling roadmap.
  • Capital cyclicality and long qualification cycles remain the main restraints. Bonders, handlers and testers can be expensive, and customers can postpone capital orders when utilization falls. A new platform may also require extensive recipe development and production qualification, which concentrates demand among vendors with proven installed bases and strong field engineering support.
  • Advanced packaging is the main competitive shift. ASMPT reported US$532.1 million of advanced-packaging revenue in 2025, up 30.2% year over year, while Teradyne reported US$2.52 billion of semiconductor-test revenue, up 18.8%. These supplier results show stronger momentum in AI/HBM-linked tool categories than in several mainstream equipment segments.

Semiconductor Assembly and Test Equipment Market Overview

Semiconductor assembly and test equipment market is valued at US$ 9,077 million in 2025 and is projected to reach US$ 16,915 million by 2034, representing a 7.2% CAGR during 2026–2034. The estimated 2026 market size is US$ 9,727 million. Asia Pacific is the largest regional market in 2025, while the strongest growth is concentrated in Asia Pacific and new advanced-packaging clusters in North America and India. Demand is being reshaped by AI accelerators, HBM and heterogeneous integration, which increase assembly precision and electrical-test intensity per device even when semiconductor unit growth is more moderate.

Base year: 2025 · Estimated year: 2026 · Forecast period: 2026–2034 · Values in US dollars

Semiconductor assembly and test equipment covers the capital systems used after wafer fabrication to separate wafers into die, place and bond die into packages, handle devices through production and electrically verify performance before shipment. The source page defines the core type scope as wafer probe stations, die bonders, dicing machines, test handlers, sorters and other associated systems. These platforms therefore sit at the operational boundary between front-end wafer manufacturing and shipment of qualified packaged semiconductors.

The technical architecture is becoming more demanding because advanced packages combine logic, memory and interface die in 2.5D, 3D and chiplet configurations. HBM stacks, fine-pitch interconnects and thermocompression bonding increase alignment, thermal-control and test requirements. A defect discovered after several expensive dies have been integrated can destroy substantial work-in-process value, so manufacturers invest in earlier probing, more precise placement, stronger inspection and broader electrical validation to protect package yield.

Demand is generated when IDMs, foundries and OSAT providers add capacity, change package architecture or require more test insertions for a new device generation. A factory expansion creates a one-time wave of systems, while a technology transition can increase tool intensity without an equivalent increase in semiconductor units. The most attractive categories are therefore tied to structural increases in package complexity, including wafer-level probing, high-accuracy die bonding, high-parallelism test and automated handling for advanced logic and memory.

The market is changing now because AI infrastructure is pulling leading-edge logic and HBM into more complex packages while governments seek to localize semiconductor manufacturing. New advanced-packaging projects in the United States and India broaden the geographic opportunity beyond traditional Asian clusters. This diversification also raises the importance of supplier service capacity because a newly installed production line requires calibration, recipe transfer, operator training and ramp-to-yield before its nominal equipment capacity becomes commercially productive.

Segment Analysis: By Type

By type, the source page segments the market into Wafer Probe Station, Die Bonder, Dicing Machine, Test Handler, Sorter and Others. Wafer probe stations are identified as the leading segment because electrical screening before packaging protects downstream value and gives manufacturers early yield information. Die bonders and test handlers are among the fastest-changing categories because advanced packages require finer placement, controlled bonding force and temperature, and higher parallelism across final test and system-level validation.

Type Core function Market position and commercial logic
Wafer Probe Station Positions probe cards and wafers for electrical test before singulation so manufacturers can identify known-good die, characterize process variation and prevent defective die from entering costly downstream package flows. Largest type on the source page. Demand rises with wafer output, finer pitch and more test content. AI accelerators and HBM increase the value of early screening because one bad die can compromise a multi-die package containing several expensive components, making contact accuracy and parallelism increasingly valuable.
Die Bonder Places singulated die or chiplets onto substrates, interposers or other die using adhesive, solder, flip-chip or thermocompression processes while controlling alignment, force, temperature and throughput. A strategic high-growth category as advanced packaging moves toward thermocompression and high-density heterogeneous integration. ASMPT’s 2025 results show strong TCB momentum, illustrating how AI and HBM are raising capital intensity in die placement and bonding rather than merely increasing package volume.
Dicing Machine Separates processed wafers into individual die through blade, laser or related singulation methods while minimizing edge damage, contamination, chipping and kerf loss that could reduce final package reliability. A mature but essential category. Growth comes from thinner wafers, harder materials, power semiconductors and package-level singulation requirements. Buying decisions are strongly linked to material set, wafer thickness, die size and downstream yield rather than headline throughput alone.
Test Handler Automatically presents packaged devices to tester sockets under controlled electrical and thermal conditions, sorts passing and failing units and supports multi-site operation so expensive test systems remain continuously utilized. Growth is strongest where test time rises faster than unit output. AI networking, automotive and power devices require wider thermal and electrical ranges, so handler reliability and multi-site productivity directly influence cost of test and final equipment utilization.
Sorter Classifies and routes die or packaged devices according to electrical-test result, bin code, quality grade or downstream process requirement while connecting digital test results with physical material movement. Demand is tied to high-volume automation and traceability. As customers require device genealogy and lot-level quality records, sorters become part of the manufacturing data architecture rather than only mechanical routing equipment, supporting automation investment across OSAT and IDM sites.
Others Includes specialized inspection, marking, laser processing, package handling and ancillary automation outside the five named categories but used to complete semiconductor assembly-and-test production flows. Fragmented but commercially relevant because advanced packaging adds process steps faster than conventional package lines. Niche suppliers can defend attractive positions when they solve a recurring yield, handling or inspection problem that is difficult for customers to address with a general-purpose platform.

Technology segmentation and equipment intensity

The source page additionally segments the market by Wire Bonding, Flip Chip, Advanced Packaging and Others. Wire bonding remains a large installed-base technology for analog, power, sensor and mature packages, while flip-chip and advanced packaging carry higher engineering and equipment content. Tool pricing and supplier margins generally rise as process tolerance tightens, alignment pitch shrinks and package work-in-process value increases, because customers pay for process control and yield protection rather than only mechanical throughput.

Technology Commercial position Equipment implication
Wire Bonding Large installed base serving mature semiconductor packages and cost-sensitive devices. Replacement demand remains resilient because wire bonding is still efficient for many analog, power, industrial and automotive components where advanced package economics are not required. Competition emphasizes throughput, capillary control, uptime and cost per bond. Margin pressure is generally higher than in leading-edge advanced packaging because customers have multiple qualified choices and long process histories.
Flip Chip Mainstream high-performance packaging route for processors, communications devices and other products requiring denser interconnection than wire bonding. It remains an important bridge between conventional package assembly and more complex heterogeneous integration. Requires accurate placement, bump or pillar control, underfill integration and inspection. Suppliers differentiate through yield, cycle time, substrate handling and flexibility across package formats, increasing application-engineering requirements.
Advanced Packaging Fastest strategic technology area as AI accelerators, HBM and chiplets increase demand for thermocompression, fine-pitch attach, 2.5D/3D integration and advanced inspection. Capital intensity per package rises because more process and test steps must succeed before shipment. Premium pricing is supported by the value of yield protection. Customers place greater weight on process-development partnership, roadmap credibility and installed-base learning than on purchase price alone, favoring suppliers with deep semiconductor process knowledge.
Others Specialized MEMS, sensors, power devices and emerging architectures can fall outside the three named technology classes while still requiring dedicated assembly and test solutions. Demand is application-specific and can be lumpy. Niche vendors can defend margins when they own critical know-how, but scale is limited unless the process migrates into broader production. Qualification cycles are often long because customers have fewer historical benchmarks.

Segment Analysis: By Application

By application, the source page defines Integrated Device Manufacturers (IDMs), Outsourced Semiconductor Assembly and Test (OSAT), and Foundry. Foundries are identified as the leading segment because large wafer manufacturers increasingly invest in wafer-level probing and advanced packaging around leading-edge logic. OSAT providers are a powerful structural growth channel as more customers outsource complex packaging and final test, while IDMs continue to invest where proprietary process control, memory integration or automotive reliability justifies captive capacity.

Application Demand characteristics
Integrated Device Manufacturers (IDMs) IDMs purchase assembly and test equipment to support vertically integrated product roadmaps, especially memory, analog, power, automotive and specialty devices where process control and qualification are strategic. Their demand is tied to internal fab loading and product transitions. Buying decisions emphasize long platform life, global service, process ownership and the ability to reuse equipment across successive device generations without repeating qualification from zero.
Outsourced Semiconductor Assembly and Test (OSAT) OSAT providers invest when customer programs ramp, utilization approaches economic limits or a new package architecture requires capabilities that existing lines cannot provide. Their business model makes throughput, flexibility and cost per unit especially important. Advanced packaging raises the strategic value of OSATs because fabless and IDM customers need 2.5D, fan-out, system-in-package and high-density test capabilities without building dedicated factories for every package technology.
Foundry Foundries are the leading application in the source scope as front-end manufacturers extend into wafer-level test and advanced packaging to capture more value around leading-edge logic and AI devices. Their equipment purchases are synchronized with node ramps and customer package roadmaps, creating large but concentrated projects. Suppliers must demonstrate process integration, yield performance and service capability at very high utilization.

End-user industry demand

The source scope further identifies Consumer Electronics, Automotive, Industrial, Telecommunications and Healthcare as end-user industries. Consumer electronics remains the broadest unit base, but AI infrastructure and automotive electronics are increasing test intensity faster than shipments alone. Automotive devices require extended-temperature and reliability validation, telecommunications silicon demands high-speed interface testing, and healthcare electronics can require traceability and long service life. Equipment demand is therefore increasingly influenced by test content and package complexity per device.

End-user industry Demand effect
Consumer Electronics Large device volumes sustain mainstream package assembly, probing and test, but intense price competition keeps cost per unit central. The segment supports broad installed-base utilization even when premium equipment growth is concentrated elsewhere.
Automotive Long qualification cycles, functional safety and wider operating temperatures increase test coverage and handling requirements. Electric vehicles and ADAS add semiconductor content, supporting durable demand for reliable test and package equipment.
Industrial Automation, power conversion and edge computing support a diversified product mix with long lifecycles. Equipment must handle mixed volumes and reliability requirements rather than only maximum throughput.
Telecommunications High-speed networking, RF and data-center connectivity increase interface complexity and test bandwidth. AI networking silicon further links this end market to advanced packaging and high-performance test investment.
Healthcare Medical electronics create smaller volumes but can require high reliability, traceability and miniaturized packaging. Specialized device requirements generate selective demand for precision assembly and qualification-focused test solutions.

Global Semiconductor Assembly and Test Equipment Market Share 2026

Regional Analysis

Asia Pacific is the largest semiconductor assembly and test equipment market in 2025 because the region contains the greatest concentration of foundries, memory manufacturers, OSATs and electronics supply chains. North America is gaining strategic importance as the United States localizes advanced packaging around new fabs, while Europe remains specialized around automotive, power and research infrastructure. India and Southeast Asia are widening the geographic footprint of back-end manufacturing within Asia Pacific.

How does regional demand differ across the semiconductor assembly and test equipment market?

Regional demand follows the location and technology level of semiconductor packaging and test capacity rather than the headquarters of equipment suppliers. Asia Pacific is a high-volume utilization market, North America is a localization and leading-edge technology market, Europe is specialized around automotive, industrial and research applications, South America is mainly import dependent, and the Middle East & Africa remain early-stage ecosystem markets. These differences determine tool mix, qualification speed and local service requirements.

Region Position Growth outlook Demand profile Supplier selection
Asia Pacific Largest Strong absolute expansion Foundry, memory and OSAT concentration Local applications engineering, installed-base references, throughput, spare-parts response and compatibility with customer roadmaps. Buyers increasingly need advanced-packaging performance while still benchmarking cost per unit across large fleets.
North America Strategic growth Above mature-market average AI, defense and localized advanced packaging Technology leadership, process-development support, domestic field service and qualification with major semiconductor customers. Public incentives strengthen demand for complete local front-to-back manufacturing flows.
Europe Specialized Moderate Automotive, power, industrial and R&D Precision, reliability, energy efficiency and long equipment life. Buyers value support for automotive and industrial qualification, while regional equipment vendors reinforce advanced-package engineering capability.
South America Small Low to moderate Imported equipment and electronics assembly Landed cost, financing, service availability and ability to operate efficiently at lower utilization. The region lacks the semiconductor-manufacturing density required for large advanced-packaging fleets.
Middle East & Africa Emerging From a small base Government-led technology projects Project funding, local workforce development, service capability and credible anchor customers. High-end back-end equipment demand remains selective until regional semiconductor manufacturing reaches commercial scale.

Detailed Regional Market Analysis

Asia Pacific LARGEST

Why does Asia Pacific have this position in the market?

Asia Pacific leads because it combines the highest concentration of foundry, memory, OSAT and electronics-manufacturing capacity. Equipment is purchased close to production because process development, qualification, spare-parts response and yield troubleshooting are continuous. The region contains both very large mainstream wire-bond and test fleets and the fastest deployment of advanced bonding, wafer probe and HBM-related test, giving suppliers a broad mix of volume and technology demand.

Market positionLargest global region
Growth outlookStrong absolute expansion
Demand profileFoundry, memory and OSAT concentration
Market access gateLocal qualification and service depth
Country / subregion Position Commercial demand mechanism
China Large manufacturing base Domestic semiconductor capacity expansion supports dicing, probing, handling and packaging automation across mature and increasingly advanced nodes. Local suppliers are improving, so multinational vendors need technology benefits, strong local service and competitive total cost of ownership.
Taiwan Leading-edge packaging hub World-scale foundry and OSAT capacity creates dense demand for wafer-level test, advanced die placement and high-end packaging. Supplier qualification is demanding because tools are evaluated at high utilization and tight yield targets.
South Korea Memory-intensive demand Large memory manufacturers create concentrated demand for probe, handling and final-test equipment, particularly as HBM adds more wafer and package test content. Customer concentration makes the region important but cyclical.
Southeast Asia & India Fast capacity expansion Malaysia and Singapore remain established back-end hubs while India is adding new ATMP and OSAT sites. New factories create demand for flexible equipment, training, field service and localized spare-parts support.

Market instances

  • 9 February 2026: Malaysia announced the opening of Chipbond Technology’s new Penang facility with investment close to US$200 million, explicitly expanding OSAT capacity and creating direct demand for packaging, handling, inspection and test equipment.
  • 4 February 2026: India reported ten approved semiconductor projects with about ₹1.6 lakh crore of envisaged investment, including eight packaging units, widening the addressable equipment base beyond pilot-scale installations.
  • 3 December 2025: India’s Tata Semiconductor Assembly and Test project in Assam was reported at ₹27,000 crore with planned capacity up to 48 million chips per day, requiring production-scale assembly and test tool chains.
Full-report note: The full report tracks country-level packaging and test capacity, OSAT and IDM expansions, technology mix, equipment suppliers, localization policies and the transition from mainstream package assembly toward advanced 2.5D/3D, HBM and heterogeneous-integration workflows.
North America STRATEGIC LOCALIZATION

Why does North America have this position in the market?

North America is becoming more important for advanced packaging and high-value test as the United States tries to create an end-to-end domestic semiconductor supply chain. AI compute, defense, aerospace and leading-edge fab investment favor premium tools with strong process-development support. The regional opportunity is weighted toward advanced packaging, system-level test and highly automated factories rather than commodity back-end lines competing mainly on labor cost.

Market positionStrategic growth market
Growth outlookAbove mature-market average
Demand profileAI, defense and localization
Market access gateMajor-customer qualification
Country / subregion Position Commercial demand mechanism
United States Regional anchor The U.S. combines major chip designers, equipment suppliers, defense demand and new fab investments. Advanced-packaging projects are intended to keep high-value post-fab processing domestic, pulling through demand for die attach, inspection, handling and test equipment.
Canada Niche technology base Demand is smaller and concentrated in research, communications, aerospace and specialized semiconductor activity. Equipment opportunities are project-specific and often tied to R&D or pilot production rather than large OSAT fleets.
Mexico Electronics adjacency A large electronics and automotive manufacturing base provides potential for package and test activity close to end customers, but leading-edge semiconductor back-end capacity remains much smaller than in Asia. Suppliers often support the market from U.S. service organizations.

Market instances

  • 20 December 2024: the U.S. Department of Commerce finalized up to US$407 million in CHIPS incentives for Amkor’s approximately US$2 billion advanced packaging and test facility in Arizona, creating a major new domestic equipment customer.
  • 19 February 2026: Teradyne reported 2025 Semiconductor Test revenue of US$2.52 billion, up 18.8%, with AI-related customer demand driving the majority of segment revenue in the second half.
  • 17 January 2025: additional U.S. CHIPS awards to critical semiconductor supply-chain companies reinforced the strategy of building domestic capability across materials, manufacturing and advanced packaging rather than isolated front-end capacity.
Full-report note: The full report evaluates U.S. advanced-packaging projects, equipment-vendor exposure to AI and defense customers, domestic supply-chain incentives, customer concentration, qualification timelines and the commercial implications of moving more post-fab processing into North America.
Europe SPECIALTY & AUTOMOTIVE

Why does Europe have this position in the market?

Europe’s demand is shaped by automotive, industrial, power-semiconductor and research applications rather than the very large consumer and memory packaging volumes seen in Asia. The region also contains important advanced-packaging equipment technology. Buyers value precision, reliability and long platform life because many European semiconductor products have long qualification cycles, while public semiconductor programs expand pilot-line and specialty packaging demand even if high-volume OSAT capacity remains comparatively limited.

Market positionSpecialized regional market
Growth outlookModerate
Demand profileAutomotive, power and research
Market access gateReliability and process support
Country / subregion Position Commercial demand mechanism
Germany Automotive and industrial core Demand is linked to vehicles, power electronics, industrial automation and sensors. Assembly and test platforms must support long qualification cycles, high reliability and mixed product volumes rather than only consumer-electronics throughput.
Netherlands Equipment technology center The Netherlands hosts important semiconductor-equipment capability, including advanced-packaging supplier Besi. Regional demand combines supplier R&D, customer demonstrations and European semiconductor production, supporting high-value engineering work.
France & Italy Specialty semiconductor base Analog, power, RF and automotive semiconductor production supports mature and advanced assembly/test equipment with emphasis on quality, traceability and long-term support. Public investment is intended to strengthen regional technology sovereignty.

Market instances

  • 25 April 2025: the Chips Joint Undertaking finalized hosting agreements for additional pilot lines and selected 30 competence centres across 28 European countries, supporting shared semiconductor innovation infrastructure.
  • 16 January 2025: the European Commission marked the launch of the first five Chips for Europe pilot lines, intended to bridge laboratory innovation and industrial-scale semiconductor manufacturing.
  • 2025–2026 supplier cycle: European advanced-packaging equipment roadmaps remained strongly oriented toward AI and heterogeneous integration while mainstream automotive and industrial demand stayed more selective, favoring premium process tools over broad commodity capacity.
Full-report note: The full report examines country-level specialty semiconductor capacity, pilot-line infrastructure, automotive and power-device requirements, European equipment suppliers, funding programs and the extent to which regional packaging investment can reduce dependence on Asian back-end manufacturing.
South America NICHE

Why does South America have this position in the market?

South America remains a small equipment market because local semiconductor fabrication and advanced packaging capacity are limited. Demand is mainly linked to electronics, automotive and industrial assembly operations that import semiconductors, plus laboratories and research organizations. The commercial model favors versatile systems, distributor support and carefully selected capital purchases where utilization cannot justify the same equipment intensity seen in Asian or U.S. high-volume semiconductor clusters.

Market positionSmall regional base
Growth outlookLow to moderate
Demand profileElectronics assembly and imports
Market access gateLanded cost and service availability
Country / subregion Position Commercial demand mechanism
Brazil Largest regional opportunity Brazil’s electronics and automotive industries create the strongest local need for semiconductor-related test and selected package equipment, but the absence of large leading-edge manufacturing limits demand for premium back-end production fleets.
Argentina Project-driven Demand is tied to electronics manufacturing, research and imported equipment. Capital access and currency conditions can materially affect investment timing, making financing and regional support important supplier considerations.
Other South America Limited installed base Demand is scattered across industrial electronics, communications and research users. Equipment vendors typically serve these customers through distributors or regional service hubs rather than dedicated semiconductor field organizations.

Market instances

  • 2025 manufacturing environment: electronics and automotive production continued to support component-testing needs, but no advanced-packaging buildout comparable to Asia or the United States emerged at regional scale.
  • Import dependence: most sophisticated systems are sourced from North America, Europe or Asia, so exchange rates, duties and service logistics materially affect ownership cost and favor robust platforms with strong remote diagnostics.
  • Installed-base opportunity: suppliers can capture recurring revenue through spares, calibration, upgrades and application support even when new equipment volumes remain limited and geographically dispersed.
Full-report note: The full report covers Brazil, Argentina and other demand centers, import economics, local electronics production, laboratory demand, distributor structures, service models and the feasibility of future semiconductor packaging investment.
Middle East & Africa EMERGING

Why does Middle East & Africa have this position in the market?

The Middle East & Africa market is at an early stage because regional semiconductor manufacturing remains limited, but technology-diversification strategies create selective opportunities in research, electronics, defense and future packaging projects. The strongest supplier path is to enter alongside funded industrial clusters, training centers and strategic manufacturing partnerships rather than assuming conventional OSAT economics already exist. Workforce development and local service can be as important as the equipment specification itself.

Market positionEmerging from small base
Growth outlookLong-term selective upside
Demand profileGovernment-led projects
Market access gateFunding and local skills
Country / subregion Position Commercial demand mechanism
Saudi Arabia Strategic technology investment National diversification programs support advanced manufacturing and data infrastructure ambitions. Semiconductor back-end demand will depend on whether technology initiatives progress into sustained production capacity with enough utilization to justify dedicated equipment fleets.
United Arab Emirates Technology and connectivity hub The UAE’s investment ecosystem can support semiconductor design, R&D and selected manufacturing partnerships. Near-term equipment demand is likely to remain concentrated in research and specialized applications rather than mass-market package production.
South Africa & wider Africa Limited production capacity Demand is mainly associated with electronics, research, communications and industrial maintenance. High-end systems are imported, making technical support, training and platform versatility central to customer decisions.

Market instances

  • 2025–2026 industrial policy: Gulf states continued to position advanced technology and AI infrastructure as diversification priorities, but semiconductor equipment opportunity remained dependent on production projects moving beyond research and design.
  • Workforce constraint: advanced packaging and test operations require process engineers, equipment technicians and quality specialists, so training partnerships determine whether installed tools can achieve target uptime and yield.
  • Project economics: the small installed base means suppliers often need government-backed anchor projects or strategic customers before local spare-parts and field-service infrastructure becomes commercially efficient.
Full-report note: The full report assesses national semiconductor and electronics programs, prospective manufacturing clusters, workforce readiness, defense and communications demand, service structures and scenarios under which the region could support meaningful packaging and test capacity.

Key Semiconductor Assembly and Test Equipment Manufacturers and Competitive Landscape

Competition is split between assembly-equipment specialists and automatic-test-equipment vendors, with the strongest positions built around deep process know-how, installed-base learning and customer qualification rather than broad product breadth alone. The source page profiles eleven companies across die bonding, dicing, handling, probing and test. Customers rarely treat platforms as interchangeable because changing a qualified tool can alter yield, throughput, contact performance or package warpage behavior, creating high switching costs after production qualification.

ASMPT, Kulicke & Soffa and Besi compete heavily in assembly and advanced packaging, while Teradyne and Advantest are major automatic-test-equipment suppliers. Cohu adds handling and test capability, and ACCRETECH participates in probing and precision back-end equipment. Chinese suppliers such as Hangzhou Changchuan Technology and Beijing Huafeng Test and Control Technology are expanding with domestic semiconductor investment, increasing localization and price pressure on incumbent multinational vendors.

The competitive center of gravity is moving toward AI and HBM because those applications justify higher equipment prices and faster technology refresh. ASMPT reported 2025 advanced-packaging revenue of US$532.1 million, up 30.2%, with thermocompression-bonding revenue rising approximately 146%. Teradyne reported US$2.52 billion of semiconductor-test revenue in 2025, up 18.8%, showing how premium back-end categories can materially outperform mainstream equipment cycles.

Customer concentration remains a structural risk. A small number of foundries, memory manufacturers, OSATs and vertically integrated AI customers can account for large fractions of annual equipment demand, so qualification success at one program can produce a sharp order increase while a delayed node or package ramp can create an equally sharp shortfall. Suppliers respond by broadening application coverage and building service revenue that is less volatile than new-tool orders.

Local service capability is a competitive moat because tool downtime can idle an entire package or test cell. Major customers expect rapid access to field engineers, spare parts, software updates and process specialists. As capacity expands in India, Malaysia and North America, suppliers that can replicate dense Asian-style service coverage in emerging clusters will be better positioned than vendors that depend on long-distance technical support.

Competitive tier Companies from source scope Strategic position
Tier 1 global platforms ASM Pacific Technology; Teradyne; Advantest; Kulicke & Soffa Industries; Besi Global customer access, high R&D intensity and strong positions in either assembly or test. These companies benefit most from AI, HBM and advanced packaging because customers need proven high-end process capability and extensive applications support.
Specialized equipment leaders ACCRETECH; SHINKAWA; Palomar Technologies; Cohu Compete through specialized process, handling, probing or packaging capability. They can hold defensible niches where application requirements are demanding and where customers value engineering depth more than a broad one-platform portfolio.
China-focused challengers Hangzhou Changchuan Technology; Beijing Huafeng Test and Control Technology Benefit from domestic semiconductor investment and localized supply preferences. Their expansion increases competitive pressure in mainstream test and handling while giving Chinese factories additional second-source options.

Companies profiled in the report

  • ASM Pacific Technology
  • Kulicke & Soffa Industries
  • Besi
  • ACCRETECH
  • SHINKAWA
  • Palomar Technologies
  • Teradyne
  • Advantest
  • Cohu
  • Hangzhou Changchuan Technology
  • Beijing Huafeng Test and Control Technology

Semiconductor Assembly and Test Equipment Production Capacity Analysis

Production capacity in this market is best understood through customer back-end capacity rather than only the equipment manufacturers’ own factories. Tools are built by a relatively concentrated group of global suppliers, but demand is installed where semiconductor wafers and die are packaged and tested. Asia Pacific therefore dominates the installed equipment base, while new U.S. and Indian projects are adding geographically diversified capacity. The binding constraint is increasingly qualified process capability, interface hardware and field engineering rather than floor space alone.

Advanced packaging creates capacity bottlenecks because a production line is only as fast as its slowest qualified process. A shortage of thermocompression bonders, high-end testers, probe cards, sockets or inspection capacity can cap output even when wafer supply is available. HBM and multi-die AI packages are particularly sensitive because several expensive dies must be assembled and tested with high yield. Equipment vendors therefore sell capacity as a coordinated process solution, and customers add parallel tools to protect throughput and redundancy.

SEMI projected 2025 sales of US$11.2 billion for semiconductor test equipment and US$6.0 billion for assembly-and-packaging equipment, with further growth forecast for 2026 and 2027. The expansion is uneven, however, because AI-related tools are growing rapidly while some consumer, automotive and industrial mainstream demand remains softer. Suppliers must allocate manufacturing, engineering and service resources toward constrained advanced platforms without overbuilding capacity that could become underutilized when the semiconductor cycle turns.

Geographic diversification creates a second capacity challenge: service and qualification resources must scale with new factories. A newly installed tool only becomes productive after installation, calibration, recipe transfer, acceptance testing and ramp-to-yield. When several new fabs and OSAT sites launch at once, field-engineering capacity can become a bottleneck. Suppliers with local training centers, spare-parts hubs and standardized process modules can convert nominal equipment capacity into stable customer output more quickly.

Upstream concentration also matters because assembly and test tools depend on precision stages, motion controllers, cameras, lasers, thermal systems, RF electronics, sockets and custom interfaces. Shortages in specialized components can extend lead times even when the equipment OEM has factory space available. Customers increasingly evaluate supplier resilience through multi-sourcing, common subassemblies and service inventory, while vendors standardize modules across product families to reduce procurement risk and simplify maintenance.

Semiconductor Assembly and Test Equipment Market Dynamics: Drivers, Restraints and Opportunities

The market is expanding because semiconductor performance increasingly depends on packaging architecture and test coverage, not only transistor scaling. AI accelerators, HBM, chiplets, automotive electronics and high-speed communications create more process steps and more opportunities for defects, raising equipment intensity per device. Against this, capital spending remains cyclical, advanced tools are expensive, qualification is slow and a small number of customers can change annual order patterns dramatically. Suppliers that combine technology leadership with flexible manufacturing and recurring service are best positioned.

MARKET DRIVERS

Driver Impact Analysis

Factor Directional impact on CAGR forecast* Commercial mechanism
AI, HBM and heterogeneous integration +2.0 percentage points Higher package complexity increases bonding, probing and final-test intensity per device. More expensive multi-die packages also raise the economic value of early defect detection, supporting premium equipment categories even when unit growth is slower.
Advanced packaging capacity expansion +1.5 percentage points Foundries and OSATs are adding 2.5D, 3D, fan-out and thermocompression capacity. Each new production cell requires coordinated assembly, inspection, handling and test systems, creating direct capital demand and recurring service revenue.
Regional semiconductor localization +1.0 percentage point U.S., European and Indian programs encourage new fabs, packaging units and pilot lines. Geographic duplication of capabilities increases the number of equipment installations required to support a given global demand base.
Higher reliability requirements +0.7 percentage point Automotive, industrial and communications devices require broader test coverage, wider temperature operation and stronger traceability, increasing tester time and handling complexity and supporting higher-value systems and upgrades.

AI compute and HBM raise back-end capital intensity

AI accelerators combine leading-edge logic, HBM and high-speed interfaces in packages where one defective die can destroy substantial work-in-process value. Manufacturers therefore increase probing, known-good-die screening, precision bonding and system-level test before shipment. SEMI’s strong 2025 back-end equipment forecast reflects this higher intensity. Equipment suppliers benefit when package complexity rises faster than semiconductor unit volume because more tool time and more process steps are required per sellable device.

Advanced packaging moves performance scaling into the package

As transistor scaling becomes more expensive, chipmakers use chiplets, 2.5D interposers, stacked memory and heterogeneous integration to improve system performance. This shifts investment toward die bonders, thermocompression systems, inspection and high-density test. ASMPT’s 2025 advanced-packaging growth provides direct supplier evidence. The market implication is a richer equipment mix with more application engineering, longer qualification and higher switching costs than conventional package assembly.

Regional fabs require matching back-end capability

Front-end localization has limited strategic value if wafers still need to be shipped overseas for advanced packaging and final test. The U.S. Amkor project, Indian OSAT investments and European pilot-line programs explicitly address this gap. Equipment suppliers gain opportunities in regions that historically bought less back-end capacity, but they must establish service and process support early so new factories can reach yield and utilization targets.

Reliability expands test content

Automotive, aerospace, industrial and communications devices often require wider temperature ranges, higher current, long operating life and stronger traceability than mainstream consumer products. That increases test seconds per device and can require specialized handlers, sockets and system-level test. Suppliers that raise parallelism or reduce contact-related downtime can sell a measurable cost-of-test improvement rather than only a new hardware generation.

MARKET RESTRAINTS

Restraint Impact Analysis

Factor Directional impact on CAGR forecast* Commercial mechanism
Semiconductor capital-spending cyclicality -1.5 percentage points Customers delay equipment rapidly when fab or OSAT utilization falls. Because purchases are discretionary capital spending, revenue can move much more sharply than underlying semiconductor consumption during inventory corrections.
High tool cost and qualification burden -1.0 percentage point Advanced assembly and test systems require significant capital and months of qualification. Buyers therefore concentrate spending with proven vendors and delay platform changes unless the productivity or capability improvement is compelling.
Customer concentration -0.8 percentage point A small number of foundries, memory makers, OSATs and large AI customers can account for substantial demand. Program delays or share changes can materially affect annual supplier revenue even when the broader market remains healthy.
Rapid technology obsolescence -0.6 percentage point Package architectures, interfaces and power requirements evolve quickly. Customers may hesitate to buy equipment near a technology transition, while suppliers must sustain high R&D spending to keep platforms relevant.

Equipment demand amplifies semiconductor cycles

Assembly and test systems are capital assets, so customers can pause purchases when utilization falls without immediately reducing current semiconductor output. This makes equipment revenue more cyclical than end-market consumption. Mainstream consumer, automotive and industrial softness can offset strong AI investment in the same year. Suppliers need flexible manufacturing, diversified customers and recurring service to manage the difference between structural market growth and short-term order volatility.

Qualification delays limit vendor switching

A new bonder, tester or handler must prove yield, repeatability, uptime and process compatibility before high-volume use. Qualification can consume engineering resources and put expensive customer output at risk, so incumbents often retain business even when a challenger offers a lower purchase price. The barrier protects established vendors but also restrains market expansion by slowing adoption of new platforms and making customers cautious about unproven technology.

Advanced tools raise total ownership cost

Premium assembly and test equipment requires sockets, probe cards, fixtures, utilities, software, calibration, maintenance and skilled operators in addition to the initial capital tool. The cost can be justified for high-value AI or automotive devices but is harder to absorb in commodity packages. Customers therefore segment factories carefully, using advanced platforms where process or reliability requirements truly demand them while continuing to run older systems on mature products.

Concentrated demand increases forecasting risk

Large orders can depend on one package generation, memory cycle or hyperscale AI customer. Equipment suppliers may need to reserve manufacturing capacity before customer demand is certain, yet underutilized supplier factories can compress margins if a ramp is delayed. This discourages unlimited capacity expansion and can create lead-time pressure during sudden upcycles. Modular platforms and common subassemblies help vendors shift capacity across customers and applications.

MARKET OPPORTUNITIES

Thermocompression and next-generation bonding

The strongest technology opportunity is equipment that supports finer-pitch interconnects and higher-density multi-die integration. AI and HBM packages need precise thermal and mechanical control, and ASMPT’s rapid 2025 TCB growth demonstrates customer willingness to pay for capable production platforms. Vendors that combine bonding, metrology, process software and application engineering can capture more value than suppliers offering an isolated mechanical tool because the customer’s real objective is stable yield across the process window.

System-level and high-parallelism test

As devices become more complex, structural test alone may not capture every interaction that matters in the final system. System-level test and advanced multi-site test allow customers to detect marginal defects while controlling cost per device. The opportunity is strongest for platforms that handle high power, high data rates and thermal variation without sacrificing throughput. Suppliers can monetize new testers together with recurring interface hardware, software options, calibration and service.

New OSAT clusters in India and Southeast Asia

India’s approved packaging projects and continuing Malaysian investment are creating customers that must build tool fleets from the ground up. New sites often need more training, turnkey process support and local spare-parts infrastructure than mature Asian clusters. Vendors that establish service capacity early can become default suppliers as factories add production lines, generating follow-on revenue from upgrades, maintenance contracts, consumables and subsequent capacity expansions.

Domestic advanced packaging in North America and Europe

Localization programs create a premium opportunity because new regional factories are likely to target strategic, high-value devices rather than low-margin commodity packaging. That favors advanced bonding, inspection and test equipment with strong automation and traceability. Suppliers already qualified with major global customers can transfer process learning into new regions, while niche vendors may win second-source positions where new plants seek specialized capability or supply-chain diversification.

Semiconductor Assembly and Test Equipment Supply Chain Analysis

The supply chain begins with precision mechanical, optical, thermal and electronic subsystems, moves through equipment design and integration, then into semiconductor factory installation and qualification, and finally into production support across IDMs, foundries and OSATs. Value capture is highest where an equipment vendor owns difficult process knowledge or proprietary test architecture, while major bottlenecks arise in specialized components, customer-specific interface hardware, field engineering and ramp-to-yield. Because tools are long-lived, service and upgrades remain economically important after the initial sale.

Stage 1
Precision components & subsystems
Motion stages, optics, lasers, cameras, thermal controls, high-speed electronics, sockets, probes and industrial automation hardware.
Stage 2
Equipment OEM integration
Design, software, machine vision, process modules, tester architecture, automation and final system validation.
Stage 3
Factory installation & qualification
Site acceptance, calibration, recipe development, test-program integration, process characterization and operator training.
Stage 4
Production, service & upgrades
High-volume use at IDMs, foundries and OSATs with spares, preventive maintenance, software upgrades and capacity additions.

Stage 1 — precision components and subsystems

Assembly and test equipment depends on specialized motion, optics, high-speed electronics, thermal systems and interface hardware that may come from a limited supplier base. Component shortages can extend lead times even when the equipment OEM has manufacturing capacity. Vendors reduce risk through multi-sourcing, common subassemblies and strategic inventory, but customers still evaluate supply resilience because an unavailable replacement component can keep a production tool offline and disrupt an entire package or test cell.

Stage 2 — equipment design and integration

Equipment OEMs create differentiated value through precision control, process know-how, software, test architecture and reliability. Advanced tools require substantial R&D before customer qualification, creating high barriers to entry. The commercial objective is to reuse a core platform across multiple device families while tailoring modules and software to each customer, balancing scale economics against the custom engineering demanded by leading-edge packages and high-power or high-speed test.

Stage 3 — installation and qualification

A tool shipment is not equivalent to production capacity. The system must be installed, calibrated, connected to factory automation, matched with fixtures or interface hardware and qualified on the customer’s product. Yield and throughput must then stabilize across real production variation. This stage becomes more important as new regional sites hire inexperienced workforces, creating demand for vendor training and on-site process engineers that can shorten time to usable output.

Stage 4 — production, service and upgrades

Once equipment is qualified, customers expect high uptime because the cost of an idle tester or bonder includes lost output from upstream wafer processing. Service contracts, spares, software, calibration and performance upgrades therefore generate recurring revenue and reinforce supplier relationships. Mature platforms can remain in production for years on legacy devices, while advanced factories add newer systems for premium products, making the installed base both a service asset and a source of process-learning data.

Recent Developments in the Semiconductor Assembly and Test Equipment Market

4 March 2026

ASMPT reported 2025 advanced-packaging revenue of US$532.1 million, up 30.2% year over year, with thermocompression-bonding revenue rising approximately 146%. The company also increased its estimate for the TCB addressable market to US$1.6 billion in 2028. The result confirms that AI and HBM are shifting equipment demand toward premium bonding platforms with higher process complexity and engineering content.

Official / primary source

19 February 2026

Teradyne’s 2025 annual filing reported Semiconductor Test revenue of US$2.52 billion, up 18.8% from 2024. Management said AI-related customer demand drove the majority of semiconductor-test revenue in the second half of 2025 and expected AI to remain the bulk of demand in early 2026. This strengthens investment in high-performance compute, networking, HBM and system-level test.

Official / primary source

16 December 2025

SEMI forecast total semiconductor manufacturing equipment sales of US$133 billion in 2025, rising to US$145 billion in 2026 and US$156 billion in 2027. Test-equipment sales were projected at US$11.2 billion in 2025 and assembly-and-packaging equipment at US$6.0 billion, with continued growth afterward. The forecast links back-end momentum to AI, leading-edge logic, memory, HBM and advanced packaging.

Official / primary source

20 December 2024

The U.S. Department of Commerce finalized up to US$407 million in CHIPS funding for Amkor’s approximately US$2 billion advanced packaging and test facility in Arizona. The project is expected to use 2.5D and next-generation packaging technology and create end-to-end U.S. capability for advanced semiconductors. It broadens the geographic opportunity for assembly, handling, inspection and test equipment suppliers.

Official / primary source

Report Scope & Segmentation

Attribute Scope
Report title Global Semiconductor Assembly and Test Equipment Market Research Report 2025 (Status and Outlook)
Category Chip
Market size and forecast Base year 2025: US$ 9,077 million. Estimated year 2026: US$ 9,727 million. Forecast end 2034: US$ 16,915 million. CAGR during 2026–2034: 7.2%.
By Type Wafer Probe Station; Die Bonder; Dicing Machine; Test Handler; Sorter; Others. These labels are retained from the source page without renaming or merging.
By Application Integrated Device Manufacturers (IDMs); Outsourced Semiconductor Assembly and Test (OSAT); Foundry. These are the complete application segments stated by the source page.
By Technology Wire Bonding; Flip Chip; Advanced Packaging; Others. The secondary technology axis is preserved because it explains how equipment intensity changes with package architecture.
By End-User Industry Consumer Electronics; Automotive; Industrial; Telecommunications; Healthcare. These labels are retained from the source scope to connect end-market requirements with equipment purchasing.
Regions North America; Europe; Asia-Pacific; South America; Middle East & Africa. Asia Pacific is treated as the largest regional market in 2025 based on the source page and the concentration of global packaging, test and OSAT manufacturing.
Companies profiled ASM Pacific Technology; Kulicke & Soffa Industries; Besi; ACCRETECH; SHINKAWA; Palomar Technologies; Teradyne; Advantest; Cohu; Hangzhou Changchuan Technology; Beijing Huafeng Test and Control Technology.

Frequently Asked Questions

What is the 2025 size of the global Semiconductor Assembly and Test Equipment market?

The global market size is US$ 9,077 million in 2025. The scope includes wafer probe stations, die bonders, dicing machines, test handlers, sorters and other related back-end capital equipment used by IDMs, foundries and OSAT providers. Demand is increasingly influenced by advanced packaging and AI-related test intensity, so equipment spending can grow faster than semiconductor unit shipments when each sellable device requires more assembly precision and broader electrical verification.

What is the 2034 forecast and CAGR?

The market is projected to reach US$ 16,915 million by 2034, with a 7.2% CAGR during 2026–2034. The estimated 2026 size is US$ 9,727 million. Growth is supported by AI, HBM, advanced packaging, higher reliability requirements and geographic diversification of semiconductor manufacturing, while capital-spending cyclicality and long equipment qualification cycles limit the pace at which suppliers can convert technology demand into stable production revenue.

Which region is the largest market in 2025?

Asia Pacific is the largest regional market in 2025 because the world’s densest concentration of foundries, memory manufacturers, OSATs and electronics supply chains sits in China, Taiwan, South Korea, Japan and Southeast Asia. Equipment is installed close to production so that applications engineers and service teams can support process development, ramp-to-yield and high utilization, giving the region a structural demand benefit that other regions cannot replicate quickly.

Which type segment is largest?

Wafer Probe Station is the leading type in the source segmentation. Wafer-level testing identifies known-good die before the product enters expensive downstream packaging, which becomes more valuable as advanced packages combine multiple dies and HBM stacks. Higher pin counts, finer pitch and greater parallel-test requirements increase the technical content of probe systems, supporting both new equipment demand and upgrades to existing wafer-sort capacity.

Why is advanced packaging important for equipment demand?

Advanced packaging adds more process steps, tighter tolerances and greater work-in-process value than conventional packages. Chiplets, 2.5D interposers, thermocompression bonding and stacked memory require precise die placement, thermal control, inspection and additional electrical test. A defect discovered late can waste several expensive dies, so customers invest in equipment that detects problems earlier and stabilizes yield, raising capital intensity per package even when semiconductor unit growth is moderate.

Which application segment is the largest?

Foundry is identified as the leading application on the source page. Major foundries are extending beyond wafer fabrication into wafer-level test and advanced packaging for leading-edge logic and AI customers, increasing the number of back-end process steps under their control. OSAT providers remain a major growth channel because outsourced packaging and test allows customers to access advanced capability without building dedicated factories for every package technology.

What are the main market restraints?

The main restraints are semiconductor capital-spending cyclicality, high equipment cost, long customer qualification cycles, concentrated demand and rapid technology change. Customers can delay tool purchases when utilization falls, and a new platform may require months of process qualification before volume use. Equipment makers must therefore sustain high R&D spending while managing factories that can face sudden order swings when a major memory, foundry or AI customer changes its investment schedule.

Where are the strongest opportunities for suppliers?

The strongest opportunities are thermocompression and next-generation bonding, high-parallelism and system-level test, new OSAT clusters in India and Southeast Asia, and localized advanced packaging in North America and Europe. These areas reward suppliers that combine hardware with process-development support, software, service and local applications engineering. The opportunity extends beyond the initial tool sale because a qualified installed base creates recurring demand for spares, calibration, upgrades, interface hardware and additional capacity modules.

Which companies are profiled in the report?

The source page profiles ASM Pacific Technology, Kulicke & Soffa Industries, Besi, ACCRETECH, SHINKAWA, Palomar Technologies, Teradyne, Advantest, Cohu, Hangzhou Changchuan Technology and Beijing Huafeng Test and Control Technology. The list covers assembly-equipment specialists, test-platform leaders and regional Chinese challengers, illustrating a market where competitive strength depends on process expertise, customer qualification, installed-base service and roadmap alignment rather than one uniform product category.

What does the report cover beyond market size?

The report covers type, application, technology, end-user industry, regional demand, competition, production capacity, market dynamics, supply chain and recent developments. It also analyzes how AI and HBM affect tool intensity, how OSAT and foundry strategies change equipment purchasing and how localization projects alter regional demand. The scope connects quantitative growth with the operational mechanisms that determine which equipment categories, customers and geographies capture semiconductor back-end capital spending.
Global Semiconductor Assembly and Test Equipment Market, Trends, Business Strategies 2026-2034

Get Sample Report PDF for Exclusive Insights

Report Sample Includes

  • Table of Contents
  • List of Tables & Figures
  • Charts, Research Methodology, and more...

PDF Icon Download Sample Report PDF
SKU: a0447a60dcc9
Category:

Download Sample Report

Table of Content

Table of Contents
1 Research Methodology and Statistical Scope
1.1 Market Definition and Statistical Scope of Semiconductor Assembly and Test Equipment
1.2 Key Market Segments
1.2.1 Semiconductor Assembly and Test Equipment Segment by Type
1.2.2 Semiconductor Assembly and Test Equipment Segment by Application
1.3 Methodology & Sources of Information
1.3.1 Research Methodology
1.3.2 Research Process
1.3.3 Market Breakdown and Data Triangulation
1.3.4 Base Year
1.3.5 Report Assumptions & Caveats
2 Semiconductor Assembly and Test Equipment Market Overview
2.1 Global Market Overview
2.1.1 Global Semiconductor Assembly and Test Equipment Market Size (M USD) Estimates and Forecasts (2019-2032)
2.1.2 Global Semiconductor Assembly and Test Equipment Sales Estimates and Forecasts (2019-2032)
2.2 Market Segment Executive Summary
2.3 Global Market Size by Region
3 Semiconductor Assembly and Test Equipment Market Competitive Landscape
3.1 Global Semiconductor Assembly and Test Equipment Sales by Manufacturers (2019-2025)
3.2 Global Semiconductor Assembly and Test Equipment Revenue Market Share by Manufacturers (2019-2025)
3.3 Semiconductor Assembly and Test Equipment Market Share by Company Type (Tier 1, Tier 2, and Tier 3)
3.4 Global Semiconductor Assembly and Test Equipment Average Price by Manufacturers (2019-2025)
3.5 Manufacturers Semiconductor Assembly and Test Equipment Sales Sites, Area Served, Product Type
3.6 Semiconductor Assembly and Test Equipment Market Competitive Situation and Trends
3.6.1 Semiconductor Assembly and Test Equipment Market Concentration Rate
3.6.2 Global 5 and 10 Largest Semiconductor Assembly and Test Equipment Players Market Share by Revenue
3.6.3 Mergers & Acquisitions, Expansion
4 Semiconductor Assembly and Test Equipment Industry Chain Analysis
4.1 Semiconductor Assembly and Test Equipment Industry Chain Analysis
4.2 Market Overview of Key Raw Materials
4.3 Midstream Market Analysis
4.4 Downstream Customer Analysis
5 The Development and Dynamics of Semiconductor Assembly and Test Equipment Market
5.1 Key Development Trends
5.2 Driving Factors
5.3 Market Challenges
5.4 Market Restraints
5.5 Industry News
5.5.1 New Product Developments
5.5.2 Mergers & Acquisitions
5.5.3 Expansions
5.5.4 Collaboration/Supply Contracts
5.6 Industry Policies
6 Semiconductor Assembly and Test Equipment Market Segmentation by Type
6.1 Evaluation Matrix of Segment Market Development Potential (Type)
6.2 Global Semiconductor Assembly and Test Equipment Sales Market Share by Type (2019-2025)
6.3 Global Semiconductor Assembly and Test Equipment Market Size Market Share by Type (2019-2025)
6.4 Global Semiconductor Assembly and Test Equipment Price by Type (2019-2025)
7 Semiconductor Assembly and Test Equipment Market Segmentation by Application
7.1 Evaluation Matrix of Segment Market Development Potential (Application)
7.2 Global Semiconductor Assembly and Test Equipment Market Sales by Application (2019-2025)
7.3 Global Semiconductor Assembly and Test Equipment Market Size (M USD) by Application (2019-2025)
7.4 Global Semiconductor Assembly and Test Equipment Sales Growth Rate by Application (2019-2025)
8 Semiconductor Assembly and Test Equipment Market Segmentation by Region
8.1 Global Semiconductor Assembly and Test Equipment Sales by Region
8.1.1 Global Semiconductor Assembly and Test Equipment Sales by Region
8.1.2 Global Semiconductor Assembly and Test Equipment Sales Market Share by Region
8.2 North America
8.2.1 North America Semiconductor Assembly and Test Equipment Sales by Country
8.2.2 U.S.
8.2.3 Canada
8.2.4 Mexico
8.3 Europe
8.3.1 Europe Semiconductor Assembly and Test Equipment Sales by Country
8.3.2 Germany
8.3.3 France
8.3.4 U.K.
8.3.5 Italy
8.3.6 Russia
8.4 Asia Pacific
8.4.1 Asia Pacific Semiconductor Assembly and Test Equipment Sales by Region
8.4.2 China
8.4.3 Japan
8.4.4 South Korea
8.4.5 India
8.4.6 Southeast Asia
8.5 South America
8.5.1 South America Semiconductor Assembly and Test Equipment Sales by Country
8.5.2 Brazil
8.5.3 Argentina
8.5.4 Columbia
8.6 Middle East and Africa
8.6.1 Middle East and Africa Semiconductor Assembly and Test Equipment Sales by Region
8.6.2 Saudi Arabia
8.6.3 UAE
8.6.4 Egypt
8.6.5 Nigeria
8.6.6 South Africa
9 Key Companies Profile
9.1 ASM Pacific Technology
9.1.1 ASM Pacific Technology Semiconductor Assembly and Test Equipment Basic Information
9.1.2 ASM Pacific Technology Semiconductor Assembly and Test Equipment Product Overview
9.1.3 ASM Pacific Technology Semiconductor Assembly and Test Equipment Product Market Performance
9.1.4 ASM Pacific Technology Business Overview
9.1.5 ASM Pacific Technology Semiconductor Assembly and Test Equipment SWOT Analysis
9.1.6 ASM Pacific Technology Recent Developments
9.2 Kulicke and Soffa Industries
9.2.1 Kulicke and Soffa Industries Semiconductor Assembly and Test Equipment Basic Information
9.2.2 Kulicke and Soffa Industries Semiconductor Assembly and Test Equipment Product Overview
9.2.3 Kulicke and Soffa Industries Semiconductor Assembly and Test Equipment Product Market Performance
9.2.4 Kulicke and Soffa Industries Business Overview
9.2.5 Kulicke and Soffa Industries Semiconductor Assembly and Test Equipment SWOT Analysis
9.2.6 Kulicke and Soffa Industries Recent Developments
9.3 Besi
9.3.1 Besi Semiconductor Assembly and Test Equipment Basic Information
9.3.2 Besi Semiconductor Assembly and Test Equipment Product Overview
9.3.3 Besi Semiconductor Assembly and Test Equipment Product Market Performance
9.3.4 Besi Semiconductor Assembly and Test Equipment SWOT Analysis
9.3.5 Besi Business Overview
9.3.6 Besi Recent Developments
9.4 ACCRETECH
9.4.1 ACCRETECH Semiconductor Assembly and Test Equipment Basic Information
9.4.2 ACCRETECH Semiconductor Assembly and Test Equipment Product Overview
9.4.3 ACCRETECH Semiconductor Assembly and Test Equipment Product Market Performance
9.4.4 ACCRETECH Business Overview
9.4.5 ACCRETECH Recent Developments
9.5 SHINKAWA
9.5.1 SHINKAWA Semiconductor Assembly and Test Equipment Basic Information
9.5.2 SHINKAWA Semiconductor Assembly and Test Equipment Product Overview
9.5.3 SHINKAWA Semiconductor Assembly and Test Equipment Product Market Performance
9.5.4 SHINKAWA Business Overview
9.5.5 SHINKAWA Recent Developments
9.6 Palomar Technologies
9.6.1 Palomar Technologies Semiconductor Assembly and Test Equipment Basic Information
9.6.2 Palomar Technologies Semiconductor Assembly and Test Equipment Product Overview
9.6.3 Palomar Technologies Semiconductor Assembly and Test Equipment Product Market Performance
9.6.4 Palomar Technologies Business Overview
9.6.5 Palomar Technologies Recent Developments
9.7 Hesse Mechatronics
9.7.1 Hesse Mechatronics Semiconductor Assembly and Test Equipment Basic Information
9.7.2 Hesse Mechatronics Semiconductor Assembly and Test Equipment Product Overview
9.7.3 Hesse Mechatronics Semiconductor Assembly and Test Equipment Product Market Performance
9.7.4 Hesse Mechatronics Business Overview
9.7.5 Hesse Mechatronics Recent Developments
9.8 Toray Engineering
9.8.1 Toray Engineering Semiconductor Assembly and Test Equipment Basic Information
9.8.2 Toray Engineering Semiconductor Assembly and Test Equipment Product Overview
9.8.3 Toray Engineering Semiconductor Assembly and Test Equipment Product Market Performance
9.8.4 Toray Engineering Business Overview
9.8.5 Toray Engineering Recent Developments
9.9 West Bond
9.9.1 West Bond Semiconductor Assembly and Test Equipment Basic Information
9.9.2 West Bond Semiconductor Assembly and Test Equipment Product Overview
9.9.3 West Bond Semiconductor Assembly and Test Equipment Product Market Performance
9.9.4 West Bond Business Overview
9.9.5 West Bond Recent Developments
9.10 HYBOND
9.10.1 HYBOND Semiconductor Assembly and Test Equipment Basic Information
9.10.2 HYBOND Semiconductor Assembly and Test Equipment Product Overview
9.10.3 HYBOND Semiconductor Assembly and Test Equipment Product Market Performance
9.10.4 HYBOND Business Overview
9.10.5 HYBOND Recent Developments
9.11 DIAS Automation
9.11.1 DIAS Automation Semiconductor Assembly and Test Equipment Basic Information
9.11.2 DIAS Automation Semiconductor Assembly and Test Equipment Product Overview
9.11.3 DIAS Automation Semiconductor Assembly and Test Equipment Product Market Performance
9.11.4 DIAS Automation Business Overview
9.11.5 DIAS Automation Recent Developments
9.12 Teradyne
9.12.1 Teradyne Semiconductor Assembly and Test Equipment Basic Information
9.12.2 Teradyne Semiconductor Assembly and Test Equipment Product Overview
9.12.3 Teradyne Semiconductor Assembly and Test Equipment Product Market Performance
9.12.4 Teradyne Business Overview
9.12.5 Teradyne Recent Developments
9.13 Advantest
9.13.1 Advantest Semiconductor Assembly and Test Equipment Basic Information
9.13.2 Advantest Semiconductor Assembly and Test Equipment Product Overview
9.13.3 Advantest Semiconductor Assembly and Test Equipment Product Market Performance
9.13.4 Advantest Business Overview
9.13.5 Advantest Recent Developments
9.14 Cohu
9.14.1 Cohu Semiconductor Assembly and Test Equipment Basic Information
9.14.2 Cohu Semiconductor Assembly and Test Equipment Product Overview
9.14.3 Cohu Semiconductor Assembly and Test Equipment Product Market Performance
9.14.4 Cohu Business Overview
9.14.5 Cohu Recent Developments
9.15 Chroma
9.15.1 Chroma Semiconductor Assembly and Test Equipment Basic Information
9.15.2 Chroma Semiconductor Assembly and Test Equipment Product Overview
9.15.3 Chroma Semiconductor Assembly and Test Equipment Product Market Performance
9.15.4 Chroma Business Overview
9.15.5 Chroma Recent Developments
9.16 Hangzhou Changchuan Technology
9.16.1 Hangzhou Changchuan Technology Semiconductor Assembly and Test Equipment Basic Information
9.16.2 Hangzhou Changchuan Technology Semiconductor Assembly and Test Equipment Product Overview
9.16.3 Hangzhou Changchuan Technology Semiconductor Assembly and Test Equipment Product Market Performance
9.16.4 Hangzhou Changchuan Technology Business Overview
9.16.5 Hangzhou Changchuan Technology Recent Developments
9.17 Beijing Huafeng Test and Control Technology
9.17.1 Beijing Huafeng Test and Control Technology Semiconductor Assembly and Test Equipment Basic Information
9.17.2 Beijing Huafeng Test and Control Technology Semiconductor Assembly and Test Equipment Product Overview
9.17.3 Beijing Huafeng Test and Control Technology Semiconductor Assembly and Test Equipment Product Market Performance
9.17.4 Beijing Huafeng Test and Control Technology Business Overview
9.17.5 Beijing Huafeng Test and Control Technology Recent Developments
9.18 Shibasoku
9.18.1 Shibasoku Semiconductor Assembly and Test Equipment Basic Information
9.18.2 Shibasoku Semiconductor Assembly and Test Equipment Product Overview
9.18.3 Shibasoku Semiconductor Assembly and Test Equipment Product Market Performance
9.18.4 Shibasoku Business Overview
9.18.5 Shibasoku Recent Developments
9.19 Powertech
9.19.1 Powertech Semiconductor Assembly and Test Equipment Basic Information
9.19.2 Powertech Semiconductor Assembly and Test Equipment Product Overview
9.19.3 Powertech Semiconductor Assembly and Test Equipment Product Market Performance
9.19.4 Powertech Business Overview
9.19.5 Powertech Recent Developments
9.20 SPEA
9.20.1 SPEA Semiconductor Assembly and Test Equipment Basic Information
9.20.2 SPEA Semiconductor Assembly and Test Equipment Product Overview
9.20.3 SPEA Semiconductor Assembly and Test Equipment Product Market Performance
9.20.4 SPEA Business Overview
9.20.5 SPEA Recent Developments
10 Semiconductor Assembly and Test Equipment Market Forecast by Region
10.1 Global Semiconductor Assembly and Test Equipment Market Size Forecast
10.2 Global Semiconductor Assembly and Test Equipment Market Forecast by Region
10.2.1 North America Market Size Forecast by Country
10.2.2 Europe Semiconductor Assembly and Test Equipment Market Size Forecast by Country
10.2.3 Asia Pacific Semiconductor Assembly and Test Equipment Market Size Forecast by Region
10.2.4 South America Semiconductor Assembly and Test Equipment Market Size Forecast by Country
10.2.5 Middle East and Africa Forecasted Consumption of Semiconductor Assembly and Test Equipment by Country
11 Forecast Market by Type and by Application (2025-2032)
11.1 Global Semiconductor Assembly and Test Equipment Market Forecast by Type (2025-2032)
11.1.1 Global Forecasted Sales of Semiconductor Assembly and Test Equipment by Type (2025-2032)
11.1.2 Global Semiconductor Assembly and Test Equipment Market Size Forecast by Type (2025-2032)
11.1.3 Global Forecasted Price of Semiconductor Assembly and Test Equipment by Type (2025-2032)
11.2 Global Semiconductor Assembly and Test Equipment Market Forecast by Application (2025-2032)
11.2.1 Global Semiconductor Assembly and Test Equipment Sales (K Units) Forecast by Application
11.2.2 Global Semiconductor Assembly and Test Equipment Market Size (M USD) Forecast by Application (2025-2032)
12 Conclusion and Key FindingsList of Tables
Table 1. Introduction of the Type
Table 2. Introduction of the Application
Table 3. Market Size (M USD) Segment Executive Summary
Table 4. Semiconductor Assembly and Test Equipment Market Size Comparison by Region (M USD)
Table 5. Global Semiconductor Assembly and Test Equipment Sales (K Units) by Manufacturers (2019-2025)
Table 6. Global Semiconductor Assembly and Test Equipment Sales Market Share by Manufacturers (2019-2025)
Table 7. Global Semiconductor Assembly and Test Equipment Revenue (M USD) by Manufacturers (2019-2025)
Table 8. Global Semiconductor Assembly and Test Equipment Revenue Share by Manufacturers (2019-2025)
Table 9. Company Type (Tier 1, Tier 2, and Tier 3) & (based on the Revenue in Semiconductor Assembly and Test Equipment as of 2022)
Table 10. Global Market Semiconductor Assembly and Test Equipment Average Price (USD/Unit) of Key Manufacturers (2019-2025)
Table 11. Manufacturers Semiconductor Assembly and Test Equipment Sales Sites and Area Served
Table 12. Manufacturers Semiconductor Assembly and Test Equipment Product Type
Table 13. Global Semiconductor Assembly and Test Equipment Manufacturers Market Concentration Ratio (CR5 and HHI)
Table 14. Mergers & Acquisitions, Expansion Plans
Table 15. Industry Chain Map of Semiconductor Assembly and Test Equipment
Table 16. Market Overview of Key Raw Materials
Table 17. Midstream Market Analysis
Table 18. Downstream Customer Analysis
Table 19. Key Development Trends
Table 20. Driving Factors
Table 21. Semiconductor Assembly and Test Equipment Market Challenges
Table 22. Global Semiconductor Assembly and Test Equipment Sales by Type (K Units)
Table 23. Global Semiconductor Assembly and Test Equipment Market Size by Type (M USD)
Table 24. Global Semiconductor Assembly and Test Equipment Sales (K Units) by Type (2019-2025)
Table 25. Global Semiconductor Assembly and Test Equipment Sales Market Share by Type (2019-2025)
Table 26. Global Semiconductor Assembly and Test Equipment Market Size (M USD) by Type (2019-2025)
Table 27. Global Semiconductor Assembly and Test Equipment Market Size Share by Type (2019-2025)
Table 28. Global Semiconductor Assembly and Test Equipment Price (USD/Unit) by Type (2019-2025)
Table 29. Global Semiconductor Assembly and Test Equipment Sales (K Units) by Application
Table 30. Global Semiconductor Assembly and Test Equipment Market Size by Application
Table 31. Global Semiconductor Assembly and Test Equipment Sales by Application (2019-2025) & (K Units)
Table 32. Global Semiconductor Assembly and Test Equipment Sales Market Share by Application (2019-2025)
Table 33. Global Semiconductor Assembly and Test Equipment Sales by Application (2019-2025) & (M USD)
Table 34. Global Semiconductor Assembly and Test Equipment Market Share by Application (2019-2025)
Table 35. Global Semiconductor Assembly and Test Equipment Sales Growth Rate by Application (2019-2025)
Table 36. Global Semiconductor Assembly and Test Equipment Sales by Region (2019-2025) & (K Units)
Table 37. Global Semiconductor Assembly and Test Equipment Sales Market Share by Region (2019-2025)
Table 38. North America Semiconductor Assembly and Test Equipment Sales by Country (2019-2025) & (K Units)
Table 39. Europe Semiconductor Assembly and Test Equipment Sales by Country (2019-2025) & (K Units)
Table 40. Asia Pacific Semiconductor Assembly and Test Equipment Sales by Region (2019-2025) & (K Units)
Table 41. South America Semiconductor Assembly and Test Equipment Sales by Country (2019-2025) & (K Units)
Table 42. Middle East and Africa Semiconductor Assembly and Test Equipment Sales by Region (2019-2025) & (K Units)
Table 43. ASM Pacific Technology Semiconductor Assembly and Test Equipment Basic Information
Table 44. ASM Pacific Technology Semiconductor Assembly and Test Equipment Product Overview
Table 45. ASM Pacific Technology Semiconductor Assembly and Test Equipment Sales (K Units), Revenue (M USD), Price (USD/Unit) and Gross Margin (2019-2025)
Table 46. ASM Pacific Technology Business Overview
Table 47. ASM Pacific Technology Semiconductor Assembly and Test Equipment SWOT Analysis
Table 48. ASM Pacific Technology Recent Developments
Table 49. Kulicke and Soffa Industries Semiconductor Assembly and Test Equipment Basic Information
Table 50. Kulicke and Soffa Industries Semiconductor Assembly and Test Equipment Product Overview
Table 51. Kulicke and Soffa Industries Semiconductor Assembly and Test Equipment Sales (K Units), Revenue (M USD), Price (USD/Unit) and Gross Margin (2019-2025)
Table 52. Kulicke and Soffa Industries Business Overview
Table 53. Kulicke and Soffa Industries Semiconductor Assembly and Test Equipment SWOT Analysis
Table 54. Kulicke and Soffa Industries Recent Developments
Table 55. Besi Semiconductor Assembly and Test Equipment Basic Information
Table 56. Besi Semiconductor Assembly and Test Equipment Product Overview
Table 57. Besi Semiconductor Assembly and Test Equipment Sales (K Units), Revenue (M USD), Price (USD/Unit) and Gross Margin (2019-2025)
Table 58. Besi Semiconductor Assembly and Test Equipment SWOT Analysis
Table 59. Besi Business Overview
Table 60. Besi Recent Developments
Table 61. ACCRETECH Semiconductor Assembly and Test Equipment Basic Information
Table 62. ACCRETECH Semiconductor Assembly and Test Equipment Product Overview
Table 63. ACCRETECH Semiconductor Assembly and Test Equipment Sales (K Units), Revenue (M USD), Price (USD/Unit) and Gross Margin (2019-2025)
Table 64. ACCRETECH Business Overview
Table 65. ACCRETECH Recent Developments
Table 66. SHINKAWA Semiconductor Assembly and Test Equipment Basic Information
Table 67. SHINKAWA Semiconductor Assembly and Test Equipment Product Overview
Table 68. SHINKAWA Semiconductor Assembly and Test Equipment Sales (K Units), Revenue (M USD), Price (USD/Unit) and Gross Margin (2019-2025)
Table 69. SHINKAWA Business Overview
Table 70. SHINKAWA Recent Developments
Table 71. Palomar Technologies Semiconductor Assembly and Test Equipment Basic Information
Table 72. Palomar Technologies Semiconductor Assembly and Test Equipment Product Overview
Table 73. Palomar Technologies Semiconductor Assembly and Test Equipment Sales (K Units), Revenue (M USD), Price (USD/Unit) and Gross Margin (2019-2025)
Table 74. Palomar Technologies Business Overview
Table 75. Palomar Technologies Recent Developments
Table 76. Hesse Mechatronics Semiconductor Assembly and Test Equipment Basic Information
Table 77. Hesse Mechatronics Semiconductor Assembly and Test Equipment Product Overview
Table 78. Hesse Mechatronics Semiconductor Assembly and Test Equipment Sales (K Units), Revenue (M USD), Price (USD/Unit) and Gross Margin (2019-2025)
Table 79. Hesse Mechatronics Business Overview
Table 80. Hesse Mechatronics Recent Developments
Table 81. Toray Engineering Semiconductor Assembly and Test Equipment Basic Information
Table 82. Toray Engineering Semiconductor Assembly and Test Equipment Product Overview
Table 83. Toray Engineering Semiconductor Assembly and Test Equipment Sales (K Units), Revenue (M USD), Price (USD/Unit) and Gross Margin (2019-2025)
Table 84. Toray Engineering Business Overview
Table 85. Toray Engineering Recent Developments
Table 86. West Bond Semiconductor Assembly and Test Equipment Basic Information
Table 87. West Bond Semiconductor Assembly and Test Equipment Product Overview
Table 88. West Bond Semiconductor Assembly and Test Equipment Sales (K Units), Revenue (M USD), Price (USD/Unit) and Gross Margin (2019-2025)
Table 89. West Bond Business Overview
Table 90. West Bond Recent Developments
Table 91. HYBOND Semiconductor Assembly and Test Equipment Basic Information
Table 92. HYBOND Semiconductor Assembly and Test Equipment Product Overview
Table 93. HYBOND Semiconductor Assembly and Test Equipment Sales (K Units), Revenue (M USD), Price (USD/Unit) and Gross Margin (2019-2025)
Table 94. HYBOND Business Overview
Table 95. HYBOND Recent Developments
Table 96. DIAS Automation Semiconductor Assembly and Test Equipment Basic Information
Table 97. DIAS Automation Semiconductor Assembly and Test Equipment Product Overview
Table 98. DIAS Automation Semiconductor Assembly and Test Equipment Sales (K Units), Revenue (M USD), Price (USD/Unit) and Gross Margin (2019-2025)
Table 99. DIAS Automation Business Overview
Table 100. DIAS Automation Recent Developments
Table 101. Teradyne Semiconductor Assembly and Test Equipment Basic Information
Table 102. Teradyne Semiconductor Assembly and Test Equipment Product Overview
Table 103. Teradyne Semiconductor Assembly and Test Equipment Sales (K Units), Revenue (M USD), Price (USD/Unit) and Gross Margin (2019-2025)
Table 104. Teradyne Business Overview
Table 105. Teradyne Recent Developments
Table 106. Advantest Semiconductor Assembly and Test Equipment Basic Information
Table 107. Advantest Semiconductor Assembly and Test Equipment Product Overview
Table 108. Advantest Semiconductor Assembly and Test Equipment Sales (K Units), Revenue (M USD), Price (USD/Unit) and Gross Margin (2019-2025)
Table 109. Advantest Business Overview
Table 110. Advantest Recent Developments
Table 111. Cohu Semiconductor Assembly and Test Equipment Basic Information
Table 112. Cohu Semiconductor Assembly and Test Equipment Product Overview
Table 113. Cohu Semiconductor Assembly and Test Equipment Sales (K Units), Revenue (M USD), Price (USD/Unit) and Gross Margin (2019-2025)
Table 114. Cohu Business Overview
Table 115. Cohu Recent Developments
Table 116. Chroma Semiconductor Assembly and Test Equipment Basic Information
Table 117. Chroma Semiconductor Assembly and Test Equipment Product Overview
Table 118. Chroma Semiconductor Assembly and Test Equipment Sales (K Units), Revenue (M USD), Price (USD/Unit) and Gross Margin (2019-2025)
Table 119. Chroma Business Overview
Table 120. Chroma Recent Developments
Table 121. Hangzhou Changchuan Technology Semiconductor Assembly and Test Equipment Basic Information
Table 122. Hangzhou Changchuan Technology Semiconductor Assembly and Test Equipment Product Overview
Table 123. Hangzhou Changchuan Technology Semiconductor Assembly and Test Equipment Sales (K Units), Revenue (M USD), Price (USD/Unit) and Gross Margin (2019-2025)
Table 124. Hangzhou Changchuan Technology Business Overview
Table 125. Hangzhou Changchuan Technology Recent Developments
Table 126. Beijing Huafeng Test and Control Technology Semiconductor Assembly and Test Equipment Basic Information
Table 127. Beijing Huafeng Test and Control Technology Semiconductor Assembly and Test Equipment Product Overview
Table 128. Beijing Huafeng Test and Control Technology Semiconductor Assembly and Test Equipment Sales (K Units), Revenue (M USD), Price (USD/Unit) and Gross Margin (2019-2025)
Table 129. Beijing Huafeng Test and Control Technology Business Overview
Table 130. Beijing Huafeng Test and Control Technology Recent Developments
Table 131. Shibasoku Semiconductor Assembly and Test Equipment Basic Information
Table 132. Shibasoku Semiconductor Assembly and Test Equipment Product Overview
Table 133. Shibasoku Semiconductor Assembly and Test Equipment Sales (K Units), Revenue (M USD), Price (USD/Unit) and Gross Margin (2019-2025)
Table 134. Shibasoku Business Overview
Table 135. Shibasoku Recent Developments
Table 136. Powertech Semiconductor Assembly and Test Equipment Basic Information
Table 137. Powertech Semiconductor Assembly and Test Equipment Product Overview
Table 138. Powertech Semiconductor Assembly and Test Equipment Sales (K Units), Revenue (M USD), Price (USD/Unit) and Gross Margin (2019-2025)
Table 139. Powertech Business Overview
Table 140. Powertech Recent Developments
Table 141. SPEA Semiconductor Assembly and Test Equipment Basic Information
Table 142. SPEA Semiconductor Assembly and Test Equipment Product Overview
Table 143. SPEA Semiconductor Assembly and Test Equipment Sales (K Units), Revenue (M USD), Price (USD/Unit) and Gross Margin (2019-2025)
Table 144. SPEA Business Overview
Table 145. SPEA Recent Developments
Table 146. Global Semiconductor Assembly and Test Equipment Sales Forecast by Region (2025-2030) & (K Units)
Table 147. Global Semiconductor Assembly and Test Equipment Market Size Forecast by Region (2025-2030) & (M USD)
Table 148. North America Semiconductor Assembly and Test Equipment Sales Forecast by Country (2025-2030) & (K Units)
Table 149. North America Semiconductor Assembly and Test Equipment Market Size Forecast by Country (2025-2030) & (M USD)
Table 150. Europe Semiconductor Assembly and Test Equipment Sales Forecast by Country (2025-2030) & (K Units)
Table 151. Europe Semiconductor Assembly and Test Equipment Market Size Forecast by Country (2025-2030) & (M USD)
Table 152. Asia Pacific Semiconductor Assembly and Test Equipment Sales Forecast by Region (2025-2030) & (K Units)
Table 153. Asia Pacific Semiconductor Assembly and Test Equipment Market Size Forecast by Region (2025-2030) & (M USD)
Table 154. South America Semiconductor Assembly and Test Equipment Sales Forecast by Country (2025-2030) & (K Units)
Table 155. South America Semiconductor Assembly and Test Equipment Market Size Forecast by Country (2025-2030) & (M USD)
Table 156. Middle East and Africa Semiconductor Assembly and Test Equipment Consumption Forecast by Country (2025-2030) & (Units)
Table 157. Middle East and Africa Semiconductor Assembly and Test Equipment Market Size Forecast by Country (2025-2030) & (M USD)
Table 158. Global Semiconductor Assembly and Test Equipment Sales Forecast by Type (2025-2030) & (K Units)
Table 159. Global Semiconductor Assembly and Test Equipment Market Size Forecast by Type (2025-2030) & (M USD)
Table 160. Global Semiconductor Assembly and Test Equipment Price Forecast by Type (2025-2030) & (USD/Unit)
Table 161. Global Semiconductor Assembly and Test Equipment Sales (K Units) Forecast by Application (2025-2030)
Table 162. Global Semiconductor Assembly and Test Equipment Market Size Forecast by Application (2025-2030) & (M USD)
List of Figures
Figure 1. Product Picture of Semiconductor Assembly and Test Equipment
Figure 2. Data Triangulation
Figure 3. Key Caveats
Figure 4. Global Semiconductor Assembly and Test Equipment Market Size (M USD), 2019-2030
Figure 5. Global Semiconductor Assembly and Test Equipment Market Size (M USD) (2019-2030)
Figure 6. Global Semiconductor Assembly and Test Equipment Sales (K Units) & (2019-2030)
Figure 7. Evaluation Matrix of Segment Market Development Potential (Type)
Figure 8. Evaluation Matrix of Segment Market Development Potential (Application)
Figure 9. Evaluation Matrix of Regional Market Development Potential
Figure 10. Semiconductor Assembly and Test Equipment Market Size by Country (M USD)
Figure 11. Semiconductor Assembly and Test Equipment Sales Share by Manufacturers in 2023
Figure 12. Global Semiconductor Assembly and Test Equipment Revenue Share by Manufacturers in 2023
Figure 13. Semiconductor Assembly and Test Equipment Market Share by Company Type (Tier 1, Tier 2 and Tier 3): 2023
Figure 14. Global Market Semiconductor Assembly and Test Equipment Average Price (USD/Unit) of Key Manufacturers in 2023
Figure 15. The Global 5 and 10 Largest Players: Market Share by Semiconductor Assembly and Test Equipment Revenue in 2023
Figure 16. Evaluation Matrix of Segment Market Development Potential (Type)
Figure 17. Global Semiconductor Assembly and Test Equipment Market Share by Type
Figure 18. Sales Market Share of Semiconductor Assembly and Test Equipment by Type (2019-2025)
Figure 19. Sales Market Share of Semiconductor Assembly and Test Equipment by Type in 2023
Figure 20. Market Size Share of Semiconductor Assembly and Test Equipment by Type (2019-2025)
Figure 21. Market Size Market Share of Semiconductor Assembly and Test Equipment by Type in 2023
Figure 22. Evaluation Matrix of Segment Market Development Potential (Application)
Figure 23. Global Semiconductor Assembly and Test Equipment Market Share by Application
Figure 24. Global Semiconductor Assembly and Test Equipment Sales Market Share by Application (2019-2025)
Figure 25. Global Semiconductor Assembly and Test Equipment Sales Market Share by Application in 2023
Figure 26. Global Semiconductor Assembly and Test Equipment Market Share by Application (2019-2025)
Figure 27. Global Semiconductor Assembly and Test Equipment Market Share by Application in 2023
Figure 28. Global Semiconductor Assembly and Test Equipment Sales Growth Rate by Application (2019-2025)
Figure 29. Global Semiconductor Assembly and Test Equipment Sales Market Share by Region (2019-2025)
Figure 30. North America Semiconductor Assembly and Test Equipment Sales and Growth Rate (2019-2025) & (K Units)
Figure 31. North America Semiconductor Assembly and Test Equipment Sales Market Share by Country in 2023
Figure 32. U.S. Semiconductor Assembly and Test Equipment Sales and Growth Rate (2019-2025) & (K Units)
Figure 33. Canada Semiconductor Assembly and Test Equipment Sales (K Units) and Growth Rate (2019-2025)
Figure 34. Mexico Semiconductor Assembly and Test Equipment Sales (Units) and Growth Rate (2019-2025)
Figure 35. Europe Semiconductor Assembly and Test Equipment Sales and Growth Rate (2019-2025) & (K Units)
Figure 36. Europe Semiconductor Assembly and Test Equipment Sales Market Share by Country in 2023
Figure 37. Germany Semiconductor Assembly and Test Equipment Sales and Growth Rate (2019-2025) & (K Units)
Figure 38. France Semiconductor Assembly and Test Equipment Sales and Growth Rate (2019-2025) & (K Units)
Figure 39. U.K. Semiconductor Assembly and Test Equipment Sales and Growth Rate (2019-2025) & (K Units)
Figure 40. Italy Semiconductor Assembly and Test Equipment Sales and Growth Rate (2019-2025) & (K Units)
Figure 41. Russia Semiconductor Assembly and Test Equipment Sales and Growth Rate (2019-2025) & (K Units)
Figure 42. Asia Pacific Semiconductor Assembly and Test Equipment Sales and Growth Rate (K Units)
Figure 43. Asia Pacific Semiconductor Assembly and Test Equipment Sales Market Share by Region in 2023
Figure 44. China Semiconductor Assembly and Test Equipment Sales and Growth Rate (2019-2025) & (K Units)
Figure 45. Japan Semiconductor Assembly and Test Equipment Sales and Growth Rate (2019-2025) & (K Units)
Figure 46. South Korea Semiconductor Assembly and Test Equipment Sales and Growth Rate (2019-2025) & (K Units)
Figure 47. India Semiconductor Assembly and Test Equipment Sales and Growth Rate (2019-2025) & (K Units)
Figure 48. Southeast Asia Semiconductor Assembly and Test Equipment Sales and Growth Rate (2019-2025) & (K Units)
Figure 49. South America Semiconductor Assembly and Test Equipment Sales and Growth Rate (K Units)
Figure 50. South America Semiconductor Assembly and Test Equipment Sales Market Share by Country in 2023
Figure 51. Brazil Semiconductor Assembly and Test Equipment Sales and Growth Rate (2019-2025) & (K Units)
Figure 52. Argentina Semiconductor Assembly and Test Equipment Sales and Growth Rate (2019-2025) & (K Units)
Figure 53. Columbia Semiconductor Assembly and Test Equipment Sales and Growth Rate (2019-2025) & (K Units)
Figure 54. Middle East and Africa Semiconductor Assembly and Test Equipment Sales and Growth Rate (K Units)
Figure 55. Middle East and Africa Semiconductor Assembly and Test Equipment Sales Market Share by Region in 2023
Figure 56. Saudi Arabia Semiconductor Assembly and Test Equipment Sales and Growth Rate (2019-2025) & (K Units)
Figure 57. UAE Semiconductor Assembly and Test Equipment Sales and Growth Rate (2019-2025) & (K Units)
Figure 58. Egypt Semiconductor Assembly and Test Equipment Sales and Growth Rate (2019-2025) & (K Units)
Figure 59. Nigeria Semiconductor Assembly and Test Equipment Sales and Growth Rate (2019-2025) & (K Units)
Figure 60. South Africa Semiconductor Assembly and Test Equipment Sales and Growth Rate (2019-2025) & (K Units)
Figure 61. Global Semiconductor Assembly and Test Equipment Sales Forecast by Volume (2019-2030) & (K Units)
Figure 62. Global Semiconductor Assembly and Test Equipment Market Size Forecast by Value (2019-2030) & (M USD)
Figure 63. Global Semiconductor Assembly and Test Equipment Sales Market Share Forecast by Type (2025-2030)
Figure 64. Global Semiconductor Assembly and Test Equipment Market Share Forecast by Type (2025-2030)
Figure 65. Global Semiconductor Assembly and Test Equipment Sales Forecast by Application (2025-2030)
Figure 66. Global Semiconductor Assembly and Test Equipment Market Share Forecast by Application (2025-2030)