MARKET INSIGHTS
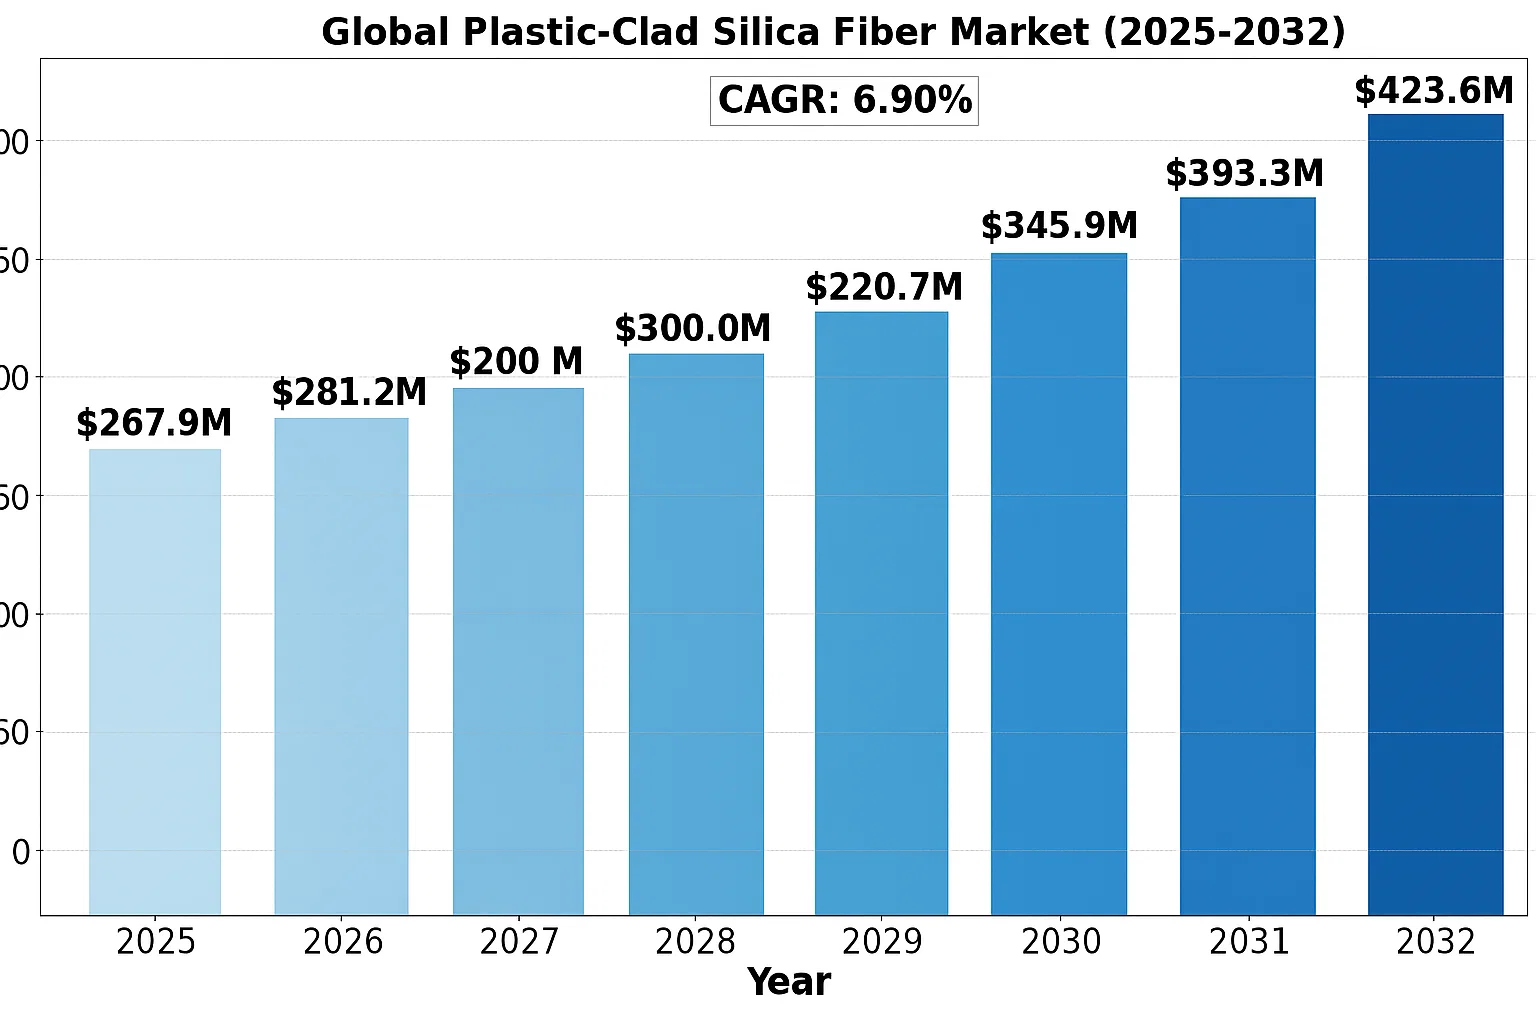
The Global Plastic-Clad Silica Fiber Market size was valued at US$ 267.9 million in 2024 and is projected to reach US$ 423.6 million by 2032, at a CAGR of 6.9% during the forecast period 2025-2032.
Plastic-clad silica (PCS) fibers are optical fibers featuring a glass core surrounded by plastic cladding. These specialized fibers combine the high light transmission properties of glass with the durability and flexibility of polymer materials. The technology finds applications in medical devices, industrial sensors, and scientific instrumentation where both optical performance and mechanical resilience are required.
The market growth is driven by increasing demand for minimally invasive medical procedures and industrial automation. PCS fibers offer advantages in endoscopy and laser delivery systems because their plastic cladding provides better flexibility compared to all-glass fibers. However, competition from alternative technologies like all-plastic fibers in cost-sensitive applications presents a market challenge. Key players including Timbercon and LEONI Fiber Optics are expanding their product portfolios to address emerging applications in biophotonics and industrial sensing.
MARKET DYNAMICS
MARKET DRIVERS
Expanding Fiber Optic Communication Networks Drive Demand for Plastic-Clad Silica Fibers
The global fiber optics market is experiencing significant growth, with projections indicating a compound annual growth rate of over 8% in the coming years. This expansion is directly benefiting plastic-clad silica (PCS) fibers due to their cost-effectiveness and performance advantages. PCS fibers are increasingly adopted in short-distance communication applications where their core-cladding interface characteristics provide excellent light transmission properties. The telecommunications sector’s ongoing shift towards 5G networks and fiber-to-the-home (FTTH) deployments creates sustained demand for reliable optical fibers.
Medical Sector Adoption Enhances Growth Prospects
The medical industry’s growing preference for minimally invasive procedures is driving demand for high-quality optical fibers in endoscopic and diagnostic applications. PCS fibers are particularly valued in medical settings where their flexibility and durability are critical. The global endoscopy equipment market, valued at approximately $40 billion, represents a significant addressable market for PCS fiber manufacturers. These fibers enable superior imaging quality while maintaining the sterility and safety requirements essential in healthcare environments.
Industrial Automation Trends Create New Applications
Industry 4.0 initiatives and the increasing automation of manufacturing processes are creating substantial growth opportunities for PCS fibers. Their resistance to electromagnetic interference makes them ideal for industrial sensing applications in harsh environments. The fibers are being deployed for monitoring temperature, pressure, and strain in industrial settings where conventional sensors fail. With the industrial sensors market forecast to exceed $30 billion by 2026, PCS fibers are well-positioned to capture a growing share of this application segment.
MARKET RESTRAINTS
Material Limitations Constrain High-Performance Applications
While PCS fibers offer many advantages, their material composition presents certain limitations in specialized applications. The plastic cladding’s thermal stability is inferior to all-glass fibers, restricting their use in extreme temperature environments above 125°C. This thermal constraint makes them unsuitable for certain aerospace, oilfield, and high-temperature industrial applications where all-silica fibers dominate. Additionally, the numerical aperture of PCS fibers is typically higher than all-glass counterparts, which can lead to greater modal dispersion in long-distance transmission.
Price Competition from Alternative Technologies
The PCS fiber market faces intensifying competition from both lower-cost polymer optical fibers (POFs) and higher-performance all-glass fibers. POFs have captured significant market share in short-distance applications like automotive infotainment systems, while advances in manufacturing have reduced the price premium of all-glass fibers. This squeeze from both ends of the performance spectrum forces PCS fiber manufacturers to continually justify their value proposition in an increasingly competitive marketplace.
Supply Chain Vulnerabilities Impact Production
The specialized materials required for PCS fiber production, including high-purity silica and proprietary polymer claddings, create supply chain vulnerabilities. Recent semiconductor shortages have demonstrated how disruptions in the broader electronics supply chain can affect fiber optic component availability. For PCS fiber manufacturers, maintaining consistent supplies of these specialized materials while managing costs remains an ongoing operational challenge that can impact market stability.
MARKET OPPORTUNITIES
Emerging Photonics Applications Create Growth Potential
The expanding field of integrated photonics presents significant opportunities for PCS fiber applications. As photonic circuits become more prevalent in computing, sensing, and communications, the need grows for efficient light coupling between components. PCS fibers’ large core diameters and numerical apertures make them well-suited for these interconnection applications. The integrated photonics market, projected to grow at over 20% annually, represents a highly attractive target for PCS fiber manufacturers.
Defense and Security Sector Expansion
Military modernization programs worldwide are driving increased investment in fiber optic technologies for communications, sensing, and weapon systems. PCS fibers are finding new applications in perimeter security systems, undersea monitoring, and avionics where their mechanical robustness and electromagnetic immunity provide distinct advantages. With global defense spending exceeding $2 trillion annually, even capturing a small portion of this market represents considerable growth potential for PCS fiber providers.
Development of Specialty PCS Fiber Variants
Innovations in polymer chemistry and fiber manufacturing techniques enable development of specialized PCS fiber variants with enhanced properties. Recent advances include radiation-resistant formulations for nuclear applications and bioactive claddings for medical applications. These premium product variants command higher margins and open new market segments. The ability to engineer fibers with customized optical and mechanical properties creates opportunities to address niche applications that standard products cannot serve.
MARKET CHALLENGES
Technological Complexity Restrains Market Entry
PCS fiber manufacturing requires specialized expertise in both glass processing and polymer science, creating significant barriers to entry. The precision needed to maintain consistent core-cladding interfaces demands sophisticated process control systems. New entrants face steep learning curves and substantial capital investment requirements, which limits market competition but also constrains overall market expansion through reduced innovation capacity.
Standardization and Certification Hurdles
The lack of universal standards for PCS fiber specifications creates challenges in market development. Different industries and applications require varying certification processes, from medical device approvals to military specifications. Navigating these diverse certification landscapes adds complexity to product development cycles and increases time-to-market for new applications.
Availability of Skilled Technical Workforce
The specialized nature of PCS fiber technology creates persistent challenges in workforce development. There exists a limited pool of engineers and technicians with expertise in both optical fiber technology and polymer science. This skills gap forces companies to invest heavily in training programs while potentially limiting their ability to scale production to meet growing demand.
PLASTIC-CLAD SILICA FIBER MARKET TRENDS
Rising Demand for High-Performance Optical Fibers in Medical Applications
The global plastic-clad silica (PCS) fiber market is experiencing robust growth due to increasing demand from the medical sector, where precision and reliability are paramount. PCS fibers, known for their high numerical aperture and excellent light transmission properties, are widely used in endoscopic imaging, laser surgeries, and diagnostic equipment. The medical device industry is projected to grow at an estimated CAGR of over 6% annually, directly influencing the adoption of PCS fibers. Furthermore, advancements in minimally invasive surgical techniques have created new opportunities for fiber-optic applications, with sensors and illumination systems relying heavily on these specialized fibers. The compatibility of PCS fibers with UV/VIS and VIS/NIR wavelengths makes them indispensable in fluorescence imaging and spectroscopy, further solidifying their position in modern healthcare solutions.
Other Trends
Expansion of Industrial and Scientific Applications
Beyond healthcare, PCS fibers are gaining traction in industrial and scientific applications due to their durability and resistance to harsh environments. Industries such as aerospace, defense, and semiconductor manufacturing utilize these fibers for spectroscopy, sensing, and laser delivery systems. The global industrial fiber optics market is expected to surpass $9 billion by 2026, with PCS fibers capturing a significant share. Their ability to transmit high-power laser beams without degradation makes them ideal for material processing, while chemical inertness allows deployment in corrosive or high-temperature settings. Recent technological improvements in cladding materials have extended operational lifespans, reducing total cost of ownership for industrial users.
Technological Advancements in Fiber Manufacturing
Manufacturers are innovating production techniques to enhance the performance characteristics of PCS fibers. Developments in polymer cladding formulations have improved UV stability and thermal resistance, opening new application avenues in photolithography and solar simulators. The market has seen a shift toward custom-designed fibers with optimized core-to-cladding ratios for specific wavelength ranges, particularly in the 400-1100nm spectrum. Emerging vapor deposition methods now allow tighter control over refractive index profiles, enabling superior light transmission efficiency. These innovations coincide with growing investments in photonics research, where PCS fibers play a critical role in next-generation optical systems ranging from quantum computing to LiDAR technology.
COMPETITIVE LANDSCAPE
Key Industry Players
Global Fiber Optics Leaders Drive Innovation in Plastic-Clad Silica Solutions
The global plastic-clad silica fiber market demonstrates a moderately consolidated structure, featuring both multinational corporations and specialized manufacturers vying for technological leadership. LEONI Fiber Optics emerges as a dominant force, leveraging its extensive German engineering heritage and widespread distribution network across industrial markets. The company’s 2023 product expansion in high-temperature resistant fibers strengthened its position in critical applications like medical imaging systems.
Timbercon and YOFC collectively account for approximately 35-40% of the UV/VIS spectrum fiber segment, benefiting from patented coating technologies that reduce signal attenuation by up to 15% compared to industry standards. Their growth reflects increasing demand from spectroscopy applications in pharmaceutical quality control laboratories.
Asian manufacturers like Longmarch Technology are gaining market share through competitive pricing strategies, with recent capacity expansions in Shenzhen increasing production by 20% in Q2 2023. However, these cost advantages are tempered by trade barriers in North American and European markets, where regulatory compliance adds approximately 12-18% to product costs.
Strategic movements in the sector include Fibertech Optica’s 2022 acquisition of a Canadian specialty glass manufacturer, vertically integrating their supply chain for core material production. Meanwhile, New Pion focuses on niche custom solutions, recently developing a medical-grade fiber with 98.5% light transmission efficiency for minimally invasive surgical tools.
List of Key Plastic-Clad Silica Fiber Manufacturers
- LEONI Fiber Optics (Germany)
- Timbercon (U.S.)
- Longmarch Technology (China)
- Fibertech Optica (Canada)
- YOFC (China)
- New Pion (China)
Segment Analysis:
By Type
UV/VIS Segment Dominates Due to High Demand in Medical Imaging and Spectroscopy
The global plastic-clad silica fiber market is segmented based on type into:
- UV/VIS
- Applications: Used predominantly in medical diagnostics and scientific instrumentation
- VIS/NIR
- Applications: Ideal for industrial automation and optical sensing applications
By Application
Medical Segment Holds Significant Share Owing to Rising Diagnostic and Surgical Applications
The market is segmented based on application into:
- Medical
- Subcategories: Endoscopy, spectroscopy, laser surgery
- Industrial/Scientific
- Subcategories: Optical sensing, industrial automation, R&D
By End User
Healthcare Institutions Lead Adoption Driven by Technological Advancements in Medical Devices
The market is segmented based on end user into:
- Hospitals and diagnostic centers
- Research laboratories
- Industrial manufacturers
- Telecom infrastructure providers
Regional Analysis: Global Plastic-Clad Silica Fiber Market
North America
The North American market for plastic-clad silica fibers remains robust, driven by advanced medical and industrial applications. The U.S. accounts for the majority of demand, supported by high adoption rates in biomedical imaging, laser surgeries, and precision manufacturing. Strict FDA regulations ensure quality standards, fostering trust in fiber optic solutions. However, high production costs and competition from alternative materials, such as all-glass fibers, present challenges. The region’s focus on defense and aerospace applications—where lightweight, high-performance fibers are critical—further stimulates market growth. Leading players like Timbercon are capitalizing on these opportunities through continuous R&D.
Europe
Europe demonstrates steady demand, primarily fueled by industrial automation and scientific research. Countries like Germany and the UK are at the forefront, leveraging plastic-clad silica fibers for spectroscopy and semiconductor inspection tools. Environmental sustainability initiatives are pushing manufacturers toward recyclable materials, though cost remains a barrier in price-sensitive markets. The region’s well-established healthcare infrastructure also contributes to demand, particularly in diagnostic and surgical applications. However, sluggish economic growth in Southern Europe has dampened investment in high-end fiber optics, creating a disparity in adoption rates across the continent.
Asia-Pacific
Asia-Pacific is the fastest-growing market, with China, Japan, and South Korea leading the charge. Government-backed industrialization programs and thriving electronics manufacturing sectors are driving demand for UV/VIS and NIR fibers. India emerges as a notable contributor, with rising healthcare expenditure and infrastructure projects boosting adoption. While cost-effective alternatives dominate in price-sensitive markets, increasing R&D investments are shifting preferences toward high-performance fibers. Japan, in particular, stands out for its precision manufacturing needs. The region’s burgeoning telecommunications sector further amplifies opportunities.
South America
South America remains a nascent market, with growth concentrated in Brazil and Argentina. Industrial applications, such as oil and gas monitoring, fuel demand, though economic instability limits widespread adoption. Underdeveloped healthcare infrastructure stifles demand in medical sectors, despite growing awareness of fiber optic advantages. Manufacturers face hurdles like import dependencies and limited local production capabilities. Nevertheless, gradual government investments in technology-driven industries signal long-term potential, especially for cost-efficient solutions that balance performance with affordability.
Middle East & Africa
The Middle East & Africa market shows promising but uneven growth, shaped by infrastructural and economic disparities. The UAE and Saudi Arabia lead in adopting advanced fiber optics, driven by oil and gas exploration and smart city initiatives. In Africa, South Africa dominates, leveraging fibers for mining and telecommunication applications. However, low industrialization levels and inadequate funding restrict broader market penetration. The lack of stringent regulatory frameworks also delays the shift from traditional materials. Despite these challenges, increasing foreign investments in technology sectors suggest gradual market maturation.
Report Scope
This market research report provides a comprehensive analysis of the Global and regional Plastic-Clad Silica Fiber markets, covering the forecast period 2024–2030. It offers detailed insights into market dynamics, technological advancements, competitive landscape, and key trends shaping the industry.
Key focus areas of the report include:
- Market Size & Forecast: Historical data and future projections for revenue, unit shipments, and market value across major regions and segments. The Global Plastic-Clad Silica Fiber market was valued at USD 125.8 million in 2023 and is projected to reach USD 185.4 million by 2030.
- Segmentation Analysis: Detailed breakdown by product type (UV/VIS, VIS/NIR), application (Medical, Industrial/Scientific), and end-user industry to identify high-growth segments and investment opportunities.
- Regional Outlook: Insights into market performance across North America, Europe, Asia-Pacific, Latin America, and Middle East & Africa, including country-level analysis where relevant. Asia-Pacific accounted for 38% market share in 2023.
- Competitive Landscape: Profiles of leading market participants including Timbercon, LEONI Fiber Optics, Longmarch Technology, Fibertech Optica, YOFC, and New Pion, covering their product offerings, R&D focus, and recent developments.
- Technology Trends & Innovation: Assessment of emerging fiber optic technologies, integration with IoT systems, and evolving industry standards for plastic-clad silica fibers.
- Market Drivers & Restraints: Evaluation of factors driving market growth including increasing demand for high-speed data transmission (growing at 12.4% CAGR) along with challenges like raw material price volatility.
- Stakeholder Analysis: Insights for component suppliers, OEMs, system integrators, investors, and policymakers regarding the evolving fiber optic ecosystem and strategic opportunities.
Primary and secondary research methods are employed, including interviews with industry experts, data from verified sources, and real-time market intelligence to ensure the accuracy and reliability of the insights presented.
FREQUENTLY ASKED QUESTIONS:
What is the current market size of Global Plastic-Clad Silica Fiber Market?
-> The global Plastic-Clad Silica Fiber market size was valued at US$ 267.9 million in 2024 and is projected to reach US$ 423.6 million by 2032, at a CAGR of 6.9% during the forecast period 2025-2032.
Which key companies operate in Global Plastic-Clad Silica Fiber Market?
-> Key players include Timbercon, LEONI Fiber Optics, Longmarch Technology, Fibertech Optica, YOFC, and New Pion.
What are the key growth drivers?
-> Key growth drivers include rising demand in medical imaging applications (growing at 14.2% CAGR), industrial automation trends, and 5G network deployments.
Which region dominates the market?
-> Asia-Pacific currently holds the largest market share (38%), while North America shows the highest growth potential (projected 13.1% CAGR).
What are the emerging trends?
-> Emerging trends include development of specialty fibers for harsh environments, miniaturization of fiber optic components, and increasing adoption in defense applications.

Get Sample Report PDF for Exclusive Insights
Report Sample Includes
- Table of Contents
- List of Tables & Figures
- Charts, Research Methodology, and more...