SEMICONDUCTOR INSIGHT
MARKET RESEARCH REPORT

Pagers Market

2026 to 2034
MARKET INTELLIGENCE
ACROSS KEY REGIONS
2026 EDITION
COMMUNICATION SYSTEMS Semiconductor Market Research

Pagers Market

Size, Share & Industry Analysis, By Type (Beeper, Voice/Tone, Numeric, Alphanumeric, Two-way), By Application (Personal Use, Business Use), By Communication Direction (One-Way Paging, Two-Way Paging), By End User (Healthcare, Emergency & Public Safety, Care Facilities & Home Care, Industrial, Hospitality & Other Business), and Regional Forecast, 2026-2034

◷
UPDATED 16 October 2026
▤
REPORT LENGTH Detailed Report
▣
REPORT CODE dfcf3a7550db
▯
FORMATS PDF

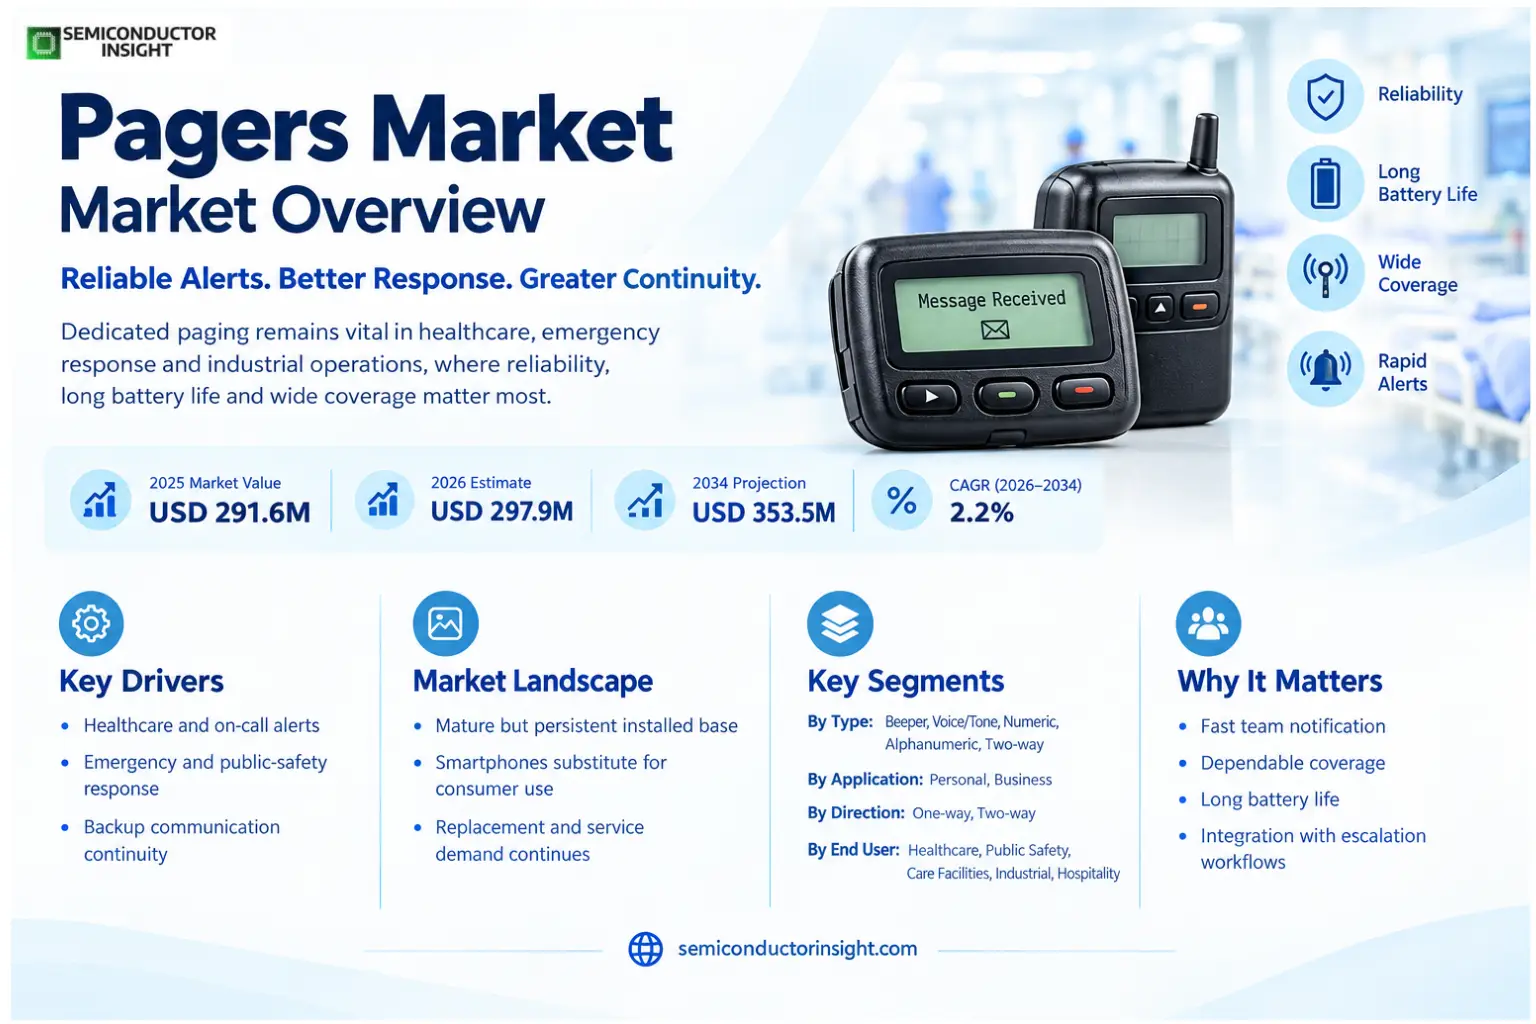
pagers market was valued at USD 291.6 million in 2025 and is estimated at USD 297.9 million in 2026. It is projected to reach USD 353.5 million by 2034, registering a CAGR of 2.2% over 2026–2034. North America held the leading regional position in 2025.

Get the sample PDF with study scope, segmentation and methodology details.

Key Statistics

2025 Market Size
USD 291.6 million
2026 Estimated Size
USD 297.9 million
2034 Projected Size
USD 353.5 million
CAGR (2026–2034)
2.2%
Largest Market in 2025
North America

Key Takeaways

  • Market trajectory: Pagers Market was valued at USD 291.6 million in 2025 and is projected to reach USD 353.5 million by 2034, representing a 2.2% CAGR over 2026–2034.
  • Largest type: Alphanumeric and two-way pagers holds the strongest commercial position because healthcare and enterprise users value richer messaging, acknowledgement and workflow integration.
  • Demand center: Business Use is the principal application segment, supported by hospitals, emergency services and operational teams require resilient alerting independent of consumer messaging apps.
  • Regional position: North America leads demand as the United States retains a substantial healthcare, emergency-response and enterprise paging installed base.
  • Growth driver: Mission-critical users continue to value broad coverage, low device complexity and resilient alert delivery.
  • Primary restraint: Smartphones and secure mobile messaging continue to replace paging in non-critical workflows.

Pagers Market Overview

Pagers market was valued at USD 291.6 million in 2025 and is estimated at USD 297.9 million in 2026. It is projected to reach USD 353.5 million by 2034, registering a CAGR of 2.2% over 2026–2034. North America held the leading regional position in 2025.

Base year: 2025 · Estimated year: 2026 · Forecast period: 2026–2034 · Values in USD million unless stated otherwise

Pagers are dedicated wireless alerting devices designed to receive short messages over paging networks, with selected two-way models able to acknowledge or transmit responses. Their commercial relevance is now concentrated in environments where reliability, simple operation, long battery life and broadcast coverage matter more than rich mobile applications. Healthcare, emergency response, care facilities and industrial operations therefore form the core addressable base.

The market is mature rather than obsolete. Consumer use has largely migrated to smartphones, but paging remains embedded in hospitals and other facilities that need rapid group notification and backup communication during local network congestion or application outages. Modern offerings increasingly combine legacy radio paging with encrypted messaging gateways, virtual pager software and integration into clinical or enterprise communication systems.

Growth is restrained by substitution, yet the remaining installed base has high operational persistence. Organizations that depend on paging often have workflows, coverage maps, device fleets and escalation procedures built around the technology. Replacement purchasing therefore continues even as new deployments become more selective, creating a stable service-and-device market with modest long-term expansion.

Segment Analysis: By Type

By type, the market is segmented into Beeper, Voice/Tone, Numeric, Alphanumeric and Two-way pagers. Basic beep and numeric devices serve simple alerting, while alphanumeric and two-way products hold greater value in professional workflows because they can carry actionable text and, in two-way systems, confirm receipt.

Type Technical role Market position
Beeper Simple alert signal Low-cost legacy use where the alert itself triggers a known response.
Voice/Tone Tone or voice notification Useful in dispatch and facility workflows requiring immediate audible information.
Numeric Displays phone numbers or numeric codes Retains use in straightforward callback and code-based alerting.
Alphanumeric Displays text messages Higher workflow value because alerts can include location, priority and action detail.
Two-way Receives and acknowledges messages Supports closed-loop communication where confirmation improves escalation control.

Why professional paging remains differentiated

Dedicated pagers avoid many distractions and software dependencies associated with general-purpose smartphones. Their value is strongest when an organization can operate a coverage network, gateway and escalation process as one managed service. This makes lifecycle support, network reliability and integration capability more important than handset hardware specifications alone.

Segment Analysis: By Application

By application, the market is segmented into Personal Use and Business Use. Business use represents the durable commercial base because hospitals, care facilities, emergency teams and selected industrial users retain dedicated alerting for operational continuity and rapid escalation.

Application Demand characteristics
Personal Use A small legacy segment, now largely displaced by smartphones except for specialized caregiver and accessibility use cases.
Business Use Leading application. Healthcare, emergency response, hospitality and industrial operations use paging for rapid team notification and backup communication.

Segment Analysis: By Communication Direction

Communication direction separates One-Way Paging and Two-Way Paging. One-way systems remain attractive for simple broadcast alerts, while two-way devices improve accountability by allowing users to acknowledge messages and close the loop in escalation workflows.

Communication Direction Commercial relevance
One-Way Paging Efficient broadcast architecture for alerts where acknowledgement is not mandatory.
Two-Way Paging Adds response or receipt confirmation, improving workflow visibility in mission-critical operations.

Segment Analysis: By End User

End-user demand is concentrated in Healthcare, Emergency & Public Safety, Care Facilities & Home Care, Industrial, and Hospitality & Other Business. Healthcare remains strategically important because paging systems are embedded in clinical escalation and on-call workflows, while caregiver products serve a distinct small-facility segment.

End User Commercial relevance
Healthcare Clinical alerts, on-call escalation and backup communication support persistent device and service demand.
Emergency & Public Safety Broadcast reach and simple devices support dispatch and incident notification.
Care Facilities & Home Care Staff and caregiver pagers provide direct alerts without requiring a smartphone application.
Industrial Used for maintenance, alarm and team notifications in selected facilities.
Hospitality & Other Business Niche use for staff coordination, guest notification and operations.

Pagers Market Size & Shape

Regional Analysis

North America leads the Pagers Market, with regional demand shaped by different combinations of manufacturing concentration, installed-base replacement, regulatory requirements and customer qualification. The market is therefore not a uniform global pool: supplier access depends on local production ecosystems, channel depth, technical support and the purchasing model used by major customers.

How does regional demand differ across the pagers market?

North America has the deepest commercial installed base, led by healthcare and emergency communications in the United States. Europe is more actively migrating routine workflows to secure smartphone-based platforms, although paging remains in selected critical and backup functions. Asia Pacific demand is more fragmented, while South America and Middle East & Africa are primarily niche, project-based or caregiver-oriented markets.

Region Position Growth outlook Demand profile What decides supplier selection
Asia Pacific Established niche High Manufacturing and new-capacity led Scale, qualification, local support
North America Largest Moderate to high Technology and replacement led Performance, support, compliance
Europe Second tier Moderate Compliance and specialty led Compliance, sustainability, engineering
South America Smaller Selective Import and distributor led Landed cost, availability, service
Middle East & Africa Smaller Selective to high Project and infrastructure led Reliability, integrator support, delivery
Asia Pacific HIGH GROWTH

What defines the Asia Pacific market?

Asia Pacific demand is shaped by dense electronics and semiconductor manufacturing ecosystems. Paging demand persists where organizations require direct alerting and resilient communications outside ordinary consumer-app workflows. Regional suppliers benefit from proximity to high-volume customers, while global vendors compete through technology, reliability and local engineering support.

Market positionEstablished niche
Growth outlookHigh
Demand profileManufacturing and new-capacity led
Market access gateCustomer qualification
Country / market Position in region What drives demand
China Major market Large electronics and semiconductor manufacturing base supports sustained purchasing and local supplier development.
Japan / Korea / Taiwan Technology-intensive Advanced manufacturing clusters emphasize quality, process control and long supplier qualification cycles.

Capacity additions and supply-chain localization reinforce Asia Pacific demand, but commercial access depends on demonstrated process capability rather than price alone.

North America LARGEST

What defines the North America market?

North America is characterized by technology-intensive customers, established installed bases and demanding qualification standards. Paging demand persists where organizations require direct alerting and resilient communications outside ordinary consumer-app workflows. Buyers tend to prioritize validated performance, security of supply and field support over lowest initial price.

Market positionLargest
Growth outlookModerate to high
Demand profileTechnology and replacement led
Market access gateVendor qualification
Country / market Position in region What drives demand
United States Largest in region Data-center, electronics, semiconductor and healthcare demand creates a broad installed base with stringent technical purchasing requirements.
Canada Smaller but established Demand is concentrated in enterprise, communications and specialized manufacturing applications.

Regional growth is supported by modernization and strategic manufacturing investment, although mature end markets create a larger replacement component than in Asia Pacific.

Europe COMPLIANCE LED

What defines the Europe market?

Europe combines advanced industrial demand with rigorous environmental, product-safety and supply-chain requirements. Paging demand persists where organizations require direct alerting and resilient communications outside ordinary consumer-app workflows. Suppliers that document traceability, energy efficiency and long-term support are better positioned in regulated and premium applications.

Market positionSecond tier
Growth outlookModerate
Demand profileCompliance and specialty led
Market access gateCE and customer standards
Country / market Position in region What drives demand
Germany Industrial anchor Advanced manufacturing and electronics engineering support specification-led demand.
France / Netherlands Specialty markets Semiconductor, communications and enterprise infrastructure create selective demand for higher-value solutions.

European demand is less dependent on pure volume expansion and more on upgrades, efficiency, regulatory compliance and resilience of critical supply chains.

South America EMERGING

What defines the South America market?

South America is a smaller market where distributor inventory, import economics and technical service strongly influence purchasing. Paging demand persists where organizations require direct alerting and resilient communications outside ordinary consumer-app workflows. Brazil is the primary demand center, while other countries rely more heavily on imported equipment and components.

Market positionSmaller
Growth outlookSelective
Demand profileImport and distributor led
Market access gateLocal import requirements
Country / market Position in region What drives demand
Brazil Largest in region Electronics assembly, data infrastructure and industrial investment create the broadest addressable base in the region.
Mexico / Southern Cone Selective demand Purchasing is concentrated in multinational manufacturing networks and enterprise infrastructure.

Growth opportunities are strongest where suppliers can shorten lead times, support regional system integrators and maintain consistent spare-part or component availability.

Middle East & Africa PROJECT LED

What defines the Middle East & Africa market?

Middle East & Africa demand is concentrated in infrastructure programs, data centers, telecom networks and selected electronics or semiconductor investments. Paging demand persists where organizations require direct alerting and resilient communications outside ordinary consumer-app workflows. Project timing produces uneven order patterns, making channel coverage and delivery reliability commercially important.

Market positionSmaller
Growth outlookSelective to high
Demand profileProject and infrastructure led
Market access gateProject approvals
Country / market Position in region What drives demand
GCC Investment-led Data-center, digital infrastructure and industrial diversification projects create concentrated demand for advanced systems.
South Africa Established base Enterprise, telecom and industrial users provide the most developed demand base in Sub-Saharan Africa.

Suppliers typically compete through project qualification, integrator relationships and service reach rather than large continuous production volumes.

Key Pagers Market Manufacturers and Competitive Landscape

Competition is concentrated among specialist paging-service providers, device vendors and caregiver-alert suppliers rather than broad consumer-electronics brands. Success depends on installed-network access, recurring service relationships, device compatibility, facility integration and the ability to support long-lived operational workflows.

The market has a strong service component. Customers often buy coverage, gateways, management tools and support together with devices, which increases retention once a system is integrated into clinical or operational processes. Device replacement cycles can therefore generate recurring revenue even without rapid growth in the number of users.

Healthcare-oriented vendors increasingly position paging as one channel within a broader critical-communications platform. This allows customers to preserve radio paging for resilience while routing the same alerts to smartphones, consoles and other endpoints. The competitive advantage shifts from standalone hardware toward interoperability and workflow orchestration.

Caregiver and small-facility suppliers compete differently, emphasizing ease of installation, range, low training requirements and affordable device bundles. These products serve localized use cases and typically rely less on wide-area paging infrastructure.

Tier structure

Competitive tier Representative companies Basis of competition
Healthcare communication specialists Spok and regional paging operators Wide-area service, clinical integration, network reliability and recurring support.
Dedicated pager suppliers Daviscomms; BO IRBlue; InnoGear Device portfolio, compatibility and specialized professional use cases.
Caregiver alert vendors Smart Caregiver; Secure; Daytech; NADAMOO Simple local alerting, facility bundles and ease of deployment.

Companies profiled: Smart Caregiver, InnoGear, Secure, Daytech, Daviscomms, NADAMOO, BO IRBlue.

Pagers Market Production Capacity Analysis

Pager production is less capacity-intensive than advanced semiconductor or PCB manufacturing because devices use mature radio, display, battery and enclosure technologies. Commercial capacity is therefore shaped more by component sourcing, certification, firmware support and network compatibility than by dedicated high-complexity factories.

Wide-area service capacity is a more meaningful constraint than handset assembly. Operators must maintain transmitter networks, frequency licenses, monitoring and redundancy, while enterprise customers require dependable gateway and dispatch infrastructure. A device supplier without compatible service coverage has limited value in wide-area professional applications.

For local caregiver systems, supply is more conventional: radio modules, receiver boards, plastics and accessories can be sourced through established electronics manufacturing channels. Differentiation comes from usability, range, battery life and dependable support rather than scarce manufacturing capacity.

Pagers Market Market Dynamics: Drivers, Restraints and Opportunities

The market balances two opposing forces. Smartphone-based secure messaging is replacing paging in routine communications, but mission-critical users continue to preserve dedicated radio alerting where broad coverage, rapid group notification and independence from local Wi-Fi or app infrastructure provide operational value. This creates a slow-growth market with resilient pockets rather than broad consumer expansion.

MARKET DRIVERS

Drivers Impact Analysis*

Driver Impact Commercial mechanism
Mission-critical reliability High Supports retention in healthcare and emergency workflows.
Installed workflow persistence Medium Replacement demand continues where paging is embedded in escalation procedures.
Hybrid communication platforms Medium Extends pager relevance as one endpoint within multi-channel systems.

Healthcare workflows preserve dedicated alerting

Hospitals often require rapid escalation across clinical teams and may retain pagers as a resilient channel even while adding secure mobile applications. The value comes from dependable alert delivery and simple user interaction during high-pressure workflows, not from feature breadth.

Long battery life and simple operation remain useful

Dedicated pagers can operate for extended periods with minimal user management. In shift-based environments this reduces charging, login and application-maintenance requirements, making the device suitable for staff who need to receive alerts immediately without navigating a general-purpose handset.

Hybrid platforms reduce migration risk

Communication platforms can route messages across pagers, smartphones and desktop systems. This allows organizations to modernize gradually while preserving existing paging coverage for backup or selected roles, extending the economic life of network and device investments.

MARKET RESTRAINTS

Restraints Impact Analysis*

Restraint Impact Commercial mechanism
Smartphone substitution High Secure mobile applications replace paging in many routine workflows.
Aging network infrastructure Medium Legacy transmitters and specialized maintenance can raise service costs.
Limited consumer demand High Personal paging has largely disappeared outside special use cases.

Secure mobile messaging expands

Modern enterprise communication platforms provide rich text, images, presence and workflow integration on smartphones. Where cellular and Wi-Fi coverage are reliable, these capabilities make paging less attractive for new deployments and shift purchasing toward software-centric platforms.

Legacy infrastructure requires continuing support

Wide-area paging depends on dedicated transmitters, frequency management and specialized operational expertise. As the user base narrows, maintaining geographic coverage can become more expensive on a per-user basis, encouraging consolidation among service providers.

Procurement increasingly favors unified devices

Organizations may prefer one managed smartphone for voice, messaging, clinical applications and authentication rather than maintaining a separate pager fleet. This pressure is strongest where device-management and cybersecurity systems already support enterprise mobile endpoints.

MARKET OPPORTUNITIES

Healthcare resilience and downtime planning

Pagers can remain a backup path for clinical alerts when local Wi-Fi, application servers or smartphone management systems are disrupted. Vendors that integrate paging into broader incident-response architectures can protect recurring service revenue.

Encrypted and virtual paging

Encryption and software-based pager endpoints allow legacy networks to participate in modern security and workflow environments. This can extend paging into organizations that require auditability and centralized message routing.

Caregiver and small-facility alerting

Simple local pagers remain useful in care homes and smaller facilities where a full nurse-call or enterprise mobile platform is not economical. Bundled systems can compete on ease of installation and straightforward operation.

Integration with multi-channel communication

The strongest opportunity is not a return to mass-market paging but coexistence. Platforms that deliver the same critical event to pagers, smartphones and consoles can let customers choose the endpoint appropriate to each role and risk level.

Pagers Market Supply Chain Analysis

Stage 1: Components
Mature RF modules, displays, batteries, enclosures and control electronics.
Stage 2: Device assembly
Pager hardware, firmware, testing and certification.
Stage 3: Network / gateway
Transmitters, licensed spectrum, messaging gateways and management software.
Stage 4: End user workflow
Clinical, emergency, caregiver and enterprise escalation processes.

Most hardware components are mature and broadly available, so supply-chain value shifts toward network operations and system integration. Wide-area providers need reliable transmitter infrastructure and message-routing systems, while enterprise buyers care about how alerts connect to existing dispatch, clinical or incident-management tools.

A key bottleneck is organizational rather than physical: replacing paging requires workflow redesign, coverage testing, staff training and contingency planning. This can slow substitution even when smartphone software appears technically superior, supporting a continuing replacement market for established pager fleets.

Recent Developments in the Pagers Market

2025 — Healthcare communication vendors continued supporting paging as part of multi-channel systems

Spok continues to offer encrypted and virtual paging services alongside broader clinical communication solutions, illustrating how paging is being retained as one endpoint in integrated healthcare workflows. Source.

2019 onward — UK policy accelerated migration from routine NHS pager use

The UK government directed NHS trusts to phase out pagers for non-emergency communications while preserving selected use for emergency teams and situations where alternative systems may fail. Source.

Current — Caregiver suppliers maintain localized pager systems

Smart Caregiver continues to market small-facility pager products, showing continued demand for straightforward local alerting in care settings outside wide-area networks. Source.

REPORT SCOPE & SEGMENTATION

Attribute Coverage
Market Pagers Market
Base Year 2025
Estimated Year 2026
Forecast Period 2026–2034
By Type Beeper, Voice/Tone, Numeric, Alphanumeric, Two-way
By Application Personal Use, Business Use
By Communication Direction One-Way Paging, Two-Way Paging
By End User Healthcare, Emergency & Public Safety, Care Facilities & Home Care, Industrial, Hospitality & Other Business
Regions North America, Europe, Asia Pacific, South America, Middle East & Africa
Companies Profiled Smart Caregiver, InnoGear, Secure, Daytech, Daviscomms, NADAMOO, BO IRBlue

Frequently Asked Questions

What is the size of the Pagers Market?

The market was valued at USD 291.6 million in 2025 and is projected to reach USD 353.5 million by 2034, with a CAGR of 2.2% during 2026–2034.

Which region leads the market?

North America is the largest regional market, supported by the United States retains a substantial healthcare, emergency-response and enterprise paging installed base.

Which type leads the pagers market?

Alphanumeric and two-way pagers holds the leading position because healthcare and enterprise users value richer messaging, acknowledgement and workflow integration.

Which application is the largest?

Business Use is the principal application segment, driven by hospitals, emergency services and operational teams require resilient alerting independent of consumer messaging apps.

What are the main growth drivers?

Mission-critical reliability, installed workflows and multi-channel communication platforms sustain replacement and service demand in healthcare and emergency operations.

What are the main restraints?

Smartphone substitution, aging network infrastructure and the decline of personal paging limit broad market expansion.

What additional segmentation is covered?

The analysis also covers Communication Direction and End User, enabling comparison beyond type and application.

How is competition structured?

The market is led by specialist service and device vendors; network coverage, integration and recurring support matter more than consumer-brand scale.

What is changing in the supply chain?

Hardware components are mature, while the more strategic layers are paging network operation, message gateways and integration with end-user workflows.

Which companies are profiled?

Smart Caregiver, InnoGear, Secure, Daytech, Daviscomms, NADAMOO, BO IRBlue.

Research Sources & Evidence Base

View supporting primary and industry sources
  1. UK Government: Health and Social Care Secretary bans pagers from the NHS — policy evidence on migration from routine pager use and retained emergency exceptions.
  2. Spok: Paging Services — healthcare paging service, encryption and virtual paging capabilities.
  3. FCC: Commercial Mobile Radio Service and paging regulatory document — regulatory context for paging and messaging services.
  4. Smart Caregiver: Small Facility Pager — current caregiver and facility paging application.

Pagers Market Size, Share & Industry Analysis, By Type (Beeper, Voice/Tone, Numeric, Alphanumeric, Two-way), By Application (Personal Use, Business Use), By Communication Direction (One-Way Paging, Two-Way Paging), By End User (Healthcare, Emergency & Public Safety, Care Facilities & Home Care, Industrial, Hospitality & Other Business), and Regional Forecast, 2026-2034

Get Sample Report PDF for Exclusive Insights

Report Sample Includes

  • Table of Contents
  • List of Tables & Figures
  • Charts, Research Methodology, and more...

PDF Icon Download Sample Report PDF

Download Sample Report

Table of Content

Table of Contents
1 Research Methodology and Statistical Scope
1.1 Market Definition and Statistical Scope of Pagers
1.2 Key Market Segments
1.2.1 Pagers Segment by Type
1.2.2 Pagers Segment by Application
1.3 Methodology & Sources of Information
1.3.1 Research Methodology
1.3.2 Research Process
1.3.3 Market Breakdown and Data Triangulation
1.3.4 Base Year
1.3.5 Report Assumptions & Caveats
2 Pagers Market Overview
2.1 Global Market Overview
2.1.1 Global Pagers Market Size (M USD) Estimates and Forecasts (2026-2034)
2.1.2 Global Pagers Sales Estimates and Forecasts (2026-2034)
2.2 Market Segment Executive Summary
2.3 Global Market Size by Region
3 Pagers Market Competitive Landscape
3.1 Global Pagers Sales by Manufacturers (2019-2024)
3.2 Global Pagers Revenue Market Share by Manufacturers (2019-2024)
3.3 Pagers Market Share by Company Type (Tier 1, Tier 2, and Tier 3)
3.4 Global Pagers Average Price by Manufacturers (2019-2024)
3.5 Manufacturers Pagers Sales Sites, Area Served, Product Type
3.6 Pagers Market Competitive Situation and Trends
3.6.1 Pagers Market Concentration Rate
3.6.2 Global 5 and 10 Largest Pagers Players Market Share by Revenue
3.6.3 Mergers & Acquisitions, Expansion
4 Pagers Industry Chain Analysis
4.1 Pagers Industry Chain Analysis
4.2 Market Overview of Key Raw Materials
4.3 Midstream Market Analysis
4.4 Downstream Customer Analysis
5 The Development and Dynamics of Pagers Market
5.1 Key Development Trends
5.2 Driving Factors
5.3 Market Challenges
5.4 Market Restraints
5.5 Industry News
5.5.1 New Product Developments
5.5.2 Mergers & Acquisitions
5.5.3 Expansions
5.5.4 Collaboration/Supply Contracts
5.6 Industry Policies
6 Pagers Market Segmentation by Type
6.1 Evaluation Matrix of Segment Market Development Potential (Type)
6.2 Global Pagers Sales Market Share by Type (2019-2024)
6.3 Global Pagers Market Size Market Share by Type (2019-2024)
6.4 Global Pagers Price by Type (2019-2024)
7 Pagers Market Segmentation by Application
7.1 Evaluation Matrix of Segment Market Development Potential (Application)
7.2 Global Pagers Market Sales by Application (2019-2024)
7.3 Global Pagers Market Size (M USD) by Application (2019-2024)
7.4 Global Pagers Sales Growth Rate by Application (2019-2024)
8 Pagers Market Segmentation by Region
8.1 Global Pagers Sales by Region
8.1.1 Global Pagers Sales by Region
8.1.2 Global Pagers Sales Market Share by Region
8.2 North America
8.2.1 North America Pagers Sales by Country
8.2.2 U.S.
8.2.3 Canada
8.2.4 Mexico
8.3 Europe
8.3.1 Europe Pagers Sales by Country
8.3.2 Germany
8.3.3 France
8.3.4 U.K.
8.3.5 Italy
8.3.6 Russia
8.4 Asia Pacific
8.4.1 Asia Pacific Pagers Sales by Region
8.4.2 China
8.4.3 Japan
8.4.4 South Korea
8.4.5 India
8.4.6 Southeast Asia
8.5 South America
8.5.1 South America Pagers Sales by Country
8.5.2 Brazil
8.5.3 Argentina
8.5.4 Columbia
8.6 Middle East and Africa
8.6.1 Middle East and Africa Pagers Sales by Region
8.6.2 Saudi Arabia
8.6.3 UAE
8.6.4 Egypt
8.6.5 Nigeria
8.6.6 South Africa
9 Key Companies Profile
9.1 Smart Caregiver
9.1.1 Smart Caregiver Pagers Basic Information
9.1.2 Smart Caregiver Pagers Product Overview
9.1.3 Smart Caregiver Pagers Product Market Performance
9.1.4 Smart Caregiver Business Overview
9.1.5 Smart Caregiver Pagers SWOT Analysis
9.1.6 Smart Caregiver Recent Developments
9.2 InnoGear
9.2.1 InnoGear Pagers Basic Information
9.2.2 InnoGear Pagers Product Overview
9.2.3 InnoGear Pagers Product Market Performance
9.2.4 InnoGear Business Overview
9.2.5 InnoGear Pagers SWOT Analysis
9.2.6 InnoGear Recent Developments
9.3 Secure
9.3.1 Secure Pagers Basic Information
9.3.2 Secure Pagers Product Overview
9.3.3 Secure Pagers Product Market Performance
9.3.4 Secure Pagers SWOT Analysis
9.3.5 Secure Business Overview
9.3.6 Secure Recent Developments
9.4 Daytech
9.4.1 Daytech Pagers Basic Information
9.4.2 Daytech Pagers Product Overview
9.4.3 Daytech Pagers Product Market Performance
9.4.4 Daytech Business Overview
9.4.5 Daytech Recent Developments
9.5 Daviscomms
9.5.1 Daviscomms Pagers Basic Information
9.5.2 Daviscomms Pagers Product Overview
9.5.3 Daviscomms Pagers Product Market Performance
9.5.4 Daviscomms Business Overview
9.5.5 Daviscomms Recent Developments
9.6 NADAMOO
9.6.1 NADAMOO Pagers Basic Information
9.6.2 NADAMOO Pagers Product Overview
9.6.3 NADAMOO Pagers Product Market Performance
9.6.4 NADAMOO Business Overview
9.6.5 NADAMOO Recent Developments
9.7 BO IRBlue
9.7.1 BO IRBlue Pagers Basic Information
9.7.2 BO IRBlue Pagers Product Overview
9.7.3 BO IRBlue Pagers Product Market Performance
9.7.4 BO IRBlue Business Overview
9.7.5 BO IRBlue Recent Developments
10 Pagers Market Forecast by Region
10.1 Global Pagers Market Size Forecast
10.2 Global Pagers Market Forecast by Region
10.2.1 North America Market Size Forecast by Country
10.2.2 Europe Pagers Market Size Forecast by Country
10.2.3 Asia Pacific Pagers Market Size Forecast by Region
10.2.4 South America Pagers Market Size Forecast by Country
10.2.5 Middle East and Africa Forecasted Consumption of Pagers by Country
11 Forecast Market by Type and by Application (2025-2030)
11.1 Global Pagers Market Forecast by Type (2025-2030)
11.1.1 Global Forecasted Sales of Pagers by Type (2025-2030)
11.1.2 Global Pagers Market Size Forecast by Type (2025-2030)
11.1.3 Global Forecasted Price of Pagers by Type (2025-2030)
11.2 Global Pagers Market Forecast by Application (2025-2030)
11.2.1 Global Pagers Sales (K Units) Forecast by Application
11.2.2 Global Pagers Market Size (M USD) Forecast by Application (2025-2030)
12 Conclusion and Key FindingsList of Tables
Table 1. Introduction of the Type
Table 2. Introduction of the Application
Table 3. Market Size (M USD) Segment Executive Summary
Table 4. Pagers Market Size Comparison by Region (M USD)
Table 5. Global Pagers Sales (K Units) by Manufacturers (2019-2024)
Table 6. Global Pagers Sales Market Share by Manufacturers (2019-2024)
Table 7. Global Pagers Revenue (M USD) by Manufacturers (2019-2024)
Table 8. Global Pagers Revenue Share by Manufacturers (2019-2024)
Table 9. Company Type (Tier 1, Tier 2, and Tier 3) & (based on the Revenue in Pagers as of 2022)
Table 10. Global Market Pagers Average Price (USD/Unit) of Key Manufacturers (2019-2024)
Table 11. Manufacturers Pagers Sales Sites and Area Served
Table 12. Manufacturers Pagers Product Type
Table 13. Global Pagers Manufacturers Market Concentration Ratio (CR5 and HHI)
Table 14. Mergers & Acquisitions, Expansion Plans
Table 15. Industry Chain Map of Pagers
Table 16. Market Overview of Key Raw Materials
Table 17. Midstream Market Analysis
Table 18. Downstream Customer Analysis
Table 19. Key Development Trends
Table 20. Driving Factors
Table 21. Pagers Market Challenges
Table 22. Global Pagers Sales by Type (K Units)
Table 23. Global Pagers Market Size by Type (M USD)
Table 24. Global Pagers Sales (K Units) by Type (2019-2024)
Table 25. Global Pagers Sales Market Share by Type (2019-2024)
Table 26. Global Pagers Market Size (M USD) by Type (2019-2024)
Table 27. Global Pagers Market Size Share by Type (2019-2024)
Table 28. Global Pagers Price (USD/Unit) by Type (2019-2024)
Table 29. Global Pagers Sales (K Units) by Application
Table 30. Global Pagers Market Size by Application
Table 31. Global Pagers Sales by Application (2019-2024) & (K Units)
Table 32. Global Pagers Sales Market Share by Application (2019-2024)
Table 33. Global Pagers Sales by Application (2019-2024) & (M USD)
Table 34. Global Pagers Market Share by Application (2019-2024)
Table 35. Global Pagers Sales Growth Rate by Application (2019-2024)
Table 36. Global Pagers Sales by Region (2019-2024) & (K Units)
Table 37. Global Pagers Sales Market Share by Region (2019-2024)
Table 38. North America Pagers Sales by Country (2019-2024) & (K Units)
Table 39. Europe Pagers Sales by Country (2019-2024) & (K Units)
Table 40. Asia Pacific Pagers Sales by Region (2019-2024) & (K Units)
Table 41. South America Pagers Sales by Country (2019-2024) & (K Units)
Table 42. Middle East and Africa Pagers Sales by Region (2019-2024) & (K Units)
Table 43. Smart Caregiver Pagers Basic Information
Table 44. Smart Caregiver Pagers Product Overview
Table 45. Smart Caregiver Pagers Sales (K Units), Revenue (M USD), Price (USD/Unit) and Gross Margin (2019-2024)
Table 46. Smart Caregiver Business Overview
Table 47. Smart Caregiver Pagers SWOT Analysis
Table 48. Smart Caregiver Recent Developments
Table 49. InnoGear Pagers Basic Information
Table 50. InnoGear Pagers Product Overview
Table 51. InnoGear Pagers Sales (K Units), Revenue (M USD), Price (USD/Unit) and Gross Margin (2019-2024)
Table 52. InnoGear Business Overview
Table 53. InnoGear Pagers SWOT Analysis
Table 54. InnoGear Recent Developments
Table 55. Secure Pagers Basic Information
Table 56. Secure Pagers Product Overview
Table 57. Secure Pagers Sales (K Units), Revenue (M USD), Price (USD/Unit) and Gross Margin (2019-2024)
Table 58. Secure Pagers SWOT Analysis
Table 59. Secure Business Overview
Table 60. Secure Recent Developments
Table 61. Daytech Pagers Basic Information
Table 62. Daytech Pagers Product Overview
Table 63. Daytech Pagers Sales (K Units), Revenue (M USD), Price (USD/Unit) and Gross Margin (2019-2024)
Table 64. Daytech Business Overview
Table 65. Daytech Recent Developments
Table 66. Daviscomms Pagers Basic Information
Table 67. Daviscomms Pagers Product Overview
Table 68. Daviscomms Pagers Sales (K Units), Revenue (M USD), Price (USD/Unit) and Gross Margin (2019-2024)
Table 69. Daviscomms Business Overview
Table 70. Daviscomms Recent Developments
Table 71. NADAMOO Pagers Basic Information
Table 72. NADAMOO Pagers Product Overview
Table 73. NADAMOO Pagers Sales (K Units), Revenue (M USD), Price (USD/Unit) and Gross Margin (2019-2024)
Table 74. NADAMOO Business Overview
Table 75. NADAMOO Recent Developments
Table 76. BO IRBlue Pagers Basic Information
Table 77. BO IRBlue Pagers Product Overview
Table 78. BO IRBlue Pagers Sales (K Units), Revenue (M USD), Price (USD/Unit) and Gross Margin (2019-2024)
Table 79. BO IRBlue Business Overview
Table 80. BO IRBlue Recent Developments
Table 81. Global Pagers Sales Forecast by Region (2025-2030) & (K Units)
Table 82. Global Pagers Market Size Forecast by Region (2025-2030) & (M USD)
Table 83. North America Pagers Sales Forecast by Country (2025-2030) & (K Units)
Table 84. North America Pagers Market Size Forecast by Country (2025-2030) & (M USD)
Table 85. Europe Pagers Sales Forecast by Country (2025-2030) & (K Units)
Table 86. Europe Pagers Market Size Forecast by Country (2025-2030) & (M USD)
Table 87. Asia Pacific Pagers Sales Forecast by Region (2025-2030) & (K Units)
Table 88. Asia Pacific Pagers Market Size Forecast by Region (2025-2030) & (M USD)
Table 89. South America Pagers Sales Forecast by Country (2025-2030) & (K Units)
Table 90. South America Pagers Market Size Forecast by Country (2025-2030) & (M USD)
Table 91. Middle East and Africa Pagers Consumption Forecast by Country (2025-2030) & (Units)
Table 92. Middle East and Africa Pagers Market Size Forecast by Country (2025-2030) & (M USD)
Table 93. Global Pagers Sales Forecast by Type (2025-2030) & (K Units)
Table 94. Global Pagers Market Size Forecast by Type (2025-2030) & (M USD)
Table 95. Global Pagers Price Forecast by Type (2025-2030) & (USD/Unit)
Table 96. Global Pagers Sales (K Units) Forecast by Application (2025-2030)
Table 97. Global Pagers Market Size Forecast by Application (2025-2030) & (M USD)
List of Figures
Figure 1. Product Picture of Pagers
Figure 2. Data Triangulation
Figure 3. Key Caveats
Figure 4. Global Pagers Market Size (M USD), 2026-2034
Figure 5. Global Pagers Market Size (M USD) (2026-2034)
Figure 6. Global Pagers Sales (K Units) & (2026-2034)
Figure 7. Evaluation Matrix of Segment Market Development Potential (Type)
Figure 8. Evaluation Matrix of Segment Market Development Potential (Application)
Figure 9. Evaluation Matrix of Regional Market Development Potential
Figure 10. Pagers Market Size by Country (M USD)
Figure 11. Pagers Sales Share by Manufacturers in 2023
Figure 12. Global Pagers Revenue Share by Manufacturers in 2023
Figure 13. Pagers Market Share by Company Type (Tier 1, Tier 2 and Tier 3): 2023
Figure 14. Global Market Pagers Average Price (USD/Unit) of Key Manufacturers in 2023
Figure 15. The Global 5 and 10 Largest Players: Market Share by Pagers Revenue in 2023
Figure 16. Evaluation Matrix of Segment Market Development Potential (Type)
Figure 17. Global Pagers Market Share by Type
Figure 18. Sales Market Share of Pagers by Type (2019-2024)
Figure 19. Sales Market Share of Pagers by Type in 2023
Figure 20. Market Size Share of Pagers by Type (2019-2024)
Figure 21. Market Size Market Share of Pagers by Type in 2023
Figure 22. Evaluation Matrix of Segment Market Development Potential (Application)
Figure 23. Global Pagers Market Share by Application
Figure 24. Global Pagers Sales Market Share by Application (2019-2024)
Figure 25. Global Pagers Sales Market Share by Application in 2023
Figure 26. Global Pagers Market Share by Application (2019-2024)
Figure 27. Global Pagers Market Share by Application in 2023
Figure 28. Global Pagers Sales Growth Rate by Application (2019-2024)
Figure 29. Global Pagers Sales Market Share by Region (2019-2024)
Figure 30. North America Pagers Sales and Growth Rate (2019-2024) & (K Units)
Figure 31. North America Pagers Sales Market Share by Country in 2023
Figure 32. U.S. Pagers Sales and Growth Rate (2019-2024) & (K Units)
Figure 33. Canada Pagers Sales (K Units) and Growth Rate (2019-2024)
Figure 34. Mexico Pagers Sales (Units) and Growth Rate (2019-2024)
Figure 35. Europe Pagers Sales and Growth Rate (2019-2024) & (K Units)
Figure 36. Europe Pagers Sales Market Share by Country in 2023
Figure 37. Germany Pagers Sales and Growth Rate (2019-2024) & (K Units)
Figure 38. France Pagers Sales and Growth Rate (2019-2024) & (K Units)
Figure 39. U.K. Pagers Sales and Growth Rate (2019-2024) & (K Units)
Figure 40. Italy Pagers Sales and Growth Rate (2019-2024) & (K Units)
Figure 41. Russia Pagers Sales and Growth Rate (2019-2024) & (K Units)
Figure 42. Asia Pacific Pagers Sales and Growth Rate (K Units)
Figure 43. Asia Pacific Pagers Sales Market Share by Region in 2023
Figure 44. China Pagers Sales and Growth Rate (2019-2024) & (K Units)
Figure 45. Japan Pagers Sales and Growth Rate (2019-2024) & (K Units)
Figure 46. South Korea Pagers Sales and Growth Rate (2019-2024) & (K Units)
Figure 47. India Pagers Sales and Growth Rate (2019-2024) & (K Units)
Figure 48. Southeast Asia Pagers Sales and Growth Rate (2019-2024) & (K Units)
Figure 49. South America Pagers Sales and Growth Rate (K Units)
Figure 50. South America Pagers Sales Market Share by Country in 2023
Figure 51. Brazil Pagers Sales and Growth Rate (2019-2024) & (K Units)
Figure 52. Argentina Pagers Sales and Growth Rate (2019-2024) & (K Units)
Figure 53. Columbia Pagers Sales and Growth Rate (2019-2024) & (K Units)
Figure 54. Middle East and Africa Pagers Sales and Growth Rate (K Units)
Figure 55. Middle East and Africa Pagers Sales Market Share by Region in 2023
Figure 56. Saudi Arabia Pagers Sales and Growth Rate (2019-2024) & (K Units)
Figure 57. UAE Pagers Sales and Growth Rate (2019-2024) & (K Units)
Figure 58. Egypt Pagers Sales and Growth Rate (2019-2024) & (K Units)
Figure 59. Nigeria Pagers Sales and Growth Rate (2019-2024) & (K Units)
Figure 60. South Africa Pagers Sales and Growth Rate (2019-2024) & (K Units)
Figure 61. Global Pagers Sales Forecast by Volume (2026-2034) & (K Units)
Figure 62. Global Pagers Market Size Forecast by Value (2026-2034) & (M USD)
Figure 63. Global Pagers Sales Market Share Forecast by Type (2025-2030)
Figure 64. Global Pagers Market Share Forecast by Type (2025-2030)
Figure 65. Global Pagers Sales Forecast by Application (2025-2030)
Figure 66. Global Pagers Market Share Forecast by Application (2025-2030)