Global Organic Photovoltaic Devices Market Trends Business Strategies 2025-2032

Global Organic Photovoltaic Devices market size was estimated at USD 231 million in 2023 and is projected to reach USD 656.19 million by 2032, exhibiting a CAGR of 12.30% during the forecast period.

PDF Icon Download Sample Report PDF
  • Quick Dispatch

    All Orders

  • Secure Payment

    100% Secure Payment

Compare

$1,500.00$4,250.00

Clear

Organic Photovoltaic Devices Market Overview

Organic photovoltaic devices are a type of solar photovoltaic technology that utilises organic semiconductor materials. Unlike conventional silicon-based solar cells, organic photovoltaic devices use organic (carbon-based) semiconductor materials, typically polymers or small molecule organic compounds, to capture and convert energy from sunlight.

This report provides a deep insight into the global Organic Photovoltaic Devices market covering all its essential aspects. This ranges from a macro overview of the market to micro details of the market size, competitive landscape, development trend, niche market, key market drivers and challenges, SWOT analysis, value chain analysis, etc.

The analysis helps the reader to shape the competition within the industries and strategies for the competitive environment to enhance the potential profit. Furthermore, it provides a simple framework for evaluating and accessing the position of the business organization. The report structure also focuses on the competitive landscape of the Global Organic Photovoltaic Devices Market, this report introduces in detail the market share, market performance, product situation, operation situation, etc. of the main players, which helps the readers in the industry to identify the main competitors and deeply understand the competition pattern of the market.
In a word, this report is a must-read for industry players, investors, researchers, consultants, business strategists, and all those who have any kind of stake or are planning to foray into the Organic Photovoltaic Devices market in any manner.

Organic Photovoltaic Devices Market Analysis:

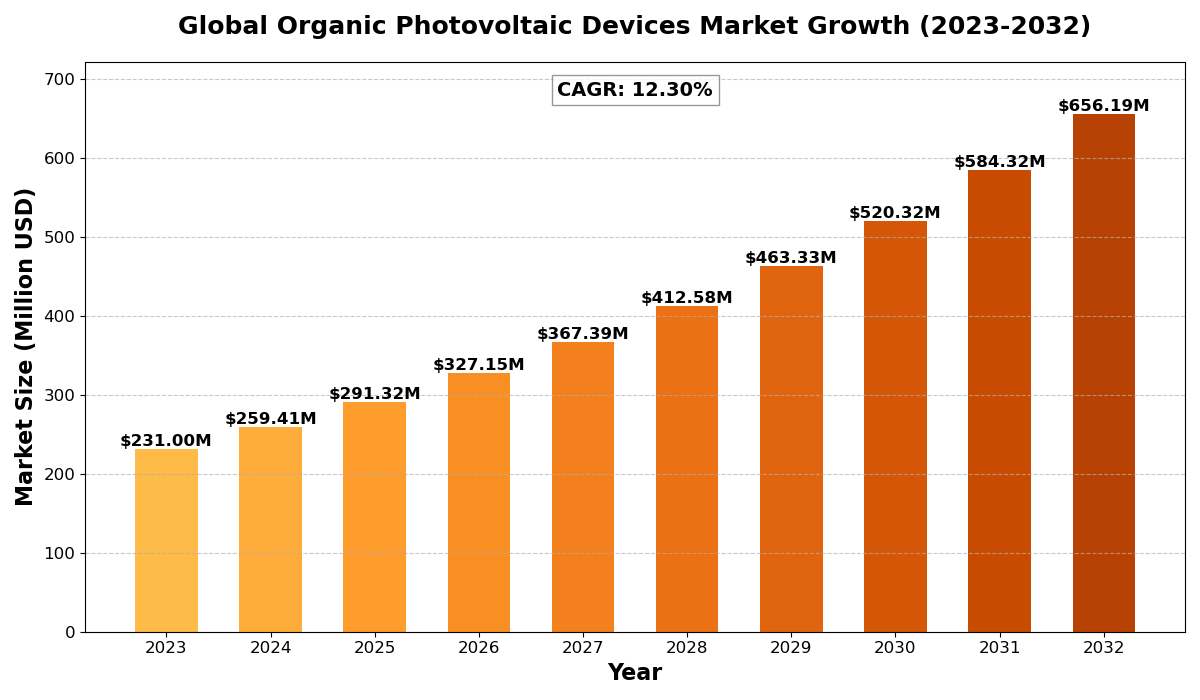
The global Organic Photovoltaic Devices market size was estimated at USD 231 million in 2023 and is projected to reach USD 656.19 million by 2032, exhibiting a CAGR of 12.30% during the forecast period.

North America Organic Photovoltaic Devices market size was estimated at USD 73.55 million in 2023, at a CAGR of 10.54% during the forecast period of 2025 through 2032.

Organic Photovoltaic Devices Key Market Trends  

  1. Advancements in Material Efficiency
    Continuous R&D in organic semiconductors is enhancing OPV device efficiency, making them more competitive with traditional solar technologies.
  2. Growing Adoption in Building-Integrated Photovoltaics (BIPV)
    The flexibility and aesthetic integration of OPV devices are driving their use in BIPV applications, especially in modern architecture.
  3. Increased Focus on Sustainability
    The eco-friendly manufacturing process and recyclability of OPV devices align with global sustainability goals, boosting market adoption.
  4. Expansion in Consumer Electronics
    The lightweight and flexible nature of OPV devices makes them ideal for integration into portable and wearable electronic devices.
  5. Government Incentives and Subsidies
    Supportive policies and subsidies for renewable energy projects are promoting the adoption of OPV devices worldwide.

Organic Photovoltaic Devices Market Regional Analysis :

semi insight

  • North America:Strong demand driven by EVs, 5G infrastructure, and renewable energy, with the U.S. leading the market.
  • Europe:Growth fueled by automotive electrification, renewable energy, and strong regulatory support, with Germany as a key player.
  • Asia-Pacific:Dominates the market due to large-scale manufacturing in China and Japan, with growing demand from EVs, 5G, and semiconductors.
  • South America:Emerging market, driven by renewable energy and EV adoption, with Brazil leading growth.
  • Middle East & Africa:Gradual growth, mainly due to investments in renewable energy and EV infrastructure, with Saudi Arabia and UAE as key contributors.

Organic Photovoltaic Devices Market Segmentation

The research report includes specific segments by region (country), manufacturers, Type, and Application. Market segmentation creates subsets of a market based on product type, end-user or application, Geographic, and other factors. By understanding the market segments, the decision-maker can leverage this targeting in the product, sales, and marketing strategies. Market segments can power your product development cycles by informing how you create product offerings for different segments.
Key Company

  • Heliatek
  • Solarmer Energy
  • Merck
  • Belectric OPV
  • Ossila
  • ARMOR
  • Sumitomo Chemical
  • DisaSolar
  • Heraeus
  • SunCurtain
  • Savvy Science
  • Flask
  • Brilliant Matters
  • Eight19
  • SunPower
  • Epishine
  • Solivus
  • Dracula Technologies

Market Segmentation (by Type)

  • Single-layer Organic Photovoltaic Devices
  • Double-layer Organic Photovoltaic Devices
  • Others

Market Segmentation (by Application)

  • Mobile Devices
  • Aerospace
  • Military
  • Consumer Electronics
  • Others

Drivers

  • Rising Demand for Renewable Energy
    The global shift towards clean energy sources fuels the adoption of OPV devices.
  • Technological Innovations
    Advancements in material science and production techniques enhance OPV device efficiency and reduce costs.
  • Supportive Government Policies
    Incentives and subsidies for solar energy projects encourage investment in OPV technology.

Restraints

  • Lower Efficiency Compared to Traditional PV
    OPV devices generally have lower conversion efficiencies than silicon-based photovoltaics, limiting their competitiveness.
  • Limited Lifespan and Stability
    OPV devices face challenges in long-term stability and durability, affecting their widespread adoption.
  • High Initial R&D Costs
    The substantial investment required for research and development can be a barrier for new market entrants.

Opportunities

  • Emerging Markets in Developing Regions
    Growing energy needs in developing countries present opportunities for OPV market expansion.
  • Integration with IoT Devices
    The compatibility of OPV devices with low-power IoT devices opens new avenues for market growth.
  • Innovations in Transparent OPV Devices
    Developments in transparent OPV technology offer potential for applications in windows and other surfaces.

Challenges

  • Scalability of Production
    Achieving cost-effective large-scale production remains a significant challenge.
  • Competition from Established PV Technologies
    OPV devices face stiff competition from more efficient and mature photovoltaic technologies.
  • Market Awareness and Acceptance
    Limited consumer awareness and confidence in OPV technology hinder market penetration.

Key Benefits of This Market Research:

  • Industry drivers, restraints, and opportunities covered in the study
  • Neutral perspective on the market performance
  • Recent industry trends and developments
  • Competitive landscape & strategies of key players
  • Potential & niche segments and regions exhibiting promising growth covered
  • Historical, current, and projected market size, in terms of value
  • In-depth analysis of the Organic Photovoltaic Devices Market
  • Overview of the regional outlook of the Organic Photovoltaic Devices Market:

Key Reasons to Buy this Report:

  • Access to date statistics compiled by our researchers. These provide you with historical and forecast data, which is analyzed to tell you why your market is set to change
  • This enables you to anticipate market changes to remain ahead of your competitors
  • You will be able to copy data from the Excel spreadsheet straight into your marketing plans, business presentations, or other strategic documents
  • The concise analysis, clear graph, and table format will enable you to pinpoint the information you require quickly
  • Provision of market value data for each segment and sub-segment
  • Indicates the region and segment that is expected to witness the fastest growth as well as to dominate the market
  • Provides insight into the market through Value Chain
  • Market dynamics scenario, along with growth opportunities of the market in the years to come
  • 6-month post-sales analyst support

Customization of the Report
In case of any queries or customization requirements, please connect with our sales team, who will ensure that your requirements are met.

FAQs

Q: What are the key driving factors and opportunities in the global OPV devices market?
A: Key drivers include rising demand for renewable energy, technological innovations, and supportive government policies. Opportunities lie in emerging markets, IoT integration, and transparent OPV developments.


Q: Which region is projected to have the largest market share?
A: Europe is expected to lead the market due to strong government support, advanced research facilities, and high adoption rates in BIPV applications.


Q: Who are the top players in the global OPV devices market?
A: Leading companies include Heliatek GmbH, Armor Group, InfinityPV, Solarmer Energy, and BELECTRIC OPV GmbH.


Q: What are the latest technological advancements in the industry?
A: Recent advancements include the development of high-efficiency organic materials, transparent OPV devices, and roll-to-roll manufacturing processes.


Q: What is the current size of the global OPV devices market?
A: The global OPV devices market was valued at approximately USD 250 million in 2023 and is projected to grow at a CAGR of 12.4% from 2025 to 2032.


Global Organic Photovoltaic Devices Market Trends Business Strategies 2025-2032

Get Sample Report PDF for Exclusive Insights

Report Sample Includes

  • Table of Contents
  • List of Tables & Figures
  • Charts, Research Methodology, and more...
PDF Icon Download Sample Report PDF

Download Sample Report

Table of Content

Table of Contents
1 Research Methodology and Statistical Scope
1.1 Market Definition and Statistical Scope of Organic Photovoltaic Devices
1.2 Key Market Segments
1.2.1 Organic Photovoltaic Devices Segment by Type
1.2.2 Organic Photovoltaic Devices Segment by Application
1.3 Methodology & Sources of Information
1.3.1 Research Methodology
1.3.2 Research Process
1.3.3 Market Breakdown and Data Triangulation
1.3.4 Base Year
1.3.5 Report Assumptions & Caveats
2 Organic Photovoltaic Devices Market Overview
2.1 Global Market Overview
2.1.1 Global Organic Photovoltaic Devices Market Size (M USD) Estimates and Forecasts (2019-2032)
2.1.2 Global Organic Photovoltaic Devices Sales Estimates and Forecasts (2019-2032)
2.2 Market Segment Executive Summary
2.3 Global Market Size by Region
3 Organic Photovoltaic Devices Market Competitive Landscape
3.1 Global Organic Photovoltaic Devices Sales by Manufacturers (2019-2025)
3.2 Global Organic Photovoltaic Devices Revenue Market Share by Manufacturers (2019-2025)
3.3 Organic Photovoltaic Devices Market Share by Company Type (Tier 1, Tier 2, and Tier 3)
3.4 Global Organic Photovoltaic Devices Average Price by Manufacturers (2019-2025)
3.5 Manufacturers Organic Photovoltaic Devices Sales Sites, Area Served, Product Type
3.6 Organic Photovoltaic Devices Market Competitive Situation and Trends
3.6.1 Organic Photovoltaic Devices Market Concentration Rate
3.6.2 Global 5 and 10 Largest Organic Photovoltaic Devices Players Market Share by Revenue
3.6.3 Mergers & Acquisitions, Expansion
4 Organic Photovoltaic Devices Industry Chain Analysis
4.1 Organic Photovoltaic Devices Industry Chain Analysis
4.2 Market Overview of Key Raw Materials
4.3 Midstream Market Analysis
4.4 Downstream Customer Analysis
5 The Development and Dynamics of Organic Photovoltaic Devices Market
5.1 Key Development Trends
5.2 Driving Factors
5.3 Market Challenges
5.4 Market Restraints
5.5 Industry News
5.5.1 New Product Developments
5.5.2 Mergers & Acquisitions
5.5.3 Expansions
5.5.4 Collaboration/Supply Contracts
5.6 Industry Policies
6 Organic Photovoltaic Devices Market Segmentation by Type
6.1 Evaluation Matrix of Segment Market Development Potential (Type)
6.2 Global Organic Photovoltaic Devices Sales Market Share by Type (2019-2025)
6.3 Global Organic Photovoltaic Devices Market Size Market Share by Type (2019-2025)
6.4 Global Organic Photovoltaic Devices Price by Type (2019-2025)
7 Organic Photovoltaic Devices Market Segmentation by Application
7.1 Evaluation Matrix of Segment Market Development Potential (Application)
7.2 Global Organic Photovoltaic Devices Market Sales by Application (2019-2025)
7.3 Global Organic Photovoltaic Devices Market Size (M USD) by Application (2019-2025)
7.4 Global Organic Photovoltaic Devices Sales Growth Rate by Application (2019-2025)
8 Organic Photovoltaic Devices Market Consumption by Region
8.1 Global Organic Photovoltaic Devices Sales by Region
8.1.1 Global Organic Photovoltaic Devices Sales by Region
8.1.2 Global Organic Photovoltaic Devices Sales Market Share by Region
8.2 North America
8.2.1 North America Organic Photovoltaic Devices Sales by Country
8.2.2 U.S.
8.2.3 Canada
8.2.4 Mexico
8.3 Europe
8.3.1 Europe Organic Photovoltaic Devices Sales by Country
8.3.2 Germany
8.3.3 France
8.3.4 U.K.
8.3.5 Italy
8.3.6 Russia
8.4 Asia Pacific
8.4.1 Asia Pacific Organic Photovoltaic Devices Sales by Region
8.4.2 China
8.4.3 Japan
8.4.4 South Korea
8.4.5 India
8.4.6 Southeast Asia
8.5 South America
8.5.1 South America Organic Photovoltaic Devices Sales by Country
8.5.2 Brazil
8.5.3 Argentina
8.5.4 Columbia
8.6 Middle East and Africa
8.6.1 Middle East and Africa Organic Photovoltaic Devices Sales by Region
8.6.2 Saudi Arabia
8.6.3 UAE
8.6.4 Egypt
8.6.5 Nigeria
8.6.6 South Africa
9 Organic Photovoltaic Devices Market Production by Region
9.1 Global Production of Organic Photovoltaic Devices by Region (2019-2025)
9.2 Global Organic Photovoltaic Devices Revenue Market Share by Region (2019-2025)
9.3 Global Organic Photovoltaic Devices Production, Revenue, Price and Gross Margin (2019-2025)
9.4 North America Organic Photovoltaic Devices Production
9.4.1 North America Organic Photovoltaic Devices Production Growth Rate (2019-2025)
9.4.2 North America Organic Photovoltaic Devices Production, Revenue, Price and Gross Margin (2019-2025)
9.5 Europe Organic Photovoltaic Devices Production
9.5.1 Europe Organic Photovoltaic Devices Production Growth Rate (2019-2025)
9.5.2 Europe Organic Photovoltaic Devices Production, Revenue, Price and Gross Margin (2019-2025)
9.6 Japan Organic Photovoltaic Devices Production (2019-2025)
9.6.1 Japan Organic Photovoltaic Devices Production Growth Rate (2019-2025)
9.6.2 Japan Organic Photovoltaic Devices Production, Revenue, Price and Gross Margin (2019-2025)
9.7 China Organic Photovoltaic Devices Production (2019-2025)
9.7.1 China Organic Photovoltaic Devices Production Growth Rate (2019-2025)
9.7.2 China Organic Photovoltaic Devices Production, Revenue, Price and Gross Margin (2019-2025)
10 Key Companies Profile
10.1 Heliatek
10.1.1 Heliatek Organic Photovoltaic Devices Basic Information
10.1.2 Heliatek Organic Photovoltaic Devices Product Overview
10.1.3 Heliatek Organic Photovoltaic Devices Product Market Performance
10.1.4 Heliatek Business Overview
10.1.5 Heliatek Organic Photovoltaic Devices SWOT Analysis
10.1.6 Heliatek Recent Developments
10.2 Solarmer Energy
10.2.1 Solarmer Energy Organic Photovoltaic Devices Basic Information
10.2.2 Solarmer Energy Organic Photovoltaic Devices Product Overview
10.2.3 Solarmer Energy Organic Photovoltaic Devices Product Market Performance
10.2.4 Solarmer Energy Business Overview
10.2.5 Solarmer Energy Organic Photovoltaic Devices SWOT Analysis
10.2.6 Solarmer Energy Recent Developments
10.3 Merck
10.3.1 Merck Organic Photovoltaic Devices Basic Information
10.3.2 Merck Organic Photovoltaic Devices Product Overview
10.3.3 Merck Organic Photovoltaic Devices Product Market Performance
10.3.4 Merck Organic Photovoltaic Devices SWOT Analysis
10.3.5 Merck Business Overview
10.3.6 Merck Recent Developments
10.4 Belectric OPV
10.4.1 Belectric OPV Organic Photovoltaic Devices Basic Information
10.4.2 Belectric OPV Organic Photovoltaic Devices Product Overview
10.4.3 Belectric OPV Organic Photovoltaic Devices Product Market Performance
10.4.4 Belectric OPV Business Overview
10.4.5 Belectric OPV Recent Developments
10.5 Ossila
10.5.1 Ossila Organic Photovoltaic Devices Basic Information
10.5.2 Ossila Organic Photovoltaic Devices Product Overview
10.5.3 Ossila Organic Photovoltaic Devices Product Market Performance
10.5.4 Ossila Business Overview
10.5.5 Ossila Recent Developments
10.6 ARMOR
10.6.1 ARMOR Organic Photovoltaic Devices Basic Information
10.6.2 ARMOR Organic Photovoltaic Devices Product Overview
10.6.3 ARMOR Organic Photovoltaic Devices Product Market Performance
10.6.4 ARMOR Business Overview
10.6.5 ARMOR Recent Developments
10.7 Sumitomo Chemical
10.7.1 Sumitomo Chemical Organic Photovoltaic Devices Basic Information
10.7.2 Sumitomo Chemical Organic Photovoltaic Devices Product Overview
10.7.3 Sumitomo Chemical Organic Photovoltaic Devices Product Market Performance
10.7.4 Sumitomo Chemical Business Overview
10.7.5 Sumitomo Chemical Recent Developments
10.8 DisaSolar
10.8.1 DisaSolar Organic Photovoltaic Devices Basic Information
10.8.2 DisaSolar Organic Photovoltaic Devices Product Overview
10.8.3 DisaSolar Organic Photovoltaic Devices Product Market Performance
10.8.4 DisaSolar Business Overview
10.8.5 DisaSolar Recent Developments
10.9 Heraeus
10.9.1 Heraeus Organic Photovoltaic Devices Basic Information
10.9.2 Heraeus Organic Photovoltaic Devices Product Overview
10.9.3 Heraeus Organic Photovoltaic Devices Product Market Performance
10.9.4 Heraeus Business Overview
10.9.5 Heraeus Recent Developments
10.10 SunCurtain
10.10.1 SunCurtain Organic Photovoltaic Devices Basic Information
10.10.2 SunCurtain Organic Photovoltaic Devices Product Overview
10.10.3 SunCurtain Organic Photovoltaic Devices Product Market Performance
10.10.4 SunCurtain Business Overview
10.10.5 SunCurtain Recent Developments
10.11 Savvy Science
10.11.1 Savvy Science Organic Photovoltaic Devices Basic Information
10.11.2 Savvy Science Organic Photovoltaic Devices Product Overview
10.11.3 Savvy Science Organic Photovoltaic Devices Product Market Performance
10.11.4 Savvy Science Business Overview
10.11.5 Savvy Science Recent Developments
10.12 Flask
10.12.1 Flask Organic Photovoltaic Devices Basic Information
10.12.2 Flask Organic Photovoltaic Devices Product Overview
10.12.3 Flask Organic Photovoltaic Devices Product Market Performance
10.12.4 Flask Business Overview
10.12.5 Flask Recent Developments
10.13 Brilliant Matters
10.13.1 Brilliant Matters Organic Photovoltaic Devices Basic Information
10.13.2 Brilliant Matters Organic Photovoltaic Devices Product Overview
10.13.3 Brilliant Matters Organic Photovoltaic Devices Product Market Performance
10.13.4 Brilliant Matters Business Overview
10.13.5 Brilliant Matters Recent Developments
10.14 Eight19
10.14.1 Eight19 Organic Photovoltaic Devices Basic Information
10.14.2 Eight19 Organic Photovoltaic Devices Product Overview
10.14.3 Eight19 Organic Photovoltaic Devices Product Market Performance
10.14.4 Eight19 Business Overview
10.14.5 Eight19 Recent Developments
10.15 SunPower
10.15.1 SunPower Organic Photovoltaic Devices Basic Information
10.15.2 SunPower Organic Photovoltaic Devices Product Overview
10.15.3 SunPower Organic Photovoltaic Devices Product Market Performance
10.15.4 SunPower Business Overview
10.15.5 SunPower Recent Developments
10.16 Epishine
10.16.1 Epishine Organic Photovoltaic Devices Basic Information
10.16.2 Epishine Organic Photovoltaic Devices Product Overview
10.16.3 Epishine Organic Photovoltaic Devices Product Market Performance
10.16.4 Epishine Business Overview
10.16.5 Epishine Recent Developments
10.17 Solivus
10.17.1 Solivus Organic Photovoltaic Devices Basic Information
10.17.2 Solivus Organic Photovoltaic Devices Product Overview
10.17.3 Solivus Organic Photovoltaic Devices Product Market Performance
10.17.4 Solivus Business Overview
10.17.5 Solivus Recent Developments
10.18 Dracula Technologies
10.18.1 Dracula Technologies Organic Photovoltaic Devices Basic Information
10.18.2 Dracula Technologies Organic Photovoltaic Devices Product Overview
10.18.3 Dracula Technologies Organic Photovoltaic Devices Product Market Performance
10.18.4 Dracula Technologies Business Overview
10.18.5 Dracula Technologies Recent Developments
11 Organic Photovoltaic Devices Market Forecast by Region
11.1 Global Organic Photovoltaic Devices Market Size Forecast
11.2 Global Organic Photovoltaic Devices Market Forecast by Region
11.2.1 North America Market Size Forecast by Country
11.2.2 Europe Organic Photovoltaic Devices Market Size Forecast by Country
11.2.3 Asia Pacific Organic Photovoltaic Devices Market Size Forecast by Region
11.2.4 South America Organic Photovoltaic Devices Market Size Forecast by Country
11.2.5 Middle East and Africa Forecasted Consumption of Organic Photovoltaic Devices by Country
12 Forecast Market by Type and by Application (2025-2032)
12.1 Global Organic Photovoltaic Devices Market Forecast by Type (2025-2032)
12.1.1 Global Forecasted Sales of Organic Photovoltaic Devices by Type (2025-2032)
12.1.2 Global Organic Photovoltaic Devices Market Size Forecast by Type (2025-2032)
12.1.3 Global Forecasted Price of Organic Photovoltaic Devices by Type (2025-2032)
12.2 Global Organic Photovoltaic Devices Market Forecast by Application (2025-2032)
12.2.1 Global Organic Photovoltaic Devices Sales (K Units) Forecast by Application
12.2.2 Global Organic Photovoltaic Devices Market Size (M USD) Forecast by Application (2025-2032)
13 Conclusion and Key FindingsList of Tables
Table 1. Introduction of the Type
Table 2. Introduction of the Application
Table 3. Market Size (M USD) Segment Executive Summary
Table 4. Organic Photovoltaic Devices Market Size Comparison by Region (M USD)
Table 5. Global Organic Photovoltaic Devices Sales (K Units) by Manufacturers (2019-2025)
Table 6. Global Organic Photovoltaic Devices Sales Market Share by Manufacturers (2019-2025)
Table 7. Global Organic Photovoltaic Devices Revenue (M USD) by Manufacturers (2019-2025)
Table 8. Global Organic Photovoltaic Devices Revenue Share by Manufacturers (2019-2025)
Table 9. Company Type (Tier 1, Tier 2, and Tier 3) & (based on the Revenue in Organic Photovoltaic Devices as of 2022)
Table 10. Global Market Organic Photovoltaic Devices Average Price (USD/Unit) of Key Manufacturers (2019-2025)
Table 11. Manufacturers Organic Photovoltaic Devices Sales Sites and Area Served
Table 12. Manufacturers Organic Photovoltaic Devices Product Type
Table 13. Global Organic Photovoltaic Devices Manufacturers Market Concentration Ratio (CR5 and HHI)
Table 14. Mergers & Acquisitions, Expansion Plans
Table 15. Industry Chain Map of Organic Photovoltaic Devices
Table 16. Market Overview of Key Raw Materials
Table 17. Midstream Market Analysis
Table 18. Downstream Customer Analysis
Table 19. Key Development Trends
Table 20. Driving Factors
Table 21. Organic Photovoltaic Devices Market Challenges
Table 22. Global Organic Photovoltaic Devices Sales by Type (K Units)
Table 23. Global Organic Photovoltaic Devices Market Size by Type (M USD)
Table 24. Global Organic Photovoltaic Devices Sales (K Units) by Type (2019-2025)
Table 25. Global Organic Photovoltaic Devices Sales Market Share by Type (2019-2025)
Table 26. Global Organic Photovoltaic Devices Market Size (M USD) by Type (2019-2025)
Table 27. Global Organic Photovoltaic Devices Market Size Share by Type (2019-2025)
Table 28. Global Organic Photovoltaic Devices Price (USD/Unit) by Type (2019-2025)
Table 29. Global Organic Photovoltaic Devices Sales (K Units) by Application
Table 30. Global Organic Photovoltaic Devices Market Size by Application
Table 31. Global Organic Photovoltaic Devices Sales by Application (2019-2025) & (K Units)
Table 32. Global Organic Photovoltaic Devices Sales Market Share by Application (2019-2025)
Table 33. Global Organic Photovoltaic Devices Sales by Application (2019-2025) & (M USD)
Table 34. Global Organic Photovoltaic Devices Market Share by Application (2019-2025)
Table 35. Global Organic Photovoltaic Devices Sales Growth Rate by Application (2019-2025)
Table 36. Global Organic Photovoltaic Devices Sales by Region (2019-2025) & (K Units)
Table 37. Global Organic Photovoltaic Devices Sales Market Share by Region (2019-2025)
Table 38. North America Organic Photovoltaic Devices Sales by Country (2019-2025) & (K Units)
Table 39. Europe Organic Photovoltaic Devices Sales by Country (2019-2025) & (K Units)
Table 40. Asia Pacific Organic Photovoltaic Devices Sales by Region (2019-2025) & (K Units)
Table 41. South America Organic Photovoltaic Devices Sales by Country (2019-2025) & (K Units)
Table 42. Middle East and Africa Organic Photovoltaic Devices Sales by Region (2019-2025) & (K Units)
Table 43. Global Organic Photovoltaic Devices Production (K Units) by Region (2019-2025)
Table 44. Global Organic Photovoltaic Devices Revenue (US$ Million) by Region (2019-2025)
Table 45. Global Organic Photovoltaic Devices Revenue Market Share by Region (2019-2025)
Table 46. Global Organic Photovoltaic Devices Production (K Units), Revenue (US$ Million), Price (USD/Unit) and Gross Margin (2019-2025)
Table 47. North America Organic Photovoltaic Devices Production (K Units), Revenue (US$ Million), Price (USD/Unit) and Gross Margin (2019-2025)
Table 48. Europe Organic Photovoltaic Devices Production (K Units), Revenue (US$ Million), Price (USD/Unit) and Gross Margin (2019-2025)
Table 49. Japan Organic Photovoltaic Devices Production (K Units), Revenue (US$ Million), Price (USD/Unit) and Gross Margin (2019-2025)
Table 50. China Organic Photovoltaic Devices Production (K Units), Revenue (US$ Million), Price (USD/Unit) and Gross Margin (2019-2025)
Table 51. Heliatek Organic Photovoltaic Devices Basic Information
Table 52. Heliatek Organic Photovoltaic Devices Product Overview
Table 53. Heliatek Organic Photovoltaic Devices Sales (K Units), Revenue (M USD), Price (USD/Unit) and Gross Margin (2019-2025)
Table 54. Heliatek Business Overview
Table 55. Heliatek Organic Photovoltaic Devices SWOT Analysis
Table 56. Heliatek Recent Developments
Table 57. Solarmer Energy Organic Photovoltaic Devices Basic Information
Table 58. Solarmer Energy Organic Photovoltaic Devices Product Overview
Table 59. Solarmer Energy Organic Photovoltaic Devices Sales (K Units), Revenue (M USD), Price (USD/Unit) and Gross Margin (2019-2025)
Table 60. Solarmer Energy Business Overview
Table 61. Solarmer Energy Organic Photovoltaic Devices SWOT Analysis
Table 62. Solarmer Energy Recent Developments
Table 63. Merck Organic Photovoltaic Devices Basic Information
Table 64. Merck Organic Photovoltaic Devices Product Overview
Table 65. Merck Organic Photovoltaic Devices Sales (K Units), Revenue (M USD), Price (USD/Unit) and Gross Margin (2019-2025)
Table 66. Merck Organic Photovoltaic Devices SWOT Analysis
Table 67. Merck Business Overview
Table 68. Merck Recent Developments
Table 69. Belectric OPV Organic Photovoltaic Devices Basic Information
Table 70. Belectric OPV Organic Photovoltaic Devices Product Overview
Table 71. Belectric OPV Organic Photovoltaic Devices Sales (K Units), Revenue (M USD), Price (USD/Unit) and Gross Margin (2019-2025)
Table 72. Belectric OPV Business Overview
Table 73. Belectric OPV Recent Developments
Table 74. Ossila Organic Photovoltaic Devices Basic Information
Table 75. Ossila Organic Photovoltaic Devices Product Overview
Table 76. Ossila Organic Photovoltaic Devices Sales (K Units), Revenue (M USD), Price (USD/Unit) and Gross Margin (2019-2025)
Table 77. Ossila Business Overview
Table 78. Ossila Recent Developments
Table 79. ARMOR Organic Photovoltaic Devices Basic Information
Table 80. ARMOR Organic Photovoltaic Devices Product Overview
Table 81. ARMOR Organic Photovoltaic Devices Sales (K Units), Revenue (M USD), Price (USD/Unit) and Gross Margin (2019-2025)
Table 82. ARMOR Business Overview
Table 83. ARMOR Recent Developments
Table 84. Sumitomo Chemical Organic Photovoltaic Devices Basic Information
Table 85. Sumitomo Chemical Organic Photovoltaic Devices Product Overview
Table 86. Sumitomo Chemical Organic Photovoltaic Devices Sales (K Units), Revenue (M USD), Price (USD/Unit) and Gross Margin (2019-2025)
Table 87. Sumitomo Chemical Business Overview
Table 88. Sumitomo Chemical Recent Developments
Table 89. DisaSolar Organic Photovoltaic Devices Basic Information
Table 90. DisaSolar Organic Photovoltaic Devices Product Overview
Table 91. DisaSolar Organic Photovoltaic Devices Sales (K Units), Revenue (M USD), Price (USD/Unit) and Gross Margin (2019-2025)
Table 92. DisaSolar Business Overview
Table 93. DisaSolar Recent Developments
Table 94. Heraeus Organic Photovoltaic Devices Basic Information
Table 95. Heraeus Organic Photovoltaic Devices Product Overview
Table 96. Heraeus Organic Photovoltaic Devices Sales (K Units), Revenue (M USD), Price (USD/Unit) and Gross Margin (2019-2025)
Table 97. Heraeus Business Overview
Table 98. Heraeus Recent Developments
Table 99. SunCurtain Organic Photovoltaic Devices Basic Information
Table 100. SunCurtain Organic Photovoltaic Devices Product Overview
Table 101. SunCurtain Organic Photovoltaic Devices Sales (K Units), Revenue (M USD), Price (USD/Unit) and Gross Margin (2019-2025)
Table 102. SunCurtain Business Overview
Table 103. SunCurtain Recent Developments
Table 104. Savvy Science Organic Photovoltaic Devices Basic Information
Table 105. Savvy Science Organic Photovoltaic Devices Product Overview
Table 106. Savvy Science Organic Photovoltaic Devices Sales (K Units), Revenue (M USD), Price (USD/Unit) and Gross Margin (2019-2025)
Table 107. Savvy Science Business Overview
Table 108. Savvy Science Recent Developments
Table 109. Flask Organic Photovoltaic Devices Basic Information
Table 110. Flask Organic Photovoltaic Devices Product Overview
Table 111. Flask Organic Photovoltaic Devices Sales (K Units), Revenue (M USD), Price (USD/Unit) and Gross Margin (2019-2025)
Table 112. Flask Business Overview
Table 113. Flask Recent Developments
Table 114. Brilliant Matters Organic Photovoltaic Devices Basic Information
Table 115. Brilliant Matters Organic Photovoltaic Devices Product Overview
Table 116. Brilliant Matters Organic Photovoltaic Devices Sales (K Units), Revenue (M USD), Price (USD/Unit) and Gross Margin (2019-2025)
Table 117. Brilliant Matters Business Overview
Table 118. Brilliant Matters Recent Developments
Table 119. Eight19 Organic Photovoltaic Devices Basic Information
Table 120. Eight19 Organic Photovoltaic Devices Product Overview
Table 121. Eight19 Organic Photovoltaic Devices Sales (K Units), Revenue (M USD), Price (USD/Unit) and Gross Margin (2019-2025)
Table 122. Eight19 Business Overview
Table 123. Eight19 Recent Developments
Table 124. SunPower Organic Photovoltaic Devices Basic Information
Table 125. SunPower Organic Photovoltaic Devices Product Overview
Table 126. SunPower Organic Photovoltaic Devices Sales (K Units), Revenue (M USD), Price (USD/Unit) and Gross Margin (2019-2025)
Table 127. SunPower Business Overview
Table 128. SunPower Recent Developments
Table 129. Epishine Organic Photovoltaic Devices Basic Information
Table 130. Epishine Organic Photovoltaic Devices Product Overview
Table 131. Epishine Organic Photovoltaic Devices Sales (K Units), Revenue (M USD), Price (USD/Unit) and Gross Margin (2019-2025)
Table 132. Epishine Business Overview
Table 133. Epishine Recent Developments
Table 134. Solivus Organic Photovoltaic Devices Basic Information
Table 135. Solivus Organic Photovoltaic Devices Product Overview
Table 136. Solivus Organic Photovoltaic Devices Sales (K Units), Revenue (M USD), Price (USD/Unit) and Gross Margin (2019-2025)
Table 137. Solivus Business Overview
Table 138. Solivus Recent Developments
Table 139. Dracula Technologies Organic Photovoltaic Devices Basic Information
Table 140. Dracula Technologies Organic Photovoltaic Devices Product Overview
Table 141. Dracula Technologies Organic Photovoltaic Devices Sales (K Units), Revenue (M USD), Price (USD/Unit) and Gross Margin (2019-2025)
Table 142. Dracula Technologies Business Overview
Table 143. Dracula Technologies Recent Developments
Table 144. Global Organic Photovoltaic Devices Sales Forecast by Region (2025-2032) & (K Units)
Table 145. Global Organic Photovoltaic Devices Market Size Forecast by Region (2025-2032) & (M USD)
Table 146. North America Organic Photovoltaic Devices Sales Forecast by Country (2025-2032) & (K Units)
Table 147. North America Organic Photovoltaic Devices Market Size Forecast by Country (2025-2032) & (M USD)
Table 148. Europe Organic Photovoltaic Devices Sales Forecast by Country (2025-2032) & (K Units)
Table 149. Europe Organic Photovoltaic Devices Market Size Forecast by Country (2025-2032) & (M USD)
Table 150. Asia Pacific Organic Photovoltaic Devices Sales Forecast by Region (2025-2032) & (K Units)
Table 151. Asia Pacific Organic Photovoltaic Devices Market Size Forecast by Region (2025-2032) & (M USD)
Table 152. South America Organic Photovoltaic Devices Sales Forecast by Country (2025-2032) & (K Units)
Table 153. South America Organic Photovoltaic Devices Market Size Forecast by Country (2025-2032) & (M USD)
Table 154. Middle East and Africa Organic Photovoltaic Devices Consumption Forecast by Country (2025-2032) & (Units)
Table 155. Middle East and Africa Organic Photovoltaic Devices Market Size Forecast by Country (2025-2032) & (M USD)
Table 156. Global Organic Photovoltaic Devices Sales Forecast by Type (2025-2032) & (K Units)
Table 157. Global Organic Photovoltaic Devices Market Size Forecast by Type (2025-2032) & (M USD)
Table 158. Global Organic Photovoltaic Devices Price Forecast by Type (2025-2032) & (USD/Unit)
Table 159. Global Organic Photovoltaic Devices Sales (K Units) Forecast by Application (2025-2032)
Table 160. Global Organic Photovoltaic Devices Market Size Forecast by Application (2025-2032) & (M USD)
List of Figures
Figure 1. Product Picture of Organic Photovoltaic Devices
Figure 2. Data Triangulation
Figure 3. Key Caveats
Figure 4. Global Organic Photovoltaic Devices Market Size (M USD), 2019-2032
Figure 5. Global Organic Photovoltaic Devices Market Size (M USD) (2019-2032)
Figure 6. Global Organic Photovoltaic Devices Sales (K Units) & (2019-2032)
Figure 7. Evaluation Matrix of Segment Market Development Potential (Type)
Figure 8. Evaluation Matrix of Segment Market Development Potential (Application)
Figure 9. Evaluation Matrix of Regional Market Development Potential
Figure 10. Organic Photovoltaic Devices Market Size by Country (M USD)
Figure 11. Organic Photovoltaic Devices Sales Share by Manufacturers in 2023
Figure 12. Global Organic Photovoltaic Devices Revenue Share by Manufacturers in 2023
Figure 13. Organic Photovoltaic Devices Market Share by Company Type (Tier 1, Tier 2 and Tier 3): 2023
Figure 14. Global Market Organic Photovoltaic Devices Average Price (USD/Unit) of Key Manufacturers in 2023
Figure 15. The Global 5 and 10 Largest Players: Market Share by Organic Photovoltaic Devices Revenue in 2023
Figure 16. Evaluation Matrix of Segment Market Development Potential (Type)
Figure 17. Global Organic Photovoltaic Devices Market Share by Type
Figure 18. Sales Market Share of Organic Photovoltaic Devices by Type (2019-2025)
Figure 19. Sales Market Share of Organic Photovoltaic Devices by Type in 2023
Figure 20. Market Size Share of Organic Photovoltaic Devices by Type (2019-2025)
Figure 21. Market Size Market Share of Organic Photovoltaic Devices by Type in 2023
Figure 22. Evaluation Matrix of Segment Market Development Potential (Application)
Figure 23. Global Organic Photovoltaic Devices Market Share by Application
Figure 24. Global Organic Photovoltaic Devices Sales Market Share by Application (2019-2025)
Figure 25. Global Organic Photovoltaic Devices Sales Market Share by Application in 2023
Figure 26. Global Organic Photovoltaic Devices Market Share by Application (2019-2025)
Figure 27. Global Organic Photovoltaic Devices Market Share by Application in 2023
Figure 28. Global Organic Photovoltaic Devices Sales Growth Rate by Application (2019-2025)
Figure 29. Global Organic Photovoltaic Devices Sales Market Share by Region (2019-2025)
Figure 30. North America Organic Photovoltaic Devices Sales and Growth Rate (2019-2025) & (K Units)
Figure 31. North America Organic Photovoltaic Devices Sales Market Share by Country in 2023
Figure 32. U.S. Organic Photovoltaic Devices Sales and Growth Rate (2019-2025) & (K Units)
Figure 33. Canada Organic Photovoltaic Devices Sales (K Units) and Growth Rate (2019-2025)
Figure 34. Mexico Organic Photovoltaic Devices Sales (Units) and Growth Rate (2019-2025)
Figure 35. Europe Organic Photovoltaic Devices Sales and Growth Rate (2019-2025) & (K Units)
Figure 36. Europe Organic Photovoltaic Devices Sales Market Share by Country in 2023
Figure 37. Germany Organic Photovoltaic Devices Sales and Growth Rate (2019-2025) & (K Units)
Figure 38. France Organic Photovoltaic Devices Sales and Growth Rate (2019-2025) & (K Units)
Figure 39. U.K. Organic Photovoltaic Devices Sales and Growth Rate (2019-2025) & (K Units)
Figure 40. Italy Organic Photovoltaic Devices Sales and Growth Rate (2019-2025) & (K Units)
Figure 41. Russia Organic Photovoltaic Devices Sales and Growth Rate (2019-2025) & (K Units)
Figure 42. Asia Pacific Organic Photovoltaic Devices Sales and Growth Rate (K Units)
Figure 43. Asia Pacific Organic Photovoltaic Devices Sales Market Share by Region in 2023
Figure 44. China Organic Photovoltaic Devices Sales and Growth Rate (2019-2025) & (K Units)
Figure 45. Japan Organic Photovoltaic Devices Sales and Growth Rate (2019-2025) & (K Units)
Figure 46. South Korea Organic Photovoltaic Devices Sales and Growth Rate (2019-2025) & (K Units)
Figure 47. India Organic Photovoltaic Devices Sales and Growth Rate (2019-2025) & (K Units)
Figure 48. Southeast Asia Organic Photovoltaic Devices Sales and Growth Rate (2019-2025) & (K Units)
Figure 49. South America Organic Photovoltaic Devices Sales and Growth Rate (K Units)
Figure 50. South America Organic Photovoltaic Devices Sales Market Share by Country in 2023
Figure 51. Brazil Organic Photovoltaic Devices Sales and Growth Rate (2019-2025) & (K Units)
Figure 52. Argentina Organic Photovoltaic Devices Sales and Growth Rate (2019-2025) & (K Units)
Figure 53. Columbia Organic Photovoltaic Devices Sales and Growth Rate (2019-2025) & (K Units)
Figure 54. Middle East and Africa Organic Photovoltaic Devices Sales and Growth Rate (K Units)
Figure 55. Middle East and Africa Organic Photovoltaic Devices Sales Market Share by Region in 2023
Figure 56. Saudi Arabia Organic Photovoltaic Devices Sales and Growth Rate (2019-2025) & (K Units)
Figure 57. UAE Organic Photovoltaic Devices Sales and Growth Rate (2019-2025) & (K Units)
Figure 58. Egypt Organic Photovoltaic Devices Sales and Growth Rate (2019-2025) & (K Units)
Figure 59. Nigeria Organic Photovoltaic Devices Sales and Growth Rate (2019-2025) & (K Units)
Figure 60. South Africa Organic Photovoltaic Devices Sales and Growth Rate (2019-2025) & (K Units)
Figure 61. Global Organic Photovoltaic Devices Production Market Share by Region (2019-2025)
Figure 62. North America Organic Photovoltaic Devices Production (K Units) Growth Rate (2019-2025)
Figure 63. Europe Organic Photovoltaic Devices Production (K Units) Growth Rate (2019-2025)
Figure 64. Japan Organic Photovoltaic Devices Production (K Units) Growth Rate (2019-2025)
Figure 65. China Organic Photovoltaic Devices Production (K Units) Growth Rate (2019-2025)
Figure 66. Global Organic Photovoltaic Devices Sales Forecast by Volume (2019-2032) & (K Units)
Figure 67. Global Organic Photovoltaic Devices Market Size Forecast by Value (2019-2032) & (M USD)
Figure 68. Global Organic Photovoltaic Devices Sales Market Share Forecast by Type (2025-2032)
Figure 69. Global Organic Photovoltaic Devices Market Share Forecast by Type (2025-2032)
Figure 70. Global Organic Photovoltaic Devices Sales Forecast by Application (2025-2032)
Figure 71. Global Organic Photovoltaic Devices Market Share Forecast by Application (2025-2032)