MARKET INSIGHTS
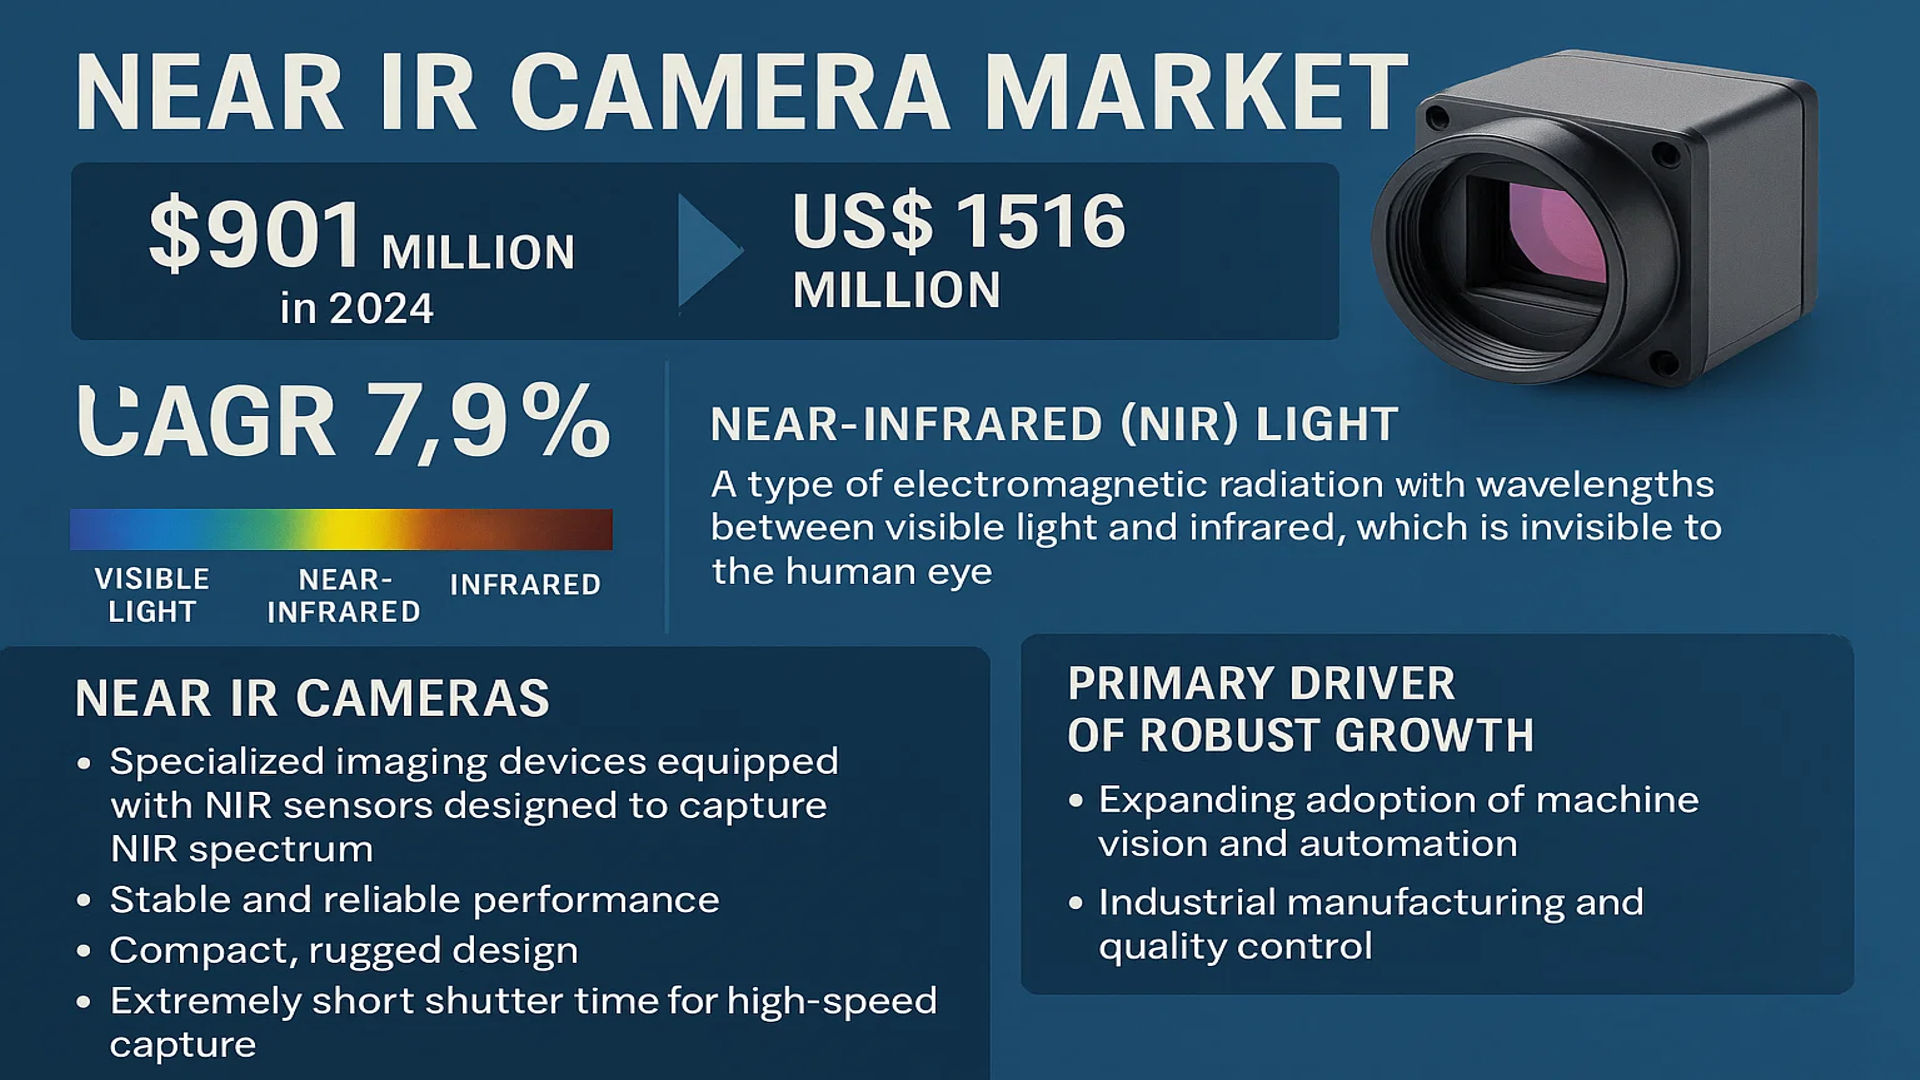
The global Near IR Camera Market was valued at 901 million in 2024 and is projected to reach US$ 1516 million by 2032, at a CAGR of 7.9% during the forecast period.
Near-infrared (NIR) light is a type of electromagnetic radiation with wavelengths between visible light and infrared, which is invisible to the human eye. Near IR Cameras are specialized imaging devices equipped with NIR sensors designed to capture this spectrum. These cameras offer stable and reliable performance with a compact, rugged design that makes them highly durable and suitable for deployment in harsh industrial environments for extended periods. A key technical advantage is their extremely short shutter time, enabling the capture of high-speed moving objects with precision. Furthermore, they output raw data across a wide spectral range, making them ideally suited for advanced image processing and machine vision applications, unlike standard cameras whose compressed JPEG outputs are limited to the human visual spectrum and are less suitable for analytical processing.
This robust growth is primarily driven by the expanding adoption of machine vision and automation across various sectors, including industrial manufacturing and quality control. The superior performance characteristics of NIR cameras, such as their ability to operate in low-light conditions and capture detailed data beyond human vision, are making them indispensable. The market is also being propelled by advancements in sensor technology and increasing investments in smart infrastructure and security systems. The competitive landscape is concentrated, with the top five manufacturers—including JAI, FLIR Systems, and Allied Vision Technologies—collectively holding over 55% of the global market share. Geographically, the United States represents the largest market with over 35% share, followed closely by Europe and Japan. In terms of technology, CCD sensors currently dominate, accounting for more than 50% of the market.
MARKET DYNAMICS
MARKET DRIVERS
Expanding Industrial Automation and Machine Vision Applications to Propel Market Growth
The global surge in industrial automation represents a fundamental driver for Near IR camera adoption. Machine vision systems utilizing NIR technology have become indispensable in manufacturing quality control, where they detect defects invisible to standard cameras. The industrial automation market is projected to exceed 400 billion by 2030, creating substantial demand for advanced imaging solutions. Near IR cameras excel in material sorting, pharmaceutical inspection, and food quality assessment due to their ability to penetrate surfaces and reveal sub-surface characteristics. This capability is particularly valuable in electronics manufacturing, where NIR cameras inspect silicon wafers and semiconductor components with precision unmatched by visible light imaging. The technology’s reliability in continuous operation environments makes it ideal for 24/7 manufacturing facilities, driving consistent market expansion across global industrial sectors.
Advancements in Security and Surveillance Infrastructure to Accelerate Adoption
Security and surveillance applications constitute a significant growth vector for Near IR cameras, particularly in nighttime monitoring and covert operations. Modern security infrastructure investments have increased by approximately 15% annually, with governments and private enterprises prioritizing advanced surveillance capabilities. NIR cameras provide critical advantages in low-light conditions, enabling clear imaging without visible illumination that would alert subjects. Border control applications extensively utilize these cameras for perimeter security, while urban surveillance systems employ them for traffic monitoring and public safety. The technology’s ability to capture license plates and facial features in near-total darkness has made it standard in law enforcement and critical infrastructure protection. Furthermore, the integration of artificial intelligence with NIR imaging has created intelligent surveillance systems capable of automated threat detection, further expanding market potential.
Medical and Scientific Research Applications to Drive Technological Innovation
The healthcare and life sciences sector represents a high-growth segment for Near IR camera applications, particularly in medical imaging and research instrumentation. Biomedical imaging applications have grown at approximately 12% annually, driven by increasing diagnostic requirements and research funding. NIR cameras enable non-invasive imaging techniques such as near-infrared fluorescence imaging and spectroscopy, which are revolutionizing medical diagnostics and surgical guidance. These cameras facilitate brain activity monitoring, tissue oxygenation assessment, and cancer detection through specialized imaging protocols. Research institutions increasingly utilize NIR cameras in spectroscopy applications for chemical analysis and material characterization. The technology’s ability to provide detailed molecular information without harmful radiation makes it particularly valuable in prolonged medical monitoring and sensitive research environments.
➤ For instance, recent developments in hyperspectral NIR imaging have enabled researchers to detect early-stage plant diseases and assess food quality with unprecedented accuracy, opening new agricultural applications.
Furthermore, the integration of NIR cameras with portable medical devices and point-of-care diagnostics creates additional growth opportunities across global healthcare markets.
MARKET CHALLENGES
High Initial Investment and Total Cost of Ownership to Constrain Market Penetration
Despite strong growth prospects, the Near IR camera market faces significant cost-related challenges that limit broader adoption. Premium NIR cameras typically cost 40-60% more than equivalent visible light cameras due to specialized sensors and manufacturing processes. The price differential becomes particularly pronounced in high-resolution applications, where costs can exceed standard industrial cameras by 300%. This cost barrier affects price-sensitive markets and small-to-medium enterprises seeking to implement machine vision solutions. Beyond initial purchase costs, system integration expenses, specialized lens requirements, and maintenance create substantial total cost of ownership considerations. These financial constraints particularly impact emerging economies and cost-conscious industries, slowing market expansion in segments where budget limitations outweigh performance advantages.
Other Challenges
Technical Complexity and Integration Barriers
The implementation of NIR imaging systems requires specialized technical expertise that remains scarce in many markets. System integration challenges include precise calibration, environmental compensation, and data processing complexities that demand experienced engineers. The shortage of qualified professionals capable of designing and maintaining NIR imaging systems creates implementation bottlenecks, particularly in regions with developing technological infrastructure. Additionally, integrating NIR cameras with existing manufacturing or surveillance systems often requires custom solutions that increase project timelines and costs.
Performance Limitations in Specific Environmental Conditions
While NIR cameras excel in many applications, they face performance challenges in certain environmental conditions. Extreme temperature variations can affect sensor performance, requiring additional environmental controls that increase system complexity. High-humidity environments can cause optical issues, while certain materials exhibit limited NIR penetration capabilities. These limitations necessitate careful application assessment and sometimes require complementary imaging technologies, creating additional cost and complexity considerations for end-users.
MARKET RESTRAINTS
Competition from Alternative Imaging Technologies to Limit Market Expansion
The Near IR camera market faces significant competition from emerging imaging technologies that offer overlapping capabilities, often at lower costs. Thermal imaging cameras, particularly uncooled microbolometer-based systems, have achieved substantial price reductions while improving resolution. These alternatives provide viable solutions for many surveillance and industrial applications where temperature differential rather than material penetration is the primary requirement. Similarly, advancements in visible light camera technology, including improved low-light performance and computational photography techniques, have narrowed the performance gap in certain applications. The competitive pressure from these alternative technologies forces NIR camera manufacturers to continually innovate while facing pricing pressures that affect profit margins and market share.
Standardization and Interoperability Issues to Hinder Market Development
The lack of universal standards for NIR imaging creates significant market restraints through interoperability challenges and limited system compatibility. Unlike visible light cameras that benefit from established interface standards, NIR cameras often require proprietary software and custom integration solutions. This fragmentation increases implementation costs and creates vendor lock-in situations that discourage potential customers. The absence of standardized performance metrics makes comparative evaluation difficult, complicating procurement decisions across industries. These standardization issues particularly affect smaller enterprises and multi-vendor system integrations, limiting market growth in segments requiring flexible, scalable imaging solutions.
Regulatory Compliance and Export Restrictions to Affect Market Accessibility
Stringent regulatory frameworks governing advanced imaging technologies create additional market restraints, particularly regarding international trade and specific application areas. Certain high-performance NIR cameras face export restrictions due to their potential dual-use applications in military and surveillance contexts. Compliance with regional regulations, such as electromagnetic compatibility standards and safety certifications, adds development costs and time-to-market considerations. These regulatory hurdles particularly affect smaller manufacturers and limit market accessibility in regions with complex compliance requirements, creating barriers to global market expansion.
MARKET OPPORTUNITIES
Emerging Applications in Autonomous Vehicles and Robotics to Create New Growth Frontiers
The rapid development of autonomous systems presents substantial opportunities for Near IR camera adoption across transportation and robotics sectors. Autonomous vehicle manufacturers increasingly incorporate NIR cameras for night vision and adverse weather operation, with the global autonomous vehicle market projected to exceed 500 billion by 2030. These applications require robust imaging capabilities in low-light conditions where NIR technology provides significant advantages over visible light systems. Similarly, industrial and service robots utilize NIR vision for navigation and object recognition in variable lighting conditions. The integration of NIR cameras with LiDAR and other sensing technologies creates comprehensive perception systems that enable reliable autonomous operation across diverse environments.
Expansion in Agricultural Technology and Food Processing to Open New Market Segments
Precision agriculture and automated food processing represent growing opportunities for NIR camera applications through quality assessment and process optimization. Agricultural technology investments have increased by over 20% annually, driven by the need for improved crop yield and sustainable farming practices. NIR cameras enable non-destructive quality assessment of crops, soil analysis, and plant health monitoring through spectral analysis capabilities. In food processing, these cameras facilitate automated sorting based on internal quality characteristics invisible to conventional imaging. The ability to detect moisture content, sugar levels, and internal defects makes NIR technology invaluable in quality control applications across the food supply chain.
Development of Miniaturized and Multi-Spectral Systems to Enable New Applications
Technological advancements in sensor miniaturization and multi-spectral imaging create opportunities for NIR cameras in portable devices and specialized applications. The development of compact NIR sensors enables integration into smartphones, wearable devices, and portable medical instruments, expanding market potential beyond traditional industrial applications. Multi-spectral imaging systems that combine NIR with other wavelengths provide enhanced analytical capabilities for scientific research and material analysis. These developments particularly benefit field applications in agriculture, environmental monitoring, and emergency services where portable, multi-functional imaging solutions provide significant advantages over traditional laboratory equipment.
➤ For instance, recent innovations in smartphone-integrated NIR sensors have enabled consumers to assess food freshness and product authenticity, creating entirely new consumer market segments.
Furthermore, the convergence of NIR imaging with artificial intelligence and cloud computing enables remote monitoring and automated analysis capabilities that expand application possibilities across multiple industries.
NEAR IR CAMERA MARKET TRENDS
Integration with Artificial Intelligence and Machine Vision to Emerge as a Dominant Trend
The integration of Near IR cameras with Artificial Intelligence (AI) and advanced machine vision systems represents a transformative trend, significantly enhancing automation and analytical capabilities across multiple sectors. While traditional machine vision relied heavily on visible light, the adoption of NIR imaging allows systems to see beyond human visual perception, capturing details invisible under normal conditions. This capability is critical in quality control processes, particularly in food and pharmaceutical manufacturing, where internal defects or contamination can be detected without damaging products. The global machine vision market, which heavily incorporates NIR technology, is experiencing robust growth, further propelling demand. This synergy is creating smarter, more efficient industrial systems capable of operating in varied lighting conditions and delivering higher precision, thereby expanding the application scope and value proposition of Near IR cameras.
Other Trends
Expansion in Automotive and Transportation Safety Systems
The automotive industry’s rapid advancement towards autonomous and semi-autonomous vehicles is a major catalyst for Near IR camera adoption. These cameras are integral to night vision systems, driver monitoring systems (DMS), and LiDAR, providing critical data for advanced driver-assistance systems (ADAS). Their ability to function effectively in low-light and adverse weather conditions, such as fog or rain, where visible light cameras fail, makes them indispensable for enhancing road safety. The proliferation of government regulations mandating safety features and the consumer demand for higher vehicle safety ratings are accelerating this integration. This trend is not limited to passenger vehicles but is also gaining significant traction in commercial transportation and logistics, ensuring safer operation around the clock.
Growing Demand in Security and Surveillance Applications
There is a substantial and growing deployment of Near IR cameras in the security and surveillance sector, driven by the need for 24/7 monitoring capabilities. Unlike standard cameras that require additional, often cumbersome, white light illumination for night operation, NIR cameras provide covert surveillance by using invisible infrared illumination. This feature is crucial for perimeter protection, critical infrastructure monitoring, and urban security, where unobtrusive operation is a priority. The global focus on enhancing public safety and securing assets, combined with technological advancements that have reduced the cost of IR-sensitive sensors, is making this technology more accessible. Furthermore, the integration of these cameras with video analytics software is creating intelligent surveillance systems capable of proactive threat detection, fueling further market expansion in this vertical.
COMPETITIVE LANDSCAPE
Key Industry Players
Technological Innovation and Strategic Expansions Drive Market Leadership
The global Near IR Camera market exhibits a semi-consolidated structure, characterized by a dynamic mix of established multinational corporations and specialized niche players. FLIR Systems, now part of Teledyne Technologies, continues to be a dominant force, leveraging its extensive product portfolio and robust distribution network across North America, Europe, and Asia-Pacific. The company’s leadership is reinforced by its continuous investment in high-sensitivity sensors and cooling technologies, which are critical for advanced applications in scientific research and defense.
Allied Vision Technologies and Basler AG have also secured significant market shares, driven by their strong focus on industrial machine vision applications. These companies benefit from the increasing automation across manufacturing sectors, where Near IR cameras are essential for quality control and precision measurement. Their growth is further propelled by strategic partnerships with system integrators and OEMs, expanding their reach into emerging economies.
Meanwhile, JAI and IDS Imaging Development Systems are strengthening their positions through relentless innovation in CMOS and CCD sensor technology. Both companies have recently launched cameras with enhanced quantum efficiency in the NIR spectrum, addressing the growing demand for high-speed imaging in automotive safety and biomedical fields. Their expansion into Asia, particularly in Japan and China, aligns with the region’s rapid industrial and technological advancements.
Additionally, players like Xenics and Photonfocus are carving out significant niches by specializing in customized solutions for hyperspectral imaging and low-light conditions. These companies compete through technological differentiation, offering unique value propositions in sectors such as agriculture, pharmaceuticals, and environmental monitoring. Their focused R&D efforts and agile response to client-specific requirements ensure a steady growth trajectory within the competitive ecosystem.
List of Key Near IR Camera Companies Profiled
- FLIR Systems (Teledyne FLIR) (U.S.)
- Allied Vision Technologies GmbH (Germany)
- Basler AG (Germany)
- JAI A/S (Denmark)
- IDS Imaging Development Systems GmbH (Germany)
- HORIBA Scientific (Japan)
- Lumenera Corporation (Canada)
- QImaging (Canada)
- Xenics NV (Belgium)
- Photonfocus AG (Switzerland)
- Infrared Cameras Inc. (U.S.)
Segment Analysis:
By Type
CCD Segment Commands the Market Due to Superior Image Quality and High Sensitivity in Low-Light Conditions
The market is segmented based on type into:
- CCD
- CMOS
- Others
By Application
Measurement & Detection Segment Leads Due to Critical Role in Quality Control and Non-Destructive Testing
The market is segmented based on application into:
- Industry
- Measurement & Detection
- Others
By End-User Industry
Industrial Manufacturing Holds a Prominent Position Fueled by Automation and Machine Vision Integration
The market is segmented based on end-user industry into:
- Industrial Manufacturing
- Scientific & Medical Research
- Security & Surveillance
- Transportation
- Others
By Wavelength Range
Standard NIR Range (700-1000 nm) is Predominant Owing to Widespread Component Availability and Application Versatility
The market is segmented based on wavelength range into:
- Standard NIR (700-1000 nm)
- Extended NIR (1000-1700 nm)
- Short-Wave Infrared (SWIR)
Regional Analysis: Near IR Camera Market
North America
North America is the largest and most mature market for Near IR cameras, holding over 35% of the global market share. The United States is the primary driver, fueled by significant defense and aerospace spending, robust industrial automation, and advanced medical imaging research. The region’s strong emphasis on security and surveillance, particularly for border control and critical infrastructure protection, further propels demand. Major technology firms and research institutions continuously invest in R&D for machine vision and scientific applications, creating a steady stream of high-value orders. While the market is well-established, growth is sustained by the adoption of these cameras in emerging sectors like autonomous vehicles and advanced agricultural monitoring. The presence of key global players like FLIR Systems also solidifies the region’s technological leadership and supply chain strength.
Europe
Europe represents a highly advanced and innovation-driven market for Near IR cameras, closely following North America in market share. The region’s strength lies in its sophisticated manufacturing sector, particularly in automotive (for driver assistance systems and quality control) and industrial automation. Strict regulations and high-quality standards in sectors like pharmaceuticals and food processing necessitate the use of precise inspection technologies, which Near IR cameras provide. Furthermore, significant government and private funding for scientific research, especially in physics and life sciences labs across Germany, the UK, and France, creates substantial demand for high-performance imaging systems. The market is characterized by a strong preference for cutting-edge, reliable technology, with local manufacturers like IDS Imaging Development Systems and Allied Vision Technologies being major contributors.
Asia-Pacific
The Asia-Pacific region is the fastest-growing market for Near IR cameras, driven by massive industrial expansion, particularly in China, Japan, and South Korea. China’s dominance in electronics manufacturing creates immense demand for machine vision systems used in quality inspection and assembly line automation. Japan and South Korea are global leaders in consumer electronics and automotive production, further integrating these cameras into their advanced manufacturing processes. While cost sensitivity can be a factor, there is a clear and accelerating shift towards adopting higher-end imaging solutions to improve product quality and operational efficiency. The region is also a major hub for the production of camera components, influencing supply chains and manufacturing costs. This combination of high-volume consumption and expanding industrial applications positions Asia-Pacific for continued explosive growth.
South America
The Near IR camera market in South America is emerging but faces challenges due to economic volatility and lower levels of industrial automation compared to other regions. Growth is primarily driven by specific applications in mining and agriculture, where these cameras are used for ore sorting and crop health monitoring, respectively. Brazil and Argentina show the most potential, with their sizable agricultural and industrial bases. However, widespread adoption is hindered by budgetary constraints, a reliance on imported technology, and less mature local manufacturing and support ecosystems. The market is therefore characterized by niche, high-value applications rather than broad-based industrial use, with growth being gradual and dependent on economic stability and increased foreign investment in technology infrastructure.
Middle East & Africa
The market in the Middle East & Africa is nascent and developing unevenly. Demand is primarily concentrated in the oil and gas sector, where Near IR cameras are used for pipeline inspection and flare monitoring, and in security and surveillance applications driven by government initiatives in more affluent Gulf nations like Saudi Arabia and the UAE. South Africa shows some activity in mining applications. However, the broader market’s development is constrained by limited industrial diversification, technological infrastructure gaps, and funding priorities focused on basic infrastructure over advanced automation. While long-term potential exists as economies diversify and modernize, current market penetration remains low, with growth occurring in specific, high-value projects rather than widespread adoption.
Report Scope
This market research report provides a comprehensive analysis of the global and regional Near IR Camera markets, covering the forecast period 2025–2032. It offers detailed insights into market dynamics, technological advancements, competitive landscape, and key trends shaping the industry.
Key focus areas of the report include:
- Market Size & Forecast: Historical data and future projections for revenue, unit shipments, and market value across major regions and segments.
- Segmentation Analysis: Detailed breakdown by product type, technology, application, and end-user industry to identify high-growth segments and investment opportunities.
- Regional Outlook: Insights into market performance across North America, Europe, Asia-Pacific, Latin America, and the Middle East & Africa, including country-level analysis where relevant.
- Competitive Landscape: Profiles of leading market participants, including their product offerings, R&D focus, manufacturing capacity, pricing strategies, and recent developments such as mergers, acquisitions, and partnerships.
- Technology Trends & Innovation: Assessment of emerging technologies, integration of AI/IoT, semiconductor design trends, fabrication techniques, and evolving industry standards.
- Market Drivers & Restraints: Evaluation of factors driving market growth along with challenges, supply chain constraints, regulatory issues, and market-entry barriers.
- Stakeholder Analysis: Insights for component suppliers, OEMs, system integrators, investors, and policymakers regarding the evolving ecosystem and strategic opportunities.
Primary and secondary research methods are employed, including interviews with industry experts, data from verified sources, and real-time market intelligence to ensure the accuracy and reliability of the insights presented.
FREQUENTLY ASKED QUESTIONS:
What is the current market size of Global Near IR Camera Market?
-> Near IR Camera Market was valued at 901 million in 2024 and is projected to reach US$ 1516 million by 2032, at a CAGR of 7.9% during the forecast period.
Which key companies operate in Global Near IR Camera Market?
-> Key players include JAI, FLIR Systems, Allied Vision Technologies, IDS Imaging Development Systems, and Basler, among others.
What are the key growth drivers?
-> Key growth drivers include increasing adoption in machine vision applications, demand for high-speed imaging in industrial automation, and expansion of scientific and medical imaging applications.
Which region dominates the market?
-> North America is the largest market with over 35% share, while Asia-Pacific is experiencing rapid growth.
What are the emerging trends?
-> Emerging trends include integration of AI-powered image processing, development of higher resolution sensors, and increasing adoption of CMOS technology over CCD.

Get Sample Report PDF for Exclusive Insights
Report Sample Includes
- Table of Contents
- List of Tables & Figures
- Charts, Research Methodology, and more...
 Download Sample Report PDF