SEMICONDUCTOR INSIGHT
MARKET RESEARCH REPORT

GaAs Semiconductor Material Market

2026 to 2034
MARKET INTELLIGENCE
ACROSS KEY REGIONS
2026 EDITION
ELECTRONIC COMPONENTS Semiconductor Market Research

GaAs Semiconductor Material Market

Global Outlook and Forecast 2026–2036

◷
UPDATED 21 October 2026
▤
REPORT LENGTH Detailed Report
▣
REPORT CODE da6195dcf9d1
▯
FORMATS PDF

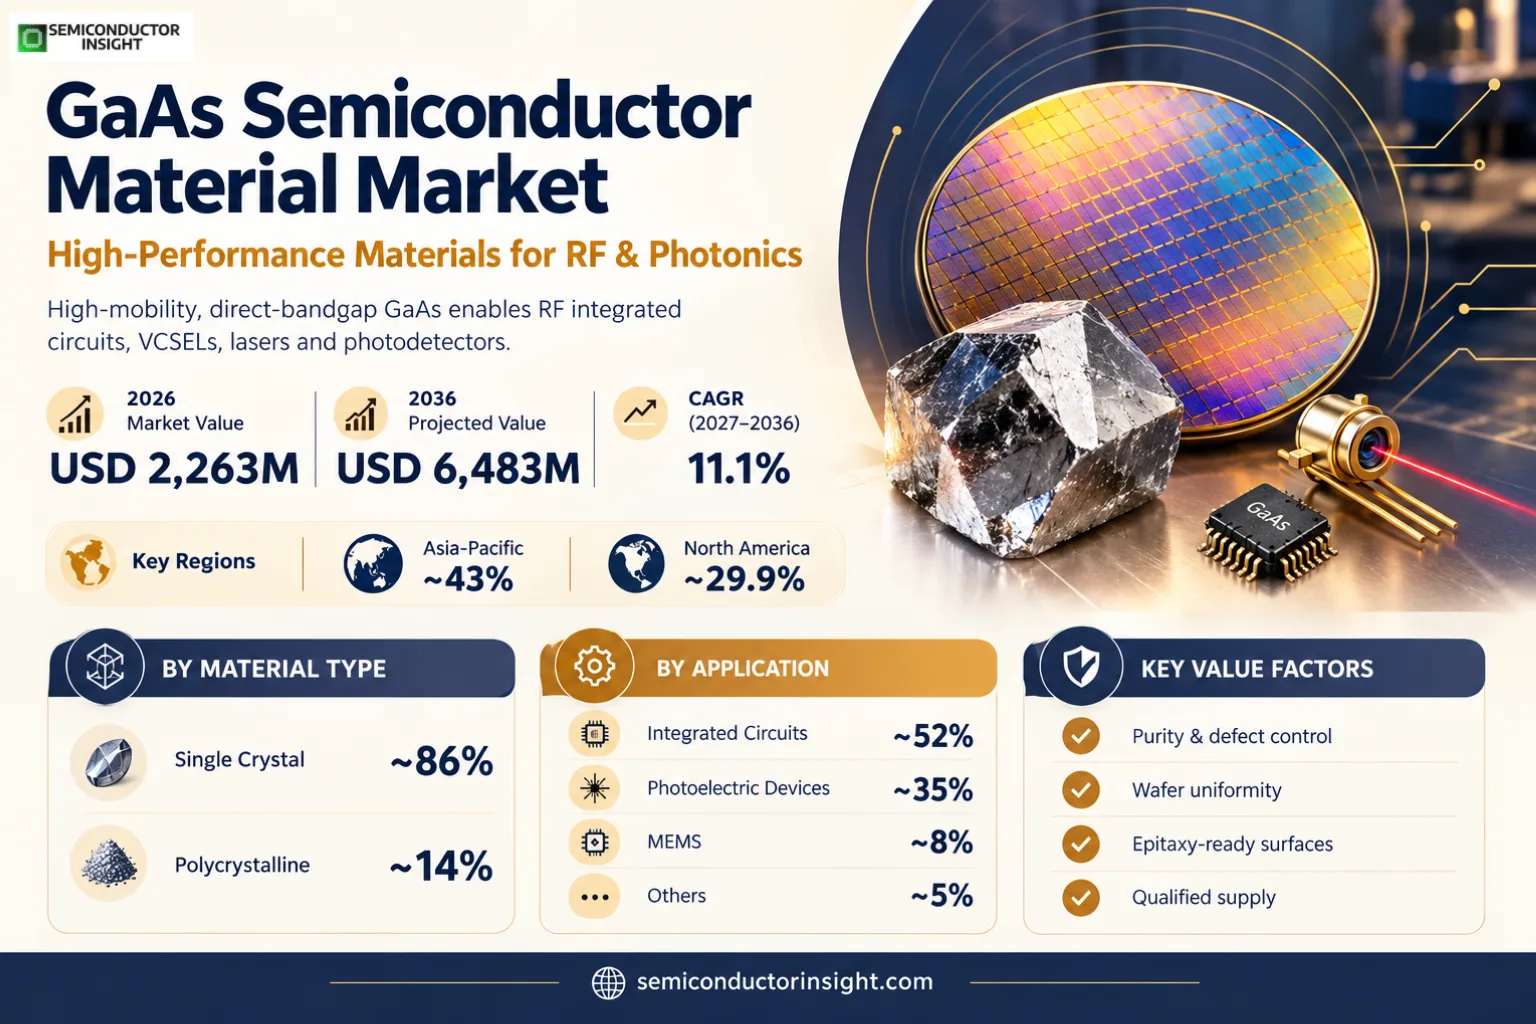
The  GaAs semiconductor material market was valued at USD 2,263 million in 2026 and is projected to reach USD 6,483 million by 2036, expanding at a CAGR of 11.1% during 2027–2036. Asia-Pacific is the largest consuming and manufacturing region with an estimated ~43% of 2026 market revenue, followed by North America at ~29.9%.

Get the sample PDF with study scope, segmentation and methodology details.

Key Statistics

2026 Market Size
USD 2,263 million
2036 Projected Size
USD 6,483 million
CAGR (2027–2036)
11.1%
Largest Market in 2026
Asia-Pacific (~43%)

Key Takeaways

  • Market trajectory: GaAs material revenue is modeled at USD 2,263 million for 2026 and USD 6,483 million for 2036, representing 11.1% annual growth across the ten-year window. The market encompasses semiconductor-grade gallium arsenide materials supplied before fabrication into RF or photonic devices.
  • Single-crystal dominance: Epi-ready and polished single-crystal substrates account for an estimated ~86% of 2026 revenue, reflecting stringent crystalline-defect, resistivity and surface-flatness requirements in RF and optoelectronic wafer production.
  • Integrated-circuit applications: Integrated circuits represent an estimated ~52% of material demand in 2026, supported by 150 mm GaAs wafers used for heterojunction bipolar transistors and pseudomorphic high-electron-mobility transistors in wireless front ends.
  • Regional concentration: Asia-Pacific leads with an estimated ~43% share in 2026 as Chinese, Japanese and Taiwanese wafer manufacturers and epitaxial fabs support RF and laser supply chains; North America contributes ~29.9% under the regional benchmark.
  • Supply constraints: Crystal-growth yield, 100–200 mm wafer availability, arsenic-handling controls, customer-specific doping specifications and qualified epitaxy interfaces determine whether additional output can enter commercial device programmes.

GaAs Semiconductor Material Market Overview

The  GaAs semiconductor material market was valued at USD 2,263 million in 2026 and is projected to reach USD 6,483 million by 2036, expanding at a CAGR of 11.1% during 2027–2036. Asia-Pacific is the largest consuming and manufacturing region with an estimated ~43% of 2026 market revenue, followed by North America at ~29.9%.

Base year: 2026 · Estimate: 2027 · Forecast: 2027–2036 · Historical benchmark: 2023 · Monetary unit: USD million

Gallium arsenide is a III–V compound semiconductor whose high electron mobility and direct bandgap make it valuable where silicon alone cannot meet the performance requirements of microwave amplification, near-infrared light generation or sensitive photodetection. Commercial material suppliers offer high-purity polycrystalline feedstock, single-crystal ingots, polished wafers and epitaxy-ready surfaces. The revenue boundary used here counts a material sale once, rather than adding every transfer between adjacent processing stages.

The market distinguishes semi-insulating GaAs substrates for high-frequency integrated circuits from semiconducting wafers doped with silicon or zinc for optical emitters. Freiberger Compound Materials publishes 100, 150 and 200 mm wafer specifications covering resistivity, dislocation density, polishing and growth method, while DOWA lists 2-inch and 4-inch GaAs grades for laser and LED applications. The specifications illustrate why two wafers of identical diameter can command substantially different selling prices.

The global monetary series starts from USD 1,650 million in 2023 and extends to USD 4,255.11 million in 2032, a compound annual rate of 11.10% across nine annual intervals. Translating that series to a common 2026 base produces the forecast shown here. North American 2023 material revenue of USD 515.65 million implies 31.25% of that historical global total, while the regional growth benchmark of 9.51% supports a lower estimated 2026 regional weight.

Integrated circuits, including pHEMT, HBT and related RF architectures, are the largest demand destination, with an estimated ~52% of 2026 material revenue. Photoelectric devices such as VCSELs, edge-emitting laser diodes, LEDs and detectors represent an estimated ~35%, followed by MEMS-related structures at ~8% and specialized applications at ~5%. These shares describe material value by end use and do not include downstream semiconductor die or finished RF modules.

IQE supplies GaAs epitaxial structures for RF and photonics, including 850, 940 and 1,060 nm VCSEL designs, and its April 2024 agreement with AWSC addresses GaAs wafers for Android smartphone power amplifiers. Its September 2026 agreement with Quintessent covers 6-inch GaAs quantum-dot laser epiwafers moving toward customer sampling. Both developments indicate diversification of wafer requirements beyond conventional handset power amplifiers, although their announced contract values cannot be equated with global material revenue.

Production economics are shaped by the transition from polycrystalline synthesis through VGF or LEC single-crystal growth, sawing, lapping, chemical polishing and epitaxial qualification. A defect detected after final polishing destroys more accumulated value than one caught at ingot inspection. Yield, uniformity, trace-metal control and customer requalification therefore matter more to realized supplier revenue than the nominal number of installed crystal pullers or the headline growth rate of adjacent finished-device markets.

Segment Analysis: By Type

By type, GaAs semiconductor materials are segmented into Single Crystal and Polycrystalline products. Single-crystal material is estimated to generate ~86% of 2026 revenue because device makers purchase precision substrates with tightly specified resistivity and epi-ready surfaces. Polycrystalline material contributes ~14% as a precursor for crystal growth and certain specialist supply chains, rather than as a finished RF or optical device substrate.

Material type Technical boundary Commercial position
Single Crystal Includes bulk GaAs crystals converted into epi-ready or polished substrates, commonly 75, 100, 150 and 200 mm in diameter. The product is qualified by orientation, bow, warp, total thickness variation, defect density and dopant distribution; semi-insulating grades support HBT and pHEMT processing while conductive grades support laser and LED epitaxy. Largest category at an estimated ~86% of 2026 revenue. Wafer surface preparation and stringent defect limits increase value relative to bulk polycrystalline feedstock. Supplier differentiation follows low-dislocation yield, uniform resistivity, diameter capability and long-term device-fab qualifications rather than simply the availability of gallium and arsenic inputs. The distinction matters when an upstream substrate is transferred to an epitaxial supplier: only the chosen external transaction is included, while the finished semiconductor component remains a downstream sale outside this market boundary.
Polycrystalline High-purity gallium and arsenic are reacted to form polycrystalline GaAs before controlled remelting and single-crystal growth. Some producers sell material as feedstock to other crystal growers, while integrated producers consume their own feedstock internally. Only external sales are included, preventing the same kilogram from being valued first as polycrystal and again as a finished substrate. Estimated ~14% share in 2026 with more exposure to purity certification and conversion costs than to final wafer pricing. A polycrystalline sale is a different commercial transaction from an internally transferred charge; the latter must be excluded when constructing an independent revenue estimate to avoid inflating market totals. Purchasing specifications can vary by crystal orientation, defect density, resistivity and surface finish, so buyers compare qualified material performance and supply continuity rather than assuming all gallium arsenide wafers are interchangeable.

Single-crystal GaAs substrates

Semi-insulating grades target high-frequency integrated circuits because substrate isolation limits parasitic coupling between neighboring RF devices. Freiberger specifies high-resistivity wafers in several diameters, and AXT distinguishes semi-insulating and semiconducting product families in its securities filing. Device fabs assess wafer flatness, crystal orientation and 150 mm compatibility before committing production masks, so supplier switching can require multiple process and reliability cycles.

Semiconducting grades serve laser, LED and detector epitaxy where controlled conductivity is required. DOWA lists GaAs wafers produced using VGF and LEC processes, while Sumitomo Electric and Vital Materials document optical and wireless substrate offerings. Commercial acceptance depends on low defect density across each wafer, especially when high-value 940 nm VCSEL arrays or 850 nm optical emitters are fabricated at scale.

Polycrystalline precursor materials

Polycrystalline GaAs is the chemical bridge between elemental feedstocks and single-crystal substrates. Freiberger describes synthesis under pressure before crystal pulling, followed by mechanical wafering and final surface preparation. External precursor sales are exposed to input purity, arsenic containment, melt chemistry and downstream yield, while captive precursor consumption within an integrated plant is treated as an internal production step rather than an additional market sale.

Segment Analysis: By Application

Application segmentation comprises Integrated Circuits, MEMS, Photoelectric Devices and Others, matching the underlying product taxonomy. Integrated circuits lead at an estimated ~52% of 2026 material value; photoelectric devices account for ~35%, MEMS ~8% and other specialist uses ~5%. A wafer supplied for a single end-device programme is assigned to one end use even when the final product combines radio-frequency and optical functions.

Application Demand characteristics
Integrated Circuits An estimated ~52% of 2026 material demand is associated with GaAs HBT, pHEMT, BiFET and related RF fabrication. Semi-insulating substrates are especially important for mobile front ends, wireless infrastructure, microwave systems and selected satellite applications. IQE and Freiberger describe the epitaxial and bulk material requirements, while AWSC supply arrangements show how substrate qualification links material vendors to handset RF supply chains.
Photoelectric Device An estimated ~35% of 2026 revenue supports VCSEL arrays, edge-emitting lasers, photodetectors, LEDs and optical interconnect devices. Semiconducting substrate grades and controlled epitaxial stacks determine emission wavelength, electrical efficiency and reliability. IQE documents 850, 940 and 1,060 nm VCSEL structures, and its 2026 Quintessent programme extends GaAs epitaxy toward quantum-dot lasers for optical connectivity.
MEMS An estimated ~8% of 2026 material revenue is attributed to specialized microelectromechanical and micro-optoelectromechanical structures where GaAs provides optical or high-frequency functions. This remains smaller than mainstream RF and laser demand because most mass-produced inertial and pressure sensors rely on silicon. The relevant GaAs demand is concentrated in research-to-production transitions, optical switching and high-frequency microsystems requiring compound-semiconductor integration.
Others An estimated ~5% of 2026 material demand includes specialized research wafers, aerospace and defense programmes, photovoltaic research and niche optoelectronic platforms that cannot be allocated to the three principal applications. Material revenue is recognized at the wafer or external precursor sale, not at the value of finished satellites, optical instruments or laboratory equipment. Qualification often emphasizes traceability and unusually strict defect specifications.

RF and photonic demand use different GaAs grades, so a broad statement that smartphone shipments alone determine the market would miss important shifts in the material mix. IQE reported a 2025 photonics revenue increase even as wireless revenue declined, demonstrating divergent downstream cycles within one supplier. That company-level performance is not a market-share measurement, but it supports separate growth assumptions for optical and radio-frequency applications.

The modeled application mix is sensitive to whether an epitaxial supplier invoices a complete GaAs epiwafer or a bulk substrate vendor invoices an unprocessed wafer. When the epiwafer includes a purchased substrate, the model counts the final external material sale at the selected revenue boundary and does not add the embedded substrate transfer again. This distinction is necessary when comparing the offerings of IQE, DOWA, Freiberger and Sumitomo-affiliated companies.
GaAs Semiconductor Material Market, Global Outlook and Forecast 2026–2036

Regional Analysis

Regional demand reflects both the location of wafer production and the location of the customer that purchases the material. Asia-Pacific leads with ~43% of 2026 revenue, North America follows at ~29.9%, Europe contributes ~18%, the Middle East and Africa ~5%, and South America ~4.1%. These estimated allocations are reconciled to the global base and distinguish wafer sales from downstream RF, laser and device revenue.

Where are GaAs semiconductor materials manufactured and consumed?

Asia-Pacific combines major compound-semiconductor material suppliers with RF foundries and optical-device manufacturers. North America contributes substantial specialized device demand, while Europe retains crystal-growth and epitaxial technology capabilities. A supplier’s corporate headquarters does not necessarily determine the regional allocation: the relevant measure is where material revenue is recognized for the customer transaction, adjusted consistently for cross-border wafer movements and intermediate processing.

The regional growth assumptions reflect different demand mixes. Asia-Pacific is modeled at ~12.3% CAGR because of its large RF and photonic manufacturing ecosystem, North America at ~9.5% against its published regional benchmark, Europe at ~10.3%, South America at ~11.3%, and Middle East and Africa at ~11.8%. These are scenario-based material revenue trajectories, not audited regional sales reports.

Region Position Growth outlook Demand profile What decides supplier selection
Asia-Pacific Largest ~12.3% CAGR through 2036 RF and photonics fabrication 200 mm qualification
North America Second-largest ~9.5% CAGR through 2036 RF design and specialty photonics Traceability and security
Europe Third-largest ~10.3% CAGR through 2036 Crystal growth and epiwafers Flatness and defect density
South America Smaller ~11.3% CAGR through 2036 Specialist RF and research Import logistics
Middle East & Africa Emerging ~11.8% CAGR through 2036 Defense and optical R&D Qualified supply access

Asia-Pacific ~43% SHARE · LARGEST MARKET

Why does Asia-Pacific lead GaAs material demand?

Asia-Pacific represents an estimated ~43% of 2026 GaAs material revenue because Japan, China and Taiwan combine wafer supply, epitaxial processing and large downstream RF and optical device ecosystems. DOWA, Sumitomo-affiliated producers and Vital Materials document regional material capabilities, while IQE supplies Asian RF partners. Demand is concentrated in 100–150 mm established programmes, with 200 mm expansion subject to defect and yield qualification.

Market positionLargest (~43% share)
Growth outlook~12.3% CAGR
Demand profileRF and photonics fabrication
Market access gate200 mm qualification
Country Position in region What drives demand
China Large and expanding Chinese wafer and compound-semiconductor manufacturers supply RF and optical fabrication ecosystems with semi-insulating and doped GaAs substrates. Vital Materials lists 2–8 inch GaAs offerings, showing the breadth of diameter capability advertised to customers. Demand growth is supported by smartphone RF content, sensing emitters and optical components, but equipment nameplate capacity must not be interpreted as saleable wafer output without considering yields and customer acceptance.
Japan High-purity supplier base DOWA Electronics Materials lists VGF and LEC GaAs substrates in 2-inch and 4-inch classes for optical devices, while Sumitomo-affiliated businesses manufacture GaAs and InP substrate families. Japan remains important for high-purity materials and specialized photonics qualifications. Sales are influenced by reliability demands, defect density and long customer qualification periods rather than by headline smartphone unit production alone.
Taiwan and South Korea Device-fab ecosystem Taiwanese compound-semiconductor foundries and epitaxial partners support GaAs RF power-amplifier and photonics production. IQE announced an expanded multi-year GaAs wafer arrangement with AWSC in April 2024 for the Android ecosystem, providing a concrete regional demand channel. South Korean electronics and display suppliers add optical sensing and emitter demand, although their finished-device sales are excluded from this upstream material market.

Market instances

  • IQE–AWSC supply agreement On 10 April 2024, IQE announced a multi-year arrangement to supply GaAs wafers to AWSC for smartphone power amplifiers associated with Lansus and Chinese Android manufacturers. The commercial significance is a qualified epitaxial supply channel into Asian RF fabs, not a public disclosure of regional wafer revenue. This reinforces the integrated-circuit share of demand and the importance of customer-specific epitaxy qualifications.
  • DOWA wafer portfolio DOWA Electronics Materials lists GaAs substrate grades made using VGF and LEC growth, including products for laser and LED applications. The published 2-inch and 4-inch formats demonstrate that smaller-diameter, high-quality optical wafers remain commercially relevant alongside 150 mm RF substrates. The significance for regional sourcing is diversification of crystal growth methods and device-specific dopant specifications.
  • Vital Materials substrate range Vital Materials advertises GaAs substrates from 2 to 8 inches, including semi-insulating and doped options, indicating a broad technical offering for both RF and optical customers. The diameter range is a capability statement rather than proof of mass-market 200 mm shipments. Commercial impact depends on customer qualifications, surface finishing, and realized usable-wafer yields across the larger diameter grades.
In the full report: Country-level GaAs substrate and polycrystalline-material consumption, device-fab demand and qualification cycles across Asia-Pacific, with sensitivity to 100 mm, 150 mm and 200 mm wafer adoption and end-use allocation.

North America ~29.9% SHARE · RF AND DEFENSE

What sustains North American GaAs substrate consumption?

North America contributes an estimated ~29.9% of 2026 revenue, supported by RF component engineering, aerospace applications and photonics programmes. The published 2023 regional value of USD 515.65 million provides an independent monetary benchmark, while 9.51% regional growth implies a slightly declining global weight as Asian demand accelerates. AXT filings and IQE customer programmes show the relevance of qualified substrate and epitaxial suppliers to US device chains.

Market positionSecond-largest (~29.9% share)
Growth outlook~9.5% CAGR
Demand profileRF design and specialty photonics
Market access gateTraceability and security
Country Position in region What drives demand
United States Principal market US-based RF, defense and optical-system designers require high-resistivity GaAs substrates for power-amplifier circuits and specialized optical wafers for sensing. AXT securities disclosures distinguish semi-insulating and semiconducting substrate families and explain customer qualification risks. Demand is less directly linked to local smartphone assembly than to the value of specialized device programmes, defense traceability requirements and compound-semiconductor research infrastructure.
Canada Research and specialist demand Canadian research institutions and photonics development teams represent a smaller but technically demanding customer base for GaAs wafers. Purchases often involve 50–100 mm formats, experimental epitaxial structures and high-quality polished surfaces rather than high-volume commodity shipments. The regional commercial effect is a premium on supplier responsiveness, material characterization and small-lot traceability, with modest absolute volumes relative to US device production.
Mexico Indirect electronics demand Mexico contributes mainly through North American electronics integration and industrial supply chains rather than a large domestic GaAs crystal-growth industry. Material demand is typically embedded in RF and optical components supplied from US or Asian fabrication plants, so allocating finished-device imports to Mexican substrate revenue would overstate the local material market. Procurement remains sensitive to cross-border qualification, customs treatment and established supplier contracts.

Market instances

  • AXT product disclosures AXT’s 2024 Form 10-K identifies semi-insulating and semiconducting GaAs substrates and distinguishes wafer sales from raw-material operations. The filing provides a first-party basis for separating the substrate market from upstream elemental gallium and arsenic transactions. It also indicates why consolidated company revenue cannot be assigned entirely to GaAs, because the supplier serves additional compound-semiconductor material categories.
  • US photonics programmes IQE describes GaAs epitaxy for 850, 940 and 1,060 nm VCSEL structures used in optical communications and sensing. North American design programmes increasingly demand application-specific epitaxial stacks and stable device yield rather than generic polished wafers. The market implication is higher qualification intensity and potential product-mix gains even when aggregate handset RF demand is cyclical.
  • Quintessent sampling IQE announced in September 2026 that it would supply 6-inch GaAs quantum-dot laser epiwafers to Quintessent as the latter moved toward customer sampling. The US photonics connection illustrates an emerging material route for AI optical links. Sampling is an early commercial stage, so the announcement supports a technology trajectory but not an assumption of immediate high-volume substrate revenue.
In the full report: Country-level GaAs substrate and polycrystalline-material consumption, device-fab demand and qualification cycles across North America, with sensitivity to 100 mm, 150 mm and 200 mm wafer adoption and end-use allocation.

Europe ~18% SHARE · SPECIALIST SUBSTRATES

Why is Europe significant in premium GaAs materials?

Europe represents an estimated ~18% of 2026 material revenue, with German crystal-growth expertise and British epitaxial-wafer capability supporting high-value RF and optical applications. Freiberger documents semi-insulating and semiconducting wafers in 100, 150 and 200 mm formats, while IQE provides compound-semiconductor epitaxy across several application families. European purchasing emphasizes process stability, material traceability and qualification for long-lived industrial or optical programmes.

Market positionThird-largest (~18% share)
Growth outlook~10.3% CAGR
Demand profileCrystal growth and epiwafers
Market access gateFlatness and defect density
Country Position in region What drives demand
Germany Substrate manufacturing hub Freiberger Compound Materials describes synthesis, LEC or VGF single-crystal growth, mechanical wafering and final polishing in a vertically controlled GaAs process. Its product specifications cover 3-inch through 200 mm formats, including high-resistivity grades for HBT and pHEMT fabrication. The commercial advantage is close control of crystal defects and epi-ready surface properties, not simply the lowest wafer price per square centimeter.
United Kingdom Epitaxial engineering IQE operates a broad GaAs epitaxial platform for wireless and photonic applications and has announced both RF supply partnerships and 6-inch quantum-dot laser programmes. UK-linked material value is concentrated in epitaxial processing know-how, proprietary stack design and customer qualification. The market boundary must distinguish an epitaxy-added wafer invoice from the purchased underlying substrate to avoid counting the same physical wafer twice.
France and other Europe Industrial photonics demand France and neighboring European markets support specialized photonics, aerospace and sensing programmes that consume GaAs wafers through research and production supply chains. Purchases emphasize traceability, repeatability and compliance with hazardous-material handling standards. European device demand is more diversified than smartphone-only RF applications, which can stabilize small-lot specialty substrate orders during periods of consumer-electronics inventory correction.

Market instances

  • Freiberger 200 mm capability Freiberger publishes 200 mm semi-insulating GaAs wafer specifications alongside 150 mm and 100 mm products, demonstrating that larger diameters are technically available from a specialist European supplier. This is commercially significant because larger wafers can increase die output per processed substrate, but they demand tighter defect-density and bow control. A product listing is not equivalent to audited high-volume customer adoption.
  • IQE GaAs portfolio IQE’s official GaAs materials portfolio includes pHEMT, HBT, PIN, Schottky, VCSEL and red laser/LED epitaxial structures, with wavelengths extending from 850 to 1,060 nm in VCSEL applications. The breadth of offerings gives European epitaxy a role across RF and photonics. It also requires disciplined revenue allocation when one supplier reports consolidated photonics and wireless sales.
  • 2026 GaAs QDL agreement The September 2026 IQE–Quintessent purchase agreement covers 6-inch GaAs quantum-dot laser epiwafers and customer sampling. It shows a concrete European supply role in US-oriented optical interconnect development, with value captured through epitaxial material rather than finished transceivers. The development may support premium substrate specifications, although production scale remains dependent on qualification and end-market adoption.
In the full report: Country-level GaAs substrate and polycrystalline-material consumption, device-fab demand and qualification cycles across Europe, with sensitivity to 100 mm, 150 mm and 200 mm wafer adoption and end-use allocation.

South America ~4.1% SHARE · IMPORT-LED

How does South America participate in the GaAs materials chain?

South America accounts for an estimated ~4.1% of 2026 GaAs material demand and remains heavily dependent on imported high-purity substrates and processed compound-semiconductor wafers. The region has specialized research, defense and communications requirements but a limited base of commercial bulk GaAs crystal growers. Orders therefore reflect project timing, exchange rates, import logistics and availability of small lots rather than a broad domestic 150–200 mm substrate fabrication network.

Market positionSmaller (~4.1% share)
Growth outlook~11.3% CAGR
Demand profileSpecialist RF and research
Market access gateImport logistics
Country Position in region What drives demand
Brazil Principal demand center Brazil is the region’s largest market for compound-semiconductor research and selected RF and photonics applications. Universities, industrial laboratories and communications programmes procure high-purity GaAs wafers for prototyping and specialist production. A 100 mm epi-ready wafer purchased from an overseas supplier contributes to imported material consumption, but the subsequent value of an assembled RF module or optical device is not counted as another GaAs material sale.
Argentina Research-oriented Argentina’s GaAs material use is concentrated in laboratory development, aerospace-linked research and specialized optical or microwave experiments. Demand is typically for modest quantities of well-characterized substrates rather than continuous 150 mm production lots. Currency movements and import lead times influence project schedules, so regional growth may be uneven even if the longer-term technical requirement for compound-semiconductor materials expands.
Chile and Colombia Emerging specialist use Chile and Colombia represent smaller end markets for GaAs wafers, largely through university research, telecommunications laboratories and imported photonic components. The materials supply chain depends on established foreign crystal growers and distributors able to deliver low-defect substrates in modest volumes. Procurement decisions emphasize documentation, customs handling and reliable wafer specifications more than the scale economies associated with Asian RF fabs.

Market instances

  • Import-dependent wafer supply Freiberger and DOWA publish wafer specifications that can be procured internationally, illustrating the supplier-side route available to South American research and device-development buyers. The market effect is a premium on dependable delivery and small-lot customization rather than regional crystal-growth capacity. The published supplier capabilities should not be interpreted as evidence that either company maintains local substrate manufacturing in South America.
  • RF and photonics qualification Specialist GaAs buyers in Brazil and Argentina may require semi-insulating wafers for high-frequency circuit experiments or doped wafers for optical emitters. Supplier technical documentation distinguishes these grades by resistivity and crystal characteristics, so substituting one for another is not a simple purchasing decision. This keeps engineering support and material certification important even in relatively low-volume markets.
  • Pricing and customs sensitivity GaAs wafer pricing depends on diameter, defect density, polishing and dopant specification, while imported supply adds freight, duties and exchange-rate exposure. South American buyers often have less leverage than large Asian fabs to negotiate high-volume terms. Consequently, a shift from 75 mm research wafers to 100 mm or 150 mm qualified production wafers can alter market value disproportionately to unit counts.
In the full report: Country-level GaAs substrate and polycrystalline-material consumption, device-fab demand and qualification cycles across South America, with sensitivity to 100 mm, 150 mm and 200 mm wafer adoption and end-use allocation.

Middle East & Africa ~5% SHARE · EMERGING

What determines GaAs material uptake in the Middle East and Africa?

Middle East and Africa account for an estimated ~5% of 2026 GaAs material demand, concentrated in defense electronics, advanced communications and photonics research. Commercial single-crystal growth remains limited relative to Asia, Europe and North America, making qualified imports important. Demand can expand through industrial diversification and specialized semiconductor programmes, but material orders depend on sustained device development, trained processing capacity and consistent access to high-purity wafers.

Market positionEmerging (~5% share)
Growth outlook~11.8% CAGR
Demand profileDefense and optical R&D
Market access gateQualified supply access
Country Position in region What drives demand
Israel Advanced electronics design Israel’s compound-semiconductor and defense electronics design ecosystem creates demand for specialized high-frequency and optical materials. Many programmes rely on qualified wafers or epiwafers sourced from international suppliers rather than large domestic GaAs crystal-growth operations. Product specifications for semi-insulating and doped substrates determine suitability for radar, sensing and optical applications, while procurement emphasizes reliability and supply continuity.
United Arab Emirates Research investment The United Arab Emirates supports semiconductor, photonics and quantum-related research initiatives that may use GaAs substrates in device prototypes and laboratory processing. Demand is typically project-driven and smaller than the volumes associated with 150 mm RF production lines. Material suppliers compete on documentation, technical support and the ability to supply unusual orientations or small lots within demanding import and handling requirements.
South Africa and Saudi Arabia Selective expansion South Africa and Saudi Arabia contribute through research institutions, defense-linked electronics and industrial diversification programmes. High-purity GaAs wafers are usually imported for specific RF or photonics experiments, with purchases tied to laboratory capability and project funding. Market growth will depend on moving from prototype consumption to qualified recurring production, not on counting broader investments in silicon or power-semiconductor facilities as GaAs demand.

Market instances

  • Defense-grade substrate demand Semi-insulating GaAs wafers are suitable for high-frequency transistor architectures where isolation and microwave performance matter. Suppliers such as Freiberger and AXT document resistivity-controlled product families, providing a technical basis for defense-oriented demand in this region. Actual procurement volumes depend on programme qualification and export requirements, so broad defense spending totals cannot be substituted for GaAs material sales.
  • Photonics research adoption IQE and Sumitomo-affiliated suppliers document GaAs materials used for lasers, photodetectors and sensing platforms. Research institutions in the Middle East and Africa can access these wafer grades for optical development, but specialized handling and epitaxial processing capabilities are prerequisites. This makes the region’s material market sensitive to research infrastructure and qualified technician availability rather than to consumer-device sales alone.
  • Supply-chain localization limits A new semiconductor research facility does not automatically establish local production of GaAs crystals, which requires high-pressure synthesis, controlled single-crystal growth and precision wafer finishing. Freiberger’s four-stage manufacturing description demonstrates the process depth needed. Regional buyers are therefore likely to remain import-dependent through much of the forecast horizon unless dedicated compound-semiconductor materials investment accompanies device-fab development.
In the full report: Country-level GaAs substrate and polycrystalline-material consumption, device-fab demand and qualification cycles across Middle East & Africa, with sensitivity to 100 mm, 150 mm and 200 mm wafer adoption and end-use allocation.

Competitive Landscape

Competition spans integrated crystal growers, specialist polished-wafer suppliers and epitaxial processors, with different degrees of exposure to GaAs versus other compound semiconductors. Freiberger, DOWA, AXT, Sumitomo-affiliated suppliers and Vital Materials publish substrate capabilities; IQE and Sumitomo Chemical document epitaxial offerings. Comparing consolidated company revenue without removing InP, GaN and downstream device businesses would misstate market concentration.

GaAs substrate competition is anchored in material purity, defect density, uniform resistivity and qualification history. Freiberger offers semi-insulating and semiconducting wafers with detailed dimensional specifications; DOWA supports optical-device materials using VGF and LEC growth; and AXT distinguishes substrate sales from raw materials in its SEC filing. These capabilities serve overlapping applications but are not directly interchangeable when a customer has locked its epitaxial process to a specific substrate grade.

Epitaxial competition is structurally different because a supplier may purchase a GaAs substrate and add a proprietary layer stack for RF or photonics. IQE’s product portfolio includes pHEMT, HBT, VCSEL and laser structures, while Sumitomo Chemical markets MOVPE GaAs epitaxial wafers for RF amplifiers and laser diodes. The value of the finished epiwafer includes the embedded substrate, making consistent revenue boundaries essential when comparing participants.

Large diameter capability does not automatically translate into high revenue share. A 200 mm semi-insulating wafer must meet tight bow, warp, dislocation and surface specifications across more area than a 100 mm wafer, and customer device processes require qualification. Suppliers with documented 150 mm or 200 mm catalogues therefore compete on yield and repeatability as much as on wafer diameter, especially for high-value photonics applications.

Tier structure

Tier Companies Basis of competition
Substrate specialists Freiberger Compound Materials; DOWA Electronics Materials; AXT Compete through 75–200 mm wafer capability, dopant and resistivity specifications, dislocation control, polishing yield and established RF or optical device qualifications. Commercial interpretation requires attention to wafer diameter, electrical grade, yield and customer qualification, because nominal capacity or a supplier catalogue does not by itself establish saleable material revenue in the forecast period.
Integrated material groups Sumitomo Electric; Vital Materials Combine crystal-growth, substrate finishing and related compound-semiconductor material portfolios, with customer differentiation based on supply continuity, technical support and specialist wafer grades. Sumitomo-affiliated producers list GaAs and InP substrate operations, whereas Vital Materials documents VGF-grown GaAs wafers in several diameter classes. Buyers must compare exact product grades and manufacturing stages before treating their portfolios as competing like-for-like.
Epitaxial specialists IQE; Sumitomo Chemical Provide GaAs epiwafers and application-specific layer structures for HBT, pHEMT, VCSEL, laser and detector customers; avoid adding purchased substrate revenue twice. IQE lists multiple RF and photonics epitaxial platforms, while Sumitomo Chemical specifies MOVPE wafer products for amplifier and optical-device fabrication. Their differentiated deposition processes create value beyond the underlying polished substrate, requiring a separate competitive assessment.

Key companies profiled

  • AXT
  • Freiberger Compound Materials
  • DOWA Electronics Materials
  • Sumitomo Electric
  • Sumitomo Chemical
  • IQE
  • Vital Materials

Production and Capacity Economics

GaAs material manufacturing is a multi-stage yield process beginning with high-purity gallium and arsenic, continuing through polycrystalline synthesis and controlled crystal growth, and ending with wafering, polishing and device-specific qualification. Freiberger describes four broad stages, and AXT distinguishes material and raw-material revenue lines. The economics are driven by saleable wafer area and specification compliance rather than nominal ingot mass alone.

Polycrystalline synthesis combines gallium and arsenic under carefully controlled conditions because arsenic has high vapor pressure at elevated temperatures. Crystal growers then use processes such as vertical gradient freeze or liquid-encapsulated Czochralski to produce single-crystal ingots. Defects introduced at this stage propagate through later operations, so yield management begins before the ingot is sliced into 75, 100, 150 or 200 mm wafers.

After crystal growth, mechanical slicing, lapping, etching and polishing determine total thickness variation, bow, warp and surface contamination. Freiberger’s product definitions describe these parameters, and device fabs translate them into acceptable epitaxy and lithography windows. Larger wafers can improve potential die output but require stronger process control, so equipment capacity and commercially qualified output should be treated as separate measures.

Semi-insulating substrates require stable high resistivity, while semiconducting grades depend on carefully controlled silicon or zinc doping. The resulting electrical specifications determine whether a wafer can support pHEMT, HBT, laser or LED fabrication. A single wafer diameter may therefore contain several distinct commercial product grades, and average selling prices should not be inferred from the total number of square centimeters shipped.

An epitaxial processor may buy a polished substrate, deposit complex compound-semiconductor layers and sell the finished epiwafer to a device foundry. This creates substantial value but also a double-counting risk when supplier revenue is aggregated. The market boundary used here attributes the sale once at the chosen material stage, while finished RF amplifiers, VCSEL arrays, lasers and transceivers are excluded as downstream semiconductor products.

Market Dynamics and Growth Opportunities

GaAs materials demand is supported by high-frequency RF functions, optical sensing and emerging data-center photonics, but the growth path is moderated by handset inventory cycles, competition from alternative semiconductors and the difficulty of qualifying larger low-defect wafers. The following driver and restraint impacts are directional contributions to the overall material-market trajectory rather than additive forecasts of company revenue.

MARKET DRIVERS

Drivers Impact Analysis*

Driver (~) % impact on CAGR forecast Geographic relevance Impact timeline
RF front-end complexity +3.2 pp Asia-Pacific and North America 2026–2031
VCSEL and optical sensing +2.7 pp Asia-Pacific and Europe 2026–2034
AI optical interconnect materials +1.4 pp Europe and North America 2027–2036

RF device demand and qualified substrate continuity

GaAs HBT and pHEMT platforms remain important in selected handset power amplifiers and microwave devices where isolation and high-frequency performance justify compound-semiconductor materials. IQE’s April 2024 agreement with AWSC demonstrates a specific supply channel into Android RF applications. The estimated ~52% integrated-circuit application share makes RF qualifications a central determinant of wafer orders, although smartphone inventory swings can temporarily reduce purchases.

Optical sensing and photonics

GaAs substrates underpin VCSEL arrays, red laser diodes and other photonic emitters, with product specifications differentiated by dopant, crystal quality and epitaxial design. IQE documents VCSEL epitaxy at 850, 940 and 1,060 nm, while DOWA and Sumitomo-related suppliers offer materials for laser and LED fabrication. Photoelectric devices contribute an estimated ~35% of 2026 material revenue and can diversify demand away from traditional RF cycles.

AI-oriented laser material innovation

IQE’s September 2026 agreement to supply 6-inch GaAs quantum-dot laser epiwafers to Quintessent for customer sampling provides a concrete example of new material architectures for optical interconnects. The announcement supports a growth opportunity for specialized epitaxy and qualified substrates, but it does not demonstrate immediate mass-production revenue. Forecast upside depends on qualification milestones, laser reliability, cost per optical channel and adoption in data-center equipment.

MARKET RESTRAINTS

Restraints Impact Analysis*

Restraint (~) % impact on CAGR forecast Geographic relevance Impact timeline
Substrate qualification time −1.3 pp All major RF and optical fabs 2026–2032
Silicon and GaN substitution −0.9 pp Wireless and power applications 2026–2036
Crystal-growth yield and handling −0.8 pp All supplier regions 2026–2030

Lengthy process and reliability qualification

A new GaAs substrate supplier must meet customer-specific defect density, resistivity, orientation, flatness and trace-metal requirements before production orders become recurring. Freiberger’s specification tables illustrate how many parameters can differ even within one wafer diameter. Qualification extends beyond a catalog listing because device performance and reliability must be demonstrated on the customer’s epitaxial and fabrication process, slowing the commercial benefit of newly installed crystal-growth capacity.

Competing semiconductor platforms

Silicon-based RF, GaN power devices and InP optical technologies compete with GaAs in selected applications, although each material has different physical advantages. IQE markets several compound-semiconductor platforms rather than GaAs alone, reflecting this substitution risk. Market growth therefore depends on applications where GaAs delivers a compelling combination of frequency, optical emission, efficiency and cost, not on a blanket replacement of silicon across electronics.

Yield losses and hazardous-material controls

Arsenic handling, high-pressure synthesis and precision wafer polishing introduce environmental, safety and operating-cost requirements. Freiberger’s production description separates synthesis, crystal growth, mechanical wafering and final finishing, each of which can affect yield. Defect losses late in the process carry substantial embedded cost, making saleable-wafer output a better indicator of economic capacity than the number of ingots grown.

MARKET OPPORTUNITIES

150–200 mm wafer scaling

Larger GaAs substrates can reduce device processing cost per die if crystal quality and fab yield remain high. Freiberger documents 200 mm semi-insulating wafer specifications, while other suppliers list large-diameter substrate capabilities. The opportunity is strongest where a qualified customer can migrate a repeatable RF or optical process, because unqualified wafer diameter alone does not create commercial material revenue or prove a manufacturing cost advantage.

Application-specific epitaxial stacks

Device customers increasingly require epitaxial structures tailored to VCSEL wavelength, RF linearity and optical power efficiency. IQE and Sumitomo Chemical document GaAs epitaxy across these applications, creating opportunities for materials suppliers that can combine low-defect substrates with process-specific layer engineering. The resulting value capture is potentially higher than commodity polished-wafer sales, provided the model excludes any upstream substrate transfer already embedded in the epiwafer invoice.

Supply Chain and Material Qualification

The GaAs materials chain links elemental gallium and arsenic, high-purity polycrystalline synthesis, single-crystal growth, wafer finishing, epitaxy and downstream device fabrication. Commercial transactions occur at several stages, but a market total must avoid counting the same substrate repeatedly as it moves from precursor to polished wafer and then into an epitaxial product.

FeedstockHigh-purity Ga and As inputs, purity verification and controlled chemical synthesis of polycrystalline GaAs.
Crystal growthVGF or LEC ingots with defined electrical resistivity, dopant distribution and dislocation density.
Wafer finishing75–200 mm slicing, lapping, etching, polishing and epi-ready surface inspection.
EpitaxyApplication-specific HBT, pHEMT, VCSEL, LED or detector layers deposited on qualified substrates.
Device fabricationRF power amplifiers, optical emitters, detectors and sensing arrays; finished devices are excluded from material revenue.

Upstream control. Crystal growers require high-purity input chemistry and stable arsenic handling to prevent defects that later reduce wafer yield. Freiberger’s synthesis description provides an example of the conversion from elemental feedstock to polycrystalline material under controlled pressure. A producer consuming its own polycrystal internally should not book an additional external sale, while independent feedstock shipments belong in the polycrystalline segment only when actually invoiced.

Wafer specifications. Customer acceptance depends on measurable wafer parameters including bow, warp, thickness variation, crystal orientation, resistivity and defect density. Freiberger and DOWA provide official technical specifications, demonstrating that wafer quality is multidimensional rather than defined by diameter alone. A 150 mm wafer suitable for an RF HBT process may not be interchangeable with a semiconducting optical-grade wafer used for a VCSEL or LED stack.

Epitaxial value. IQE and Sumitomo Chemical supply engineered GaAs epitaxial wafers, where deposited layers create application-specific electrical and optical functions. The supply chain may contain both a purchased polished substrate and a final epiwafer sale, so the market accounting must allocate that physical wafer once. Otherwise a model could count identical material value at two successive transaction stages and inflate the global total.

Customer integration. RF and optical foundries integrate qualified GaAs materials into device processes that require stable defect, surface and doping characteristics over multiple lots. The April 2024 IQE–AWSC agreement and September 2026 IQE–Quintessent programme show different qualification pathways for established RF power amplifiers and emerging quantum-dot lasers. Commercial growth depends on sustained device yields and recurring orders, not merely on prototype demonstration or a press-release announcement.

Recent Developments

  • 03 Sep 2026 Supply agreement
    IQE announced a purchase agreement with Quintessent for 6-inch GaAs quantum-dot laser epiwafers to support customer sampling of optical interconnect technology. The agreement extends a development relationship and creates a potential path from research-scale structures toward commercial photonics material supply. Its immediate significance is qualification progress, not proof of high-volume global GaAs wafer demand. Source
  • 28 May 2026 Company results
    IQE reported full-year 2025 revenue of £97.3 million, including photonics revenue of £57.1 million and wireless revenue of £40.1 million. The different trajectories of these businesses illustrate how GaAs-related optical and RF demand can diverge. Consolidated company results also include non-GaAs products, so they cannot be used directly as a pure GaAs material market share. Source
  • 24 Jan 2025 Epitaxy scale-up
    IQE and Quintessent announced a quantum-dot laser epitaxial-wafer supply initiative supported by an initial USD 0.5 million purchase order for 2025 delivery. The project concerns GaAs-based quantum-dot structures on 6-inch substrates for optical links. The transaction offers a concrete early-stage materials signal, but the value is not a measure of the wider GaAs substrate market. Source
  • 10 Apr 2024 RF supply
    IQE announced an expanded multi-year partnership with AWSC to provide GaAs wafers for smartphone power-amplifier fabrication serving Lansus and Android device makers. This is an established RF materials application, distinct from emerging laser programmes. The agreement demonstrates how qualified epitaxy suppliers participate in Asian handset supply chains without implying that the contract covers all regional wafer demand. Source
  • 26 Mar 2024 Product expansion
    IQE announced expanded high-speed optical epitaxy offerings including a 1,310 nm quantum-dot laser foundry service available on GaAs and silicon. The development shows the widening role of GaAs epitaxial structures in optical connectivity. Material demand depends on successful device qualification and integration into photonic platforms, so announced technical capability should not be treated as shipped production volume. Source

REPORT SCOPE & SEGMENTATION

Attribute Details
Market definition Semiconductor-grade gallium arsenide materials sold as externally invoiced polycrystalline feedstock, single-crystal polished wafers or epitaxy-ready material; excludes downstream finished RF and optical devices and internal transfers.
2026 Market Size USD 2,263 million
2027 Estimated Size USD 2,514 million
2036 Forecast Size USD 6,483 million
2027–2036 CAGR 11.1%
Largest Regional Market Asia-Pacific (~43% share in 2026)
Largest Type Single Crystal (~86% share in 2026)
Base Year 2026
Estimate Year 2027
Forecast Period 2027–2036
By Type Single Crystal; Polycrystalline
By Application Integrated Circuits; MEMS; Photoelectric Device; Others
By Product Form Epi-ready Wafers; Other Polished Wafers; Polycrystalline Feedstock
By Region Regional shares refer to modeled 2026 material revenue, not downstream semiconductor-device sales.
North AmericaUnited States; Canada; Mexico
EuropeGermany; United Kingdom; France; Italy; Rest of Europe
Asia-PacificChina; Japan; Taiwan; South Korea; India; Rest of Asia-Pacific
South AmericaBrazil; Argentina; Chile; Rest of South America
Middle East & AfricaIsrael; United Arab Emirates; Saudi Arabia; South Africa; Rest of region
Key Companies Profiled AXT; Freiberger Compound Materials; DOWA Electronics Materials; Sumitomo Electric; Sumitomo Chemical; IQE; Vital Materials
Customization Scope Wafer diameter, resistivity grade, dopant, growth method, customer qualification, RF/optical end use and regional consumption analysis; supplier-specific production capacity and material-value chain delineation.

Frequently Asked Questions

How large is the GaAs semiconductor material market in 2026?

The global GaAs semiconductor material market is valued at USD 2,263 million in 2026, based on a consistent material-revenue series. It covers high-purity GaAs precursors and semiconductor-grade wafers before device fabrication. The valuation excludes finished power amplifiers, laser chips, optical modules and internal transfers that would otherwise count the same material more than once.

What is the GaAs material market forecast for 2036?

The market is projected to reach USD 6,483 million by 2036, with a 11.1% compound annual growth rate over the 2027–2036 forecast period. Demand is expected from RF integrated circuits, photonic sensing, laser materials and selected optical interconnect applications. The long-horizon result assumes continuing customer qualification and substrate-yield improvements rather than an automatic conversion of downstream device revenue into material sales.

Which GaAs material type holds the largest market share?

Single-crystal GaAs is the largest type, accounting for an estimated ~86% of 2026 material revenue. Precision substrates are purchased with defined defect density, resistivity, orientation and surface-quality requirements, making them more valuable than polycrystalline precursor material. Polycrystalline feedstock accounts for an estimated ~14%, but captive consumption within an integrated crystal grower is not counted as a separate external sale.

Which application uses the most GaAs material?

Integrated circuits are the largest application, with an estimated ~52% of 2026 GaAs material revenue, particularly for HBT and pHEMT radio-frequency devices. Photoelectric devices contribute ~35%, MEMS ~8% and other specialist uses ~5%. These are modeled material allocations by final use; they should not be confused with the much larger sales value of finished RF components or laser products.

Why is Asia-Pacific the largest GaAs materials region?

Asia-Pacific leads with an estimated ~43% of 2026 revenue because regional wafer producers and RF or optical fabs are closely integrated. Japanese suppliers provide specialized crystal-growth materials, Chinese companies advertise broad substrate diameter ranges, and Taiwanese compound-semiconductor fabs support smartphone RF supply chains. The region’s share reflects modeled material consumption and production relationships rather than total smartphone shipments.

What is the role of GaAs in smartphone RF front ends?

GaAs supports high-frequency power-amplifier and related RF architectures through semi-insulating substrates and carefully designed epitaxial layers. IQE’s April 2024 supply agreement with AWSC illustrates the connection between GaAs wafer suppliers and Android smartphone RF fabrication. Demand depends on radio architecture, content per handset and customer inventory cycles, so unit smartphone growth is not a direct proxy for wafer revenue.

How are semi-insulating and semiconducting GaAs wafers different?

Semi-insulating GaAs provides high electrical resistivity suitable for isolating microwave and RF devices, while semiconducting wafers use controlled dopants for optical emitters and related applications. Freiberger and DOWA publish product specifications that distinguish electrical grades, growth methods and dimensions. Customers must qualify the precise material properties required by their device process, making substitution between grades technically constrained.

What does 200 mm GaAs wafer availability mean for the market?

A 200 mm wafer provides greater potential die area than 100 or 150 mm formats, but economic gains require acceptable defect density, bow, warp and epitaxial yield. Freiberger lists 200 mm semi-insulating GaAs specifications, demonstrating technical availability. That product capability does not establish high-volume market penetration, because device fabs must qualify larger-diameter processes and justify the associated tooling investments.

How should GaAs substrates and epiwafers be counted?

A polished substrate may be sold to an epitaxy provider, which deposits layers and sells an application-specific epiwafer. Counting both full invoice values as independent GaAs material output can double-count the embedded substrate. A consistent revenue boundary must select the external material transaction stage and account for transfers accordingly. Finished transistors, laser chips and optical transceivers are downstream products and remain outside the defined material total.

Which companies supply GaAs semiconductor materials?

Documented suppliers include AXT, Freiberger Compound Materials, DOWA Electronics Materials, Sumitomo Electric-related businesses, Vital Materials, IQE and Sumitomo Chemical. Their roles differ: some grow and polish bulk substrates, while others provide epitaxial structures. Company revenue totals often include InP, GaN, raw materials or downstream activities, so their consolidated sales are not interchangeable with GaAs-only market shares.

Research Sources & Evidence Base
View research sources used for this overview
  1. AXT SEC. 2024 Form 10-K, substrate and raw-material business distinction
  2. AXT. Corporate presentation, GaAs wafer sizes and customer markets
  3. DOWA Electronics Materials. GaAs substrate grades, VGF and LEC optical wafer offerings
  4. DOWA Electronics Materials. Semiconductor materials, portfolio scope and input material distinction
  5. Freiberger Compound Materials. GaAs wafer products, 100–200 mm wafer specifications
  6. Freiberger Compound Materials. III–V substrate portfolio, semi-insulating and semiconducting material grades
  7. Freiberger Compound Materials. Crystal-growth technology, synthesis and wafer-finishing stages
  8. Freiberger Compound Materials. Wireless communication substrates, 150 mm RF HBT and pHEMT applications
  9. Freiberger Compound Materials. Wafer quality definitions, bow, warp and resistivity criteria
  10. IQE. GaAs epitaxy platform, RF and photonic epiwafer structures
  11. IQE. AWSC GaAs supply agreement, 10 April 2024 Android RF wafer supply
  12. IQE. Quintessent purchase agreement, 3 September 2026 GaAs quantum-dot laser epiwafers
  13. Sumitomo Electric. Semiconductor Materials, GaAs substrate production and sales
  14. Sumitomo Electric. Sumiden Semiconductor Materials, GaAs and InP wafer manufacturing
  15. Sumitomo Electric. Compound semiconductor materials, GaAs substrate research and applications
  16. Sumitomo Chemical. GaAs epitaxial wafers, MOVPE HBT, HEMT and laser structures
  17. Vital Materials. GaAs wafer substrates, 2–8 inch VGF-grown doped grades
  18. Vital Materials. Laser material technologies, substrate and epitaxial integration
  19. IQE. Quantum-dot laser supply chain, 24 January 2025 initial wafer order
  20. IQE. High-speed photonics portfolio, 26 March 2024 GaAs quantum-dot epitaxy service
  21. IQE. Full year 2025 results, photonics and wireless performance split
GaAs Semiconductor Material Market, Global Outlook and Forecast 2026–2036

Get Sample Report PDF for Exclusive Insights

Report Sample Includes

  • Table of Contents
  • List of Tables & Figures
  • Charts, Research Methodology, and more...

PDF Icon Download Sample Report PDF

Download Sample Report

Table of Content

Table of Contents
1 Research Methodology and Statistical Scope
1.1 Market Definition and Statistical Scope of GaAs Semiconductor Material
1.2 Key Market Segments
1.2.1 GaAs Semiconductor Material Segment by Type
1.2.2 GaAs Semiconductor Material Segment by Application
1.3 Methodology & Sources of Information
1.3.1 Research Methodology
1.3.2 Research Process
1.3.3 Market Breakdown and Data Triangulation
1.3.4 Base Year
1.3.5 Report Assumptions & Caveats
2 GaAs Semiconductor Material Market Overview
2.1 Global Market Overview
2.1.1 Global GaAs Semiconductor Material Market Size (M USD) Estimates and Forecasts (2026-2034)
2.1.2 Global GaAs Semiconductor Material Sales Estimates and Forecasts (2026-2034)
2.2 Market Segment Executive Summary
2.3 Global Market Size by Region
3 GaAs Semiconductor Material Market Competitive Landscape
3.1 Global GaAs Semiconductor Material Sales by Manufacturers (2019-2025)
3.2 Global GaAs Semiconductor Material Revenue Market Share by Manufacturers (2019-2025)
3.3 GaAs Semiconductor Material Market Share by Company Type (Tier 1, Tier 2, and Tier 3)
3.4 Global GaAs Semiconductor Material Average Price by Manufacturers (2019-2025)
3.5 Manufacturers GaAs Semiconductor Material Sales Sites, Area Served, Product Type
3.6 GaAs Semiconductor Material Market Competitive Situation and Trends
3.6.1 GaAs Semiconductor Material Market Concentration Rate
3.6.2 Global 5 and 10 Largest GaAs Semiconductor Material Players Market Share by Revenue
3.6.3 Mergers & Acquisitions, Expansion
4 GaAs Semiconductor Material Industry Chain Analysis
4.1 GaAs Semiconductor Material Industry Chain Analysis
4.2 Market Overview of Key Raw Materials
4.3 Midstream Market Analysis
4.4 Downstream Customer Analysis
5 The Development and Dynamics of GaAs Semiconductor Material Market
5.1 Key Development Trends
5.2 Driving Factors
5.3 Market Challenges
5.4 Market Restraints
5.5 Industry News
5.5.1 New Product Developments
5.5.2 Mergers & Acquisitions
5.5.3 Expansions
5.5.4 Collaboration/Supply Contracts
5.6 Industry Policies
6 GaAs Semiconductor Material Market Segmentation by Type
6.1 Evaluation Matrix of Segment Market Development Potential (Type)
6.2 Global GaAs Semiconductor Material Sales Market Share by Type (2019-2025)
6.3 Global GaAs Semiconductor Material Market Size Market Share by Type (2019-2025)
6.4 Global GaAs Semiconductor Material Price by Type (2019-2025)
7 GaAs Semiconductor Material Market Segmentation by Application
7.1 Evaluation Matrix of Segment Market Development Potential (Application)
7.2 Global GaAs Semiconductor Material Market Sales by Application (2019-2025)
7.3 Global GaAs Semiconductor Material Market Size (M USD) by Application (2019-2025)
7.4 Global GaAs Semiconductor Material Sales Growth Rate by Application (2019-2025)
8 GaAs Semiconductor Material Market Consumption by Region
8.1 Global GaAs Semiconductor Material Sales by Region
8.1.1 Global GaAs Semiconductor Material Sales by Region
8.1.2 Global GaAs Semiconductor Material Sales Market Share by Region
8.2 North America
8.2.1 North America GaAs Semiconductor Material Sales by Country
8.2.2 U.S.
8.2.3 Canada
8.2.4 Mexico
8.3 Europe
8.3.1 Europe GaAs Semiconductor Material Sales by Country
8.3.2 Germany
8.3.3 France
8.3.4 U.K.
8.3.5 Italy
8.3.6 Russia
8.4 Asia Pacific
8.4.1 Asia Pacific GaAs Semiconductor Material Sales by Region
8.4.2 China
8.4.3 Japan
8.4.4 South Korea
8.4.5 India
8.4.6 Southeast Asia
8.5 South America
8.5.1 South America GaAs Semiconductor Material Sales by Country
8.5.2 Brazil
8.5.3 Argentina
8.5.4 Columbia
8.6 Middle East and Africa
8.6.1 Middle East and Africa GaAs Semiconductor Material Sales by Region
8.6.2 Saudi Arabia
8.6.3 UAE
8.6.4 Egypt
8.6.5 Nigeria
8.6.6 South Africa
9 GaAs Semiconductor Material Market Production by Region
9.1 Global Production of GaAs Semiconductor Material by Region (2019-2025)
9.2 Global GaAs Semiconductor Material Revenue Market Share by Region (2019-2025)
9.3 Global GaAs Semiconductor Material Production, Revenue, Price and Gross Margin (2019-2025)
9.4 North America GaAs Semiconductor Material Production
9.4.1 North America GaAs Semiconductor Material Production Growth Rate (2019-2025)
9.4.2 North America GaAs Semiconductor Material Production, Revenue, Price and Gross Margin (2019-2025)
9.5 Europe GaAs Semiconductor Material Production
9.5.1 Europe GaAs Semiconductor Material Production Growth Rate (2019-2025)
9.5.2 Europe GaAs Semiconductor Material Production, Revenue, Price and Gross Margin (2019-2025)
9.6 Japan GaAs Semiconductor Material Production (2019-2025)
9.6.1 Japan GaAs Semiconductor Material Production Growth Rate (2019-2025)
9.6.2 Japan GaAs Semiconductor Material Production, Revenue, Price and Gross Margin (2019-2025)
9.7 China GaAs Semiconductor Material Production (2019-2025)
9.7.1 China GaAs Semiconductor Material Production Growth Rate (2019-2025)
9.7.2 China GaAs Semiconductor Material Production, Revenue, Price and Gross Margin (2019-2025)
10 Key Companies Profile
10.1 CMK
10.1.1 CMK GaAs Semiconductor Material Basic Information
10.1.2 CMK GaAs Semiconductor Material Product Overview
10.1.3 CMK GaAs Semiconductor Material Product Market Performance
10.1.4 CMK Business Overview
10.1.5 CMK GaAs Semiconductor Material SWOT Analysis
10.1.6 CMK Recent Developments
10.2 DOWA Electronics Materials
10.2.1 DOWA Electronics Materials GaAs Semiconductor Material Basic Information
10.2.2 DOWA Electronics Materials GaAs Semiconductor Material Product Overview
10.2.3 DOWA Electronics Materials GaAs Semiconductor Material Product Market Performance
10.2.4 DOWA Electronics Materials Business Overview
10.2.5 DOWA Electronics Materials GaAs Semiconductor Material SWOT Analysis
10.2.6 DOWA Electronics Materials Recent Developments
10.3 Anadigics (GaAs Labs)
10.3.1 Anadigics (GaAs Labs) GaAs Semiconductor Material Basic Information
10.3.2 Anadigics (GaAs Labs) GaAs Semiconductor Material Product Overview
10.3.3 Anadigics (GaAs Labs) GaAs Semiconductor Material Product Market Performance
10.3.4 Anadigics (GaAs Labs) GaAs Semiconductor Material SWOT Analysis
10.3.5 Anadigics (GaAs Labs) Business Overview
10.3.6 Anadigics (GaAs Labs) Recent Developments
10.4 Avago Technologies
10.4.1 Avago Technologies GaAs Semiconductor Material Basic Information
10.4.2 Avago Technologies GaAs Semiconductor Material Product Overview
10.4.3 Avago Technologies GaAs Semiconductor Material Product Market Performance
10.4.4 Avago Technologies Business Overview
10.4.5 Avago Technologies Recent Developments
10.5 AXT
10.5.1 AXT GaAs Semiconductor Material Basic Information
10.5.2 AXT GaAs Semiconductor Material Product Overview
10.5.3 AXT GaAs Semiconductor Material Product Market Performance
10.5.4 AXT Business Overview
10.5.5 AXT Recent Developments
10.6 BWT
10.6.1 BWT GaAs Semiconductor Material Basic Information
10.6.2 BWT GaAs Semiconductor Material Product Overview
10.6.3 BWT GaAs Semiconductor Material Product Market Performance
10.6.4 BWT Business Overview
10.6.5 BWT Recent Developments
10.7 Advanced Wireless Semiconductor
10.7.1 Advanced Wireless Semiconductor GaAs Semiconductor Material Basic Information
10.7.2 Advanced Wireless Semiconductor GaAs Semiconductor Material Product Overview
10.7.3 Advanced Wireless Semiconductor GaAs Semiconductor Material Product Market Performance
10.7.4 Advanced Wireless Semiconductor Business Overview
10.7.5 Advanced Wireless Semiconductor Recent Developments
10.8 China Crystal Technologies
10.8.1 China Crystal Technologies GaAs Semiconductor Material Basic Information
10.8.2 China Crystal Technologies GaAs Semiconductor Material Product Overview
10.8.3 China Crystal Technologies GaAs Semiconductor Material Product Market Performance
10.8.4 China Crystal Technologies Business Overview
10.8.5 China Crystal Technologies Recent Developments
10.9 Cree
10.9.1 Cree GaAs Semiconductor Material Basic Information
10.9.2 Cree GaAs Semiconductor Material Product Overview
10.9.3 Cree GaAs Semiconductor Material Product Market Performance
10.9.4 Cree Business Overview
10.9.5 Cree Recent Developments
10.10 Freiberger Compound Materials
10.10.1 Freiberger Compound Materials GaAs Semiconductor Material Basic Information
10.10.2 Freiberger Compound Materials GaAs Semiconductor Material Product Overview
10.10.3 Freiberger Compound Materials GaAs Semiconductor Material Product Market Performance
10.10.4 Freiberger Compound Materials Business Overview
10.10.5 Freiberger Compound Materials Recent Developments
10.11 (Alta Devices)Hanergy Holdings
10.11.1 (Alta Devices)Hanergy Holdings GaAs Semiconductor Material Basic Information
10.11.2 (Alta Devices)Hanergy Holdings GaAs Semiconductor Material Product Overview
10.11.3 (Alta Devices)Hanergy Holdings GaAs Semiconductor Material Product Market Performance
10.11.4 (Alta Devices)Hanergy Holdings Business Overview
10.11.5 (Alta Devices)Hanergy Holdings Recent Developments
10.12 Hittite Microwave
10.12.1 Hittite Microwave GaAs Semiconductor Material Basic Information
10.12.2 Hittite Microwave GaAs Semiconductor Material Product Overview
10.12.3 Hittite Microwave GaAs Semiconductor Material Product Market Performance
10.12.4 Hittite Microwave Business Overview
10.12.5 Hittite Microwave Recent Developments
10.13 IQE
10.13.1 IQE GaAs Semiconductor Material Basic Information
10.13.2 IQE GaAs Semiconductor Material Product Overview
10.13.3 IQE GaAs Semiconductor Material Product Market Performance
10.13.4 IQE Business Overview
10.13.5 IQE Recent Developments
10.14 MACOM
10.14.1 MACOM GaAs Semiconductor Material Basic Information
10.14.2 MACOM GaAs Semiconductor Material Product Overview
10.14.3 MACOM GaAs Semiconductor Material Product Market Performance
10.14.4 MACOM Business Overview
10.14.5 MACOM Recent Developments
10.15 Qorvo
10.15.1 Qorvo GaAs Semiconductor Material Basic Information
10.15.2 Qorvo GaAs Semiconductor Material Product Overview
10.15.3 Qorvo GaAs Semiconductor Material Product Market Performance
10.15.4 Qorvo Business Overview
10.15.5 Qorvo Recent Developments
10.16 Sumitomo Electric
10.16.1 Sumitomo Electric GaAs Semiconductor Material Basic Information
10.16.2 Sumitomo Electric GaAs Semiconductor Material Product Overview
10.16.3 Sumitomo Electric GaAs Semiconductor Material Product Market Performance
10.16.4 Sumitomo Electric Business Overview
10.16.5 Sumitomo Electric Recent Developments
10.17 ALB Materials Inc
10.17.1 ALB Materials Inc GaAs Semiconductor Material Basic Information
10.17.2 ALB Materials Inc GaAs Semiconductor Material Product Overview
10.17.3 ALB Materials Inc GaAs Semiconductor Material Product Market Performance
10.17.4 ALB Materials Inc Business Overview
10.17.5 ALB Materials Inc Recent Developments
10.18 Vital Materials
10.18.1 Vital Materials GaAs Semiconductor Material Basic Information
10.18.2 Vital Materials GaAs Semiconductor Material Product Overview
10.18.3 Vital Materials GaAs Semiconductor Material Product Market Performance
10.18.4 Vital Materials Business Overview
10.18.5 Vital Materials Recent Developments
11 GaAs Semiconductor Material Market Forecast by Region
11.1 Global GaAs Semiconductor Material Market Size Forecast
11.2 Global GaAs Semiconductor Material Market Forecast by Region
11.2.1 North America Market Size Forecast by Country
11.2.2 Europe GaAs Semiconductor Material Market Size Forecast by Country
11.2.3 Asia Pacific GaAs Semiconductor Material Market Size Forecast by Region
11.2.4 South America GaAs Semiconductor Material Market Size Forecast by Country
11.2.5 Middle East and Africa Forecasted Consumption of GaAs Semiconductor Material by Country
12 Forecast Market by Type and by Application (2025-2032)
12.1 Global GaAs Semiconductor Material Market Forecast by Type (2025-2032)
12.1.1 Global Forecasted Sales of GaAs Semiconductor Material by Type (2025-2032)
12.1.2 Global GaAs Semiconductor Material Market Size Forecast by Type (2025-2032)
12.1.3 Global Forecasted Price of GaAs Semiconductor Material by Type (2025-2032)
12.2 Global GaAs Semiconductor Material Market Forecast by Application (2025-2032)
12.2.1 Global GaAs Semiconductor Material Sales (K Units) Forecast by Application
12.2.2 Global GaAs Semiconductor Material Market Size (M USD) Forecast by Application (2025-2032)
13 Conclusion and Key FindingsList of Tables
Table 1. Introduction of the Type
Table 2. Introduction of the Application
Table 3. Market Size (M USD) Segment Executive Summary
Table 4. GaAs Semiconductor Material Market Size Comparison by Region (M USD)
Table 5. Global GaAs Semiconductor Material Sales (K Units) by Manufacturers (2019-2025)
Table 6. Global GaAs Semiconductor Material Sales Market Share by Manufacturers (2019-2025)
Table 7. Global GaAs Semiconductor Material Revenue (M USD) by Manufacturers (2019-2025)
Table 8. Global GaAs Semiconductor Material Revenue Share by Manufacturers (2019-2025)
Table 9. Company Type (Tier 1, Tier 2, and Tier 3) & (based on the Revenue in GaAs Semiconductor Material as of 2022)
Table 10. Global Market GaAs Semiconductor Material Average Price (USD/Unit) of Key Manufacturers (2019-2025)
Table 11. Manufacturers GaAs Semiconductor Material Sales Sites and Area Served
Table 12. Manufacturers GaAs Semiconductor Material Product Type
Table 13. Global GaAs Semiconductor Material Manufacturers Market Concentration Ratio (CR5 and HHI)
Table 14. Mergers & Acquisitions, Expansion Plans
Table 15. Industry Chain Map of GaAs Semiconductor Material
Table 16. Market Overview of Key Raw Materials
Table 17. Midstream Market Analysis
Table 18. Downstream Customer Analysis
Table 19. Key Development Trends
Table 20. Driving Factors
Table 21. GaAs Semiconductor Material Market Challenges
Table 22. Global GaAs Semiconductor Material Sales by Type (K Units)
Table 23. Global GaAs Semiconductor Material Market Size by Type (M USD)
Table 24. Global GaAs Semiconductor Material Sales (K Units) by Type (2019-2025)
Table 25. Global GaAs Semiconductor Material Sales Market Share by Type (2019-2025)
Table 26. Global GaAs Semiconductor Material Market Size (M USD) by Type (2019-2025)
Table 27. Global GaAs Semiconductor Material Market Size Share by Type (2019-2025)
Table 28. Global GaAs Semiconductor Material Price (USD/Unit) by Type (2019-2025)
Table 29. Global GaAs Semiconductor Material Sales (K Units) by Application
Table 30. Global GaAs Semiconductor Material Market Size by Application
Table 31. Global GaAs Semiconductor Material Sales by Application (2019-2025) & (K Units)
Table 32. Global GaAs Semiconductor Material Sales Market Share by Application (2019-2025)
Table 33. Global GaAs Semiconductor Material Sales by Application (2019-2025) & (M USD)
Table 34. Global GaAs Semiconductor Material Market Share by Application (2019-2025)
Table 35. Global GaAs Semiconductor Material Sales Growth Rate by Application (2019-2025)
Table 36. Global GaAs Semiconductor Material Sales by Region (2019-2025) & (K Units)
Table 37. Global GaAs Semiconductor Material Sales Market Share by Region (2019-2025)
Table 38. North America GaAs Semiconductor Material Sales by Country (2019-2025) & (K Units)
Table 39. Europe GaAs Semiconductor Material Sales by Country (2019-2025) & (K Units)
Table 40. Asia Pacific GaAs Semiconductor Material Sales by Region (2019-2025) & (K Units)
Table 41. South America GaAs Semiconductor Material Sales by Country (2019-2025) & (K Units)
Table 42. Middle East and Africa GaAs Semiconductor Material Sales by Region (2019-2025) & (K Units)
Table 43. Global GaAs Semiconductor Material Production (K Units) by Region (2019-2025)
Table 44. Global GaAs Semiconductor Material Revenue (US$ Million) by Region (2019-2025)
Table 45. Global GaAs Semiconductor Material Revenue Market Share by Region (2019-2025)
Table 46. Global GaAs Semiconductor Material Production (K Units), Revenue (US$ Million), Price (USD/Unit) and Gross Margin (2019-2025)
Table 47. North America GaAs Semiconductor Material Production (K Units), Revenue (US$ Million), Price (USD/Unit) and Gross Margin (2019-2025)
Table 48. Europe GaAs Semiconductor Material Production (K Units), Revenue (US$ Million), Price (USD/Unit) and Gross Margin (2019-2025)
Table 49. Japan GaAs Semiconductor Material Production (K Units), Revenue (US$ Million), Price (USD/Unit) and Gross Margin (2019-2025)
Table 50. China GaAs Semiconductor Material Production (K Units), Revenue (US$ Million), Price (USD/Unit) and Gross Margin (2019-2025)
Table 51. CMK GaAs Semiconductor Material Basic Information
Table 52. CMK GaAs Semiconductor Material Product Overview
Table 53. CMK GaAs Semiconductor Material Sales (K Units), Revenue (M USD), Price (USD/Unit) and Gross Margin (2019-2025)
Table 54. CMK Business Overview
Table 55. CMK GaAs Semiconductor Material SWOT Analysis
Table 56. CMK Recent Developments
Table 57. DOWA Electronics Materials GaAs Semiconductor Material Basic Information
Table 58. DOWA Electronics Materials GaAs Semiconductor Material Product Overview
Table 59. DOWA Electronics Materials GaAs Semiconductor Material Sales (K Units), Revenue (M USD), Price (USD/Unit) and Gross Margin (2019-2025)
Table 60. DOWA Electronics Materials Business Overview
Table 61. DOWA Electronics Materials GaAs Semiconductor Material SWOT Analysis
Table 62. DOWA Electronics Materials Recent Developments
Table 63. Anadigics (GaAs Labs) GaAs Semiconductor Material Basic Information
Table 64. Anadigics (GaAs Labs) GaAs Semiconductor Material Product Overview
Table 65. Anadigics (GaAs Labs) GaAs Semiconductor Material Sales (K Units), Revenue (M USD), Price (USD/Unit) and Gross Margin (2019-2025)
Table 66. Anadigics (GaAs Labs) GaAs Semiconductor Material SWOT Analysis
Table 67. Anadigics (GaAs Labs) Business Overview
Table 68. Anadigics (GaAs Labs) Recent Developments
Table 69. Avago Technologies GaAs Semiconductor Material Basic Information
Table 70. Avago Technologies GaAs Semiconductor Material Product Overview
Table 71. Avago Technologies GaAs Semiconductor Material Sales (K Units), Revenue (M USD), Price (USD/Unit) and Gross Margin (2019-2025)
Table 72. Avago Technologies Business Overview
Table 73. Avago Technologies Recent Developments
Table 74. AXT GaAs Semiconductor Material Basic Information
Table 75. AXT GaAs Semiconductor Material Product Overview
Table 76. AXT GaAs Semiconductor Material Sales (K Units), Revenue (M USD), Price (USD/Unit) and Gross Margin (2019-2025)
Table 77. AXT Business Overview
Table 78. AXT Recent Developments
Table 79. BWT GaAs Semiconductor Material Basic Information
Table 80. BWT GaAs Semiconductor Material Product Overview
Table 81. BWT GaAs Semiconductor Material Sales (K Units), Revenue (M USD), Price (USD/Unit) and Gross Margin (2019-2025)
Table 82. BWT Business Overview
Table 83. BWT Recent Developments
Table 84. Advanced Wireless Semiconductor GaAs Semiconductor Material Basic Information
Table 85. Advanced Wireless Semiconductor GaAs Semiconductor Material Product Overview
Table 86. Advanced Wireless Semiconductor GaAs Semiconductor Material Sales (K Units), Revenue (M USD), Price (USD/Unit) and Gross Margin (2019-2025)
Table 87. Advanced Wireless Semiconductor Business Overview
Table 88. Advanced Wireless Semiconductor Recent Developments
Table 89. China Crystal Technologies GaAs Semiconductor Material Basic Information
Table 90. China Crystal Technologies GaAs Semiconductor Material Product Overview
Table 91. China Crystal Technologies GaAs Semiconductor Material Sales (K Units), Revenue (M USD), Price (USD/Unit) and Gross Margin (2019-2025)
Table 92. China Crystal Technologies Business Overview
Table 93. China Crystal Technologies Recent Developments
Table 94. Cree GaAs Semiconductor Material Basic Information
Table 95. Cree GaAs Semiconductor Material Product Overview
Table 96. Cree GaAs Semiconductor Material Sales (K Units), Revenue (M USD), Price (USD/Unit) and Gross Margin (2019-2025)
Table 97. Cree Business Overview
Table 98. Cree Recent Developments
Table 99. Freiberger Compound Materials GaAs Semiconductor Material Basic Information
Table 100. Freiberger Compound Materials GaAs Semiconductor Material Product Overview
Table 101. Freiberger Compound Materials GaAs Semiconductor Material Sales (K Units), Revenue (M USD), Price (USD/Unit) and Gross Margin (2019-2025)
Table 102. Freiberger Compound Materials Business Overview
Table 103. Freiberger Compound Materials Recent Developments
Table 104. (Alta Devices)Hanergy Holdings GaAs Semiconductor Material Basic Information
Table 105. (Alta Devices)Hanergy Holdings GaAs Semiconductor Material Product Overview
Table 106. (Alta Devices)Hanergy Holdings GaAs Semiconductor Material Sales (K Units), Revenue (M USD), Price (USD/Unit) and Gross Margin (2019-2025)
Table 107. (Alta Devices)Hanergy Holdings Business Overview
Table 108. (Alta Devices)Hanergy Holdings Recent Developments
Table 109. Hittite Microwave GaAs Semiconductor Material Basic Information
Table 110. Hittite Microwave GaAs Semiconductor Material Product Overview
Table 111. Hittite Microwave GaAs Semiconductor Material Sales (K Units), Revenue (M USD), Price (USD/Unit) and Gross Margin (2019-2025)
Table 112. Hittite Microwave Business Overview
Table 113. Hittite Microwave Recent Developments
Table 114. IQE GaAs Semiconductor Material Basic Information
Table 115. IQE GaAs Semiconductor Material Product Overview
Table 116. IQE GaAs Semiconductor Material Sales (K Units), Revenue (M USD), Price (USD/Unit) and Gross Margin (2019-2025)
Table 117. IQE Business Overview
Table 118. IQE Recent Developments
Table 119. MACOM GaAs Semiconductor Material Basic Information
Table 120. MACOM GaAs Semiconductor Material Product Overview
Table 121. MACOM GaAs Semiconductor Material Sales (K Units), Revenue (M USD), Price (USD/Unit) and Gross Margin (2019-2025)
Table 122. MACOM Business Overview
Table 123. MACOM Recent Developments
Table 124. Qorvo GaAs Semiconductor Material Basic Information
Table 125. Qorvo GaAs Semiconductor Material Product Overview
Table 126. Qorvo GaAs Semiconductor Material Sales (K Units), Revenue (M USD), Price (USD/Unit) and Gross Margin (2019-2025)
Table 127. Qorvo Business Overview
Table 128. Qorvo Recent Developments
Table 129. Sumitomo Electric GaAs Semiconductor Material Basic Information
Table 130. Sumitomo Electric GaAs Semiconductor Material Product Overview
Table 131. Sumitomo Electric GaAs Semiconductor Material Sales (K Units), Revenue (M USD), Price (USD/Unit) and Gross Margin (2019-2025)
Table 132. Sumitomo Electric Business Overview
Table 133. Sumitomo Electric Recent Developments
Table 134. ALB Materials Inc GaAs Semiconductor Material Basic Information
Table 135. ALB Materials Inc GaAs Semiconductor Material Product Overview
Table 136. ALB Materials Inc GaAs Semiconductor Material Sales (K Units), Revenue (M USD), Price (USD/Unit) and Gross Margin (2019-2025)
Table 137. ALB Materials Inc Business Overview
Table 138. ALB Materials Inc Recent Developments
Table 139. Vital Materials GaAs Semiconductor Material Basic Information
Table 140. Vital Materials GaAs Semiconductor Material Product Overview
Table 141. Vital Materials GaAs Semiconductor Material Sales (K Units), Revenue (M USD), Price (USD/Unit) and Gross Margin (2019-2025)
Table 142. Vital Materials Business Overview
Table 143. Vital Materials Recent Developments
Table 144. Global GaAs Semiconductor Material Sales Forecast by Region (2025-2032) & (K Units)
Table 145. Global GaAs Semiconductor Material Market Size Forecast by Region (2025-2032) & (M USD)
Table 146. North America GaAs Semiconductor Material Sales Forecast by Country (2025-2032) & (K Units)
Table 147. North America GaAs Semiconductor Material Market Size Forecast by Country (2025-2032) & (M USD)
Table 148. Europe GaAs Semiconductor Material Sales Forecast by Country (2025-2032) & (K Units)
Table 149. Europe GaAs Semiconductor Material Market Size Forecast by Country (2025-2032) & (M USD)
Table 150. Asia Pacific GaAs Semiconductor Material Sales Forecast by Region (2025-2032) & (K Units)
Table 151. Asia Pacific GaAs Semiconductor Material Market Size Forecast by Region (2025-2032) & (M USD)
Table 152. South America GaAs Semiconductor Material Sales Forecast by Country (2025-2032) & (K Units)
Table 153. South America GaAs Semiconductor Material Market Size Forecast by Country (2025-2032) & (M USD)
Table 154. Middle East and Africa GaAs Semiconductor Material Consumption Forecast by Country (2025-2032) & (Units)
Table 155. Middle East and Africa GaAs Semiconductor Material Market Size Forecast by Country (2025-2032) & (M USD)
Table 156. Global GaAs Semiconductor Material Sales Forecast by Type (2025-2032) & (K Units)
Table 157. Global GaAs Semiconductor Material Market Size Forecast by Type (2025-2032) & (M USD)
Table 158. Global GaAs Semiconductor Material Price Forecast by Type (2025-2032) & (USD/Unit)
Table 159. Global GaAs Semiconductor Material Sales (K Units) Forecast by Application (2025-2032)
Table 160. Global GaAs Semiconductor Material Market Size Forecast by Application (2025-2032) & (M USD)
List of Figures
Figure 1. Product Picture of GaAs Semiconductor Material
Figure 2. Data Triangulation
Figure 3. Key Caveats
Figure 4. Global GaAs Semiconductor Material Market Size (M USD), 2026-2034
Figure 5. Global GaAs Semiconductor Material Market Size (M USD) (2026-2034)
Figure 6. Global GaAs Semiconductor Material Sales (K Units) & (2026-2034)
Figure 7. Evaluation Matrix of Segment Market Development Potential (Type)
Figure 8. Evaluation Matrix of Segment Market Development Potential (Application)
Figure 9. Evaluation Matrix of Regional Market Development Potential
Figure 10. GaAs Semiconductor Material Market Size by Country (M USD)
Figure 11. GaAs Semiconductor Material Sales Share by Manufacturers in 2023
Figure 12. Global GaAs Semiconductor Material Revenue Share by Manufacturers in 2023
Figure 13. GaAs Semiconductor Material Market Share by Company Type (Tier 1, Tier 2 and Tier 3): 2023
Figure 14. Global Market GaAs Semiconductor Material Average Price (USD/Unit) of Key Manufacturers in 2023
Figure 15. The Global 5 and 10 Largest Players: Market Share by GaAs Semiconductor Material Revenue in 2023
Figure 16. Evaluation Matrix of Segment Market Development Potential (Type)
Figure 17. Global GaAs Semiconductor Material Market Share by Type
Figure 18. Sales Market Share of GaAs Semiconductor Material by Type (2019-2025)
Figure 19. Sales Market Share of GaAs Semiconductor Material by Type in 2023
Figure 20. Market Size Share of GaAs Semiconductor Material by Type (2019-2025)
Figure 21. Market Size Market Share of GaAs Semiconductor Material by Type in 2023
Figure 22. Evaluation Matrix of Segment Market Development Potential (Application)
Figure 23. Global GaAs Semiconductor Material Market Share by Application
Figure 24. Global GaAs Semiconductor Material Sales Market Share by Application (2019-2025)
Figure 25. Global GaAs Semiconductor Material Sales Market Share by Application in 2023
Figure 26. Global GaAs Semiconductor Material Market Share by Application (2019-2025)
Figure 27. Global GaAs Semiconductor Material Market Share by Application in 2023
Figure 28. Global GaAs Semiconductor Material Sales Growth Rate by Application (2019-2025)
Figure 29. Global GaAs Semiconductor Material Sales Market Share by Region (2019-2025)
Figure 30. North America GaAs Semiconductor Material Sales and Growth Rate (2019-2025) & (K Units)
Figure 31. North America GaAs Semiconductor Material Sales Market Share by Country in 2023
Figure 32. U.S. GaAs Semiconductor Material Sales and Growth Rate (2019-2025) & (K Units)
Figure 33. Canada GaAs Semiconductor Material Sales (K Units) and Growth Rate (2019-2025)
Figure 34. Mexico GaAs Semiconductor Material Sales (Units) and Growth Rate (2019-2025)
Figure 35. Europe GaAs Semiconductor Material Sales and Growth Rate (2019-2025) & (K Units)
Figure 36. Europe GaAs Semiconductor Material Sales Market Share by Country in 2023
Figure 37. Germany GaAs Semiconductor Material Sales and Growth Rate (2019-2025) & (K Units)
Figure 38. France GaAs Semiconductor Material Sales and Growth Rate (2019-2025) & (K Units)
Figure 39. U.K. GaAs Semiconductor Material Sales and Growth Rate (2019-2025) & (K Units)
Figure 40. Italy GaAs Semiconductor Material Sales and Growth Rate (2019-2025) & (K Units)
Figure 41. Russia GaAs Semiconductor Material Sales and Growth Rate (2019-2025) & (K Units)
Figure 42. Asia Pacific GaAs Semiconductor Material Sales and Growth Rate (K Units)
Figure 43. Asia Pacific GaAs Semiconductor Material Sales Market Share by Region in 2023
Figure 44. China GaAs Semiconductor Material Sales and Growth Rate (2019-2025) & (K Units)
Figure 45. Japan GaAs Semiconductor Material Sales and Growth Rate (2019-2025) & (K Units)
Figure 46. South Korea GaAs Semiconductor Material Sales and Growth Rate (2019-2025) & (K Units)
Figure 47. India GaAs Semiconductor Material Sales and Growth Rate (2019-2025) & (K Units)
Figure 48. Southeast Asia GaAs Semiconductor Material Sales and Growth Rate (2019-2025) & (K Units)
Figure 49. South America GaAs Semiconductor Material Sales and Growth Rate (K Units)
Figure 50. South America GaAs Semiconductor Material Sales Market Share by Country in 2023
Figure 51. Brazil GaAs Semiconductor Material Sales and Growth Rate (2019-2025) & (K Units)
Figure 52. Argentina GaAs Semiconductor Material Sales and Growth Rate (2019-2025) & (K Units)
Figure 53. Columbia GaAs Semiconductor Material Sales and Growth Rate (2019-2025) & (K Units)
Figure 54. Middle East and Africa GaAs Semiconductor Material Sales and Growth Rate (K Units)
Figure 55. Middle East and Africa GaAs Semiconductor Material Sales Market Share by Region in 2023
Figure 56. Saudi Arabia GaAs Semiconductor Material Sales and Growth Rate (2019-2025) & (K Units)
Figure 57. UAE GaAs Semiconductor Material Sales and Growth Rate (2019-2025) & (K Units)
Figure 58. Egypt GaAs Semiconductor Material Sales and Growth Rate (2019-2025) & (K Units)
Figure 59. Nigeria GaAs Semiconductor Material Sales and Growth Rate (2019-2025) & (K Units)
Figure 60. South Africa GaAs Semiconductor Material Sales and Growth Rate (2019-2025) & (K Units)
Figure 61. Global GaAs Semiconductor Material Production Market Share by Region (2019-2025)
Figure 62. North America GaAs Semiconductor Material Production (K Units) Growth Rate (2019-2025)
Figure 63. Europe GaAs Semiconductor Material Production (K Units) Growth Rate (2019-2025)
Figure 64. Japan GaAs Semiconductor Material Production (K Units) Growth Rate (2019-2025)
Figure 65. China GaAs Semiconductor Material Production (K Units) Growth Rate (2019-2025)
Figure 66. Global GaAs Semiconductor Material Sales Forecast by Volume (2026-2034) & (K Units)
Figure 67. Global GaAs Semiconductor Material Market Size Forecast by Value (2026-2034) & (M USD)
Figure 68. Global GaAs Semiconductor Material Sales Market Share Forecast by Type (2025-2032)
Figure 69. Global GaAs Semiconductor Material Market Share Forecast by Type (2025-2032)
Figure 70. Global GaAs Semiconductor Material Sales Forecast by Application (2025-2032)
Figure 71. Global GaAs Semiconductor Material Market Share Forecast by Application (2025-2032)