Key Statistics
Key Takeaways
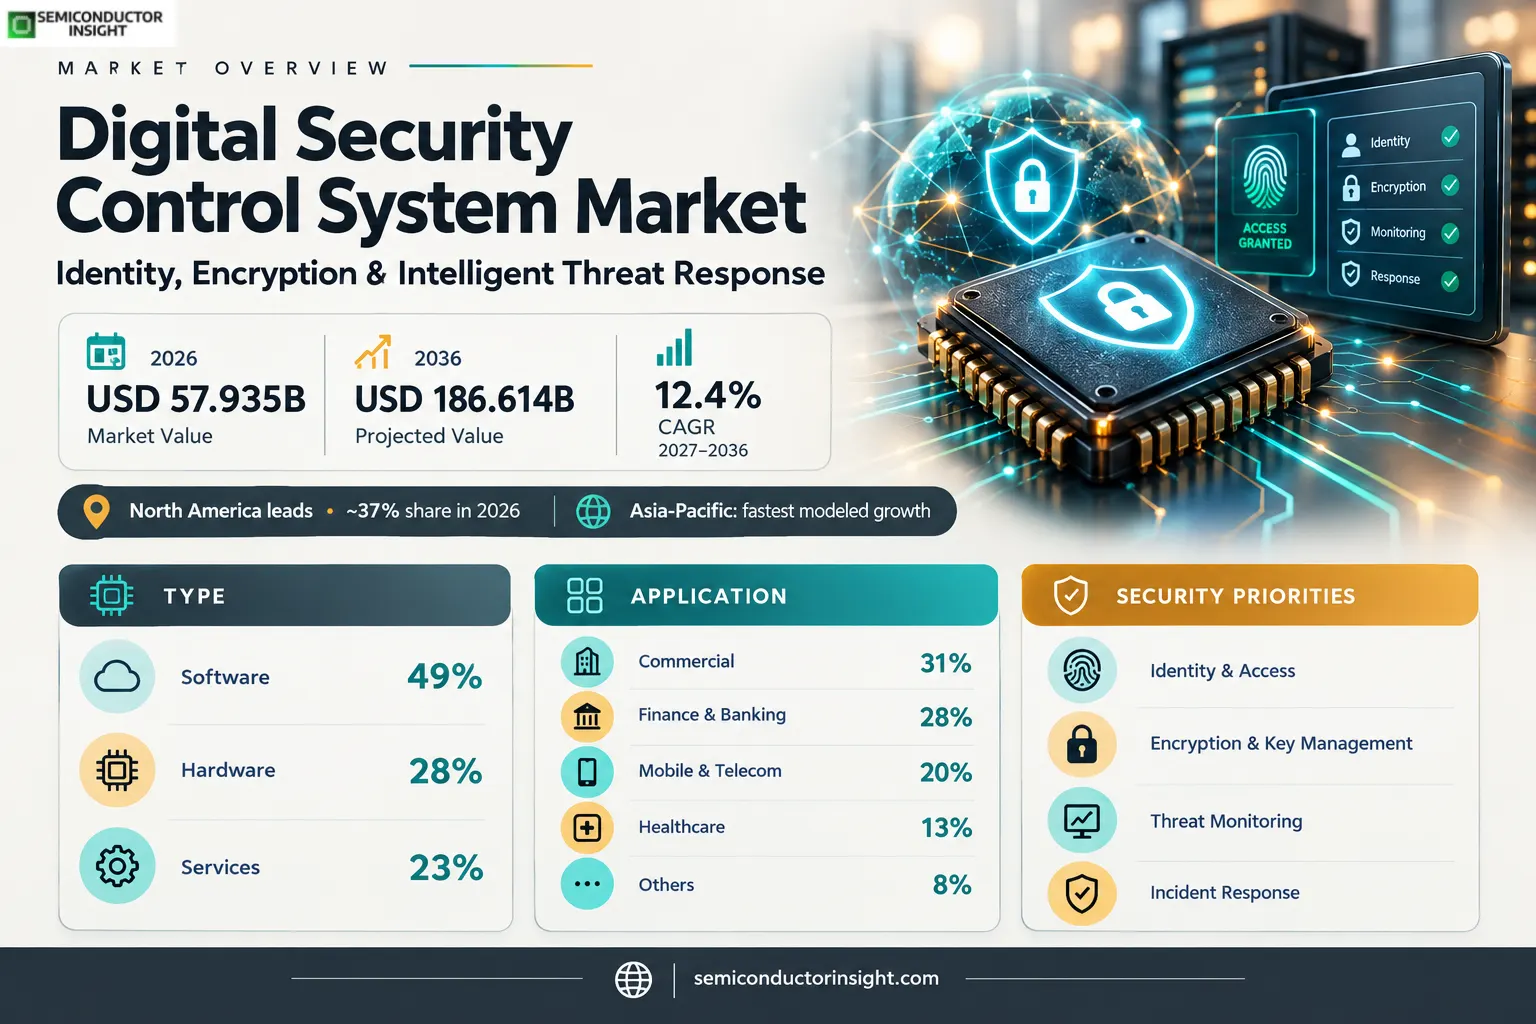
- Market trajectory: the global digital security control system market reaches USD 57,935 million in 2026 and is projected at USD 186,614 million by 2036, representing 12.4% CAGR over 2027–2036 as access, monitoring and response converge.
- Software control platforms account for the largest modeled type share at ~49% in 2026, while services hold ~23% and are projected to grow at ~12.9% CAGR as buyers outsource continuous monitoring, response and identity operations.
- Commercial applications lead the modeled application mix at ~31% of 2026 revenue, followed by finance and banking at ~28%; healthcare is smaller at ~13% but expands faster at ~14.0% CAGR amid connected-care and patient-data protection requirements.
- North America holds the largest estimated regional share at ~37% in 2026, supported by substantial United States cybersecurity procurement; Asia-Pacific follows at ~31% and has the fastest modeled growth of ~14.1% CAGR.
- Integration and accountability remain central commercial challenges because buyers must reconcile cloud and on-premises controls, retire overlapping tools, protect privileged credentials and demonstrate audit-ready incident response across increasingly complex supplier ecosystems.
Digital Security Control System Market Overview
The digital security control system market was valued at USD 57,935 million in 2026 and is projected to reach USD 186,614 million by 2036, expanding at a CAGR of 12.4% over the 2027–2036 forecast period. North America represented an estimated ~37% of 2026 revenue, while Asia-Pacific is positioned for the fastest modeled regional expansion.
Digital security control systems coordinate the authentication, authorization, encryption, monitoring and response functions used to protect information assets and connected business services. Unlike a single firewall or endpoint agent, an integrated control environment must evaluate identity, device posture, application access and observed threats against policy. Hardware authenticators and cryptographic modules anchor trust, software enforces controls and analyzes telemetry, and service providers operate monitoring and response processes. The resulting commercial market encompasses multiple procurement categories but shares a common goal: measurable reduction in unauthorized access and operational exposure.
The revenue boundary includes security-control hardware, paid security software and directly related implementation or managed services across the published Hardware, Software and Service categories. Application coverage follows Mobile Security & Telecommunication, Finance & Banking, Healthcare, Commercial and Others. The boundary excludes losses caused by cybercrime, insurance claims, general-purpose computing equipment without a security-control function, and stand-alone physical surveillance products. This distinction matters because cybersecurity vendors frequently report consolidated revenue that includes unrelated infrastructure or professional services; those company-wide totals cannot be treated as the market value of digital security controls.
Enterprise architecture is shifting from perimeter appliances toward identity-centric policy and continuous verification. A user may authenticate through a passkey, receive conditional access based on device posture and then generate endpoint and cloud activity for correlation in a security operations platform. Encryption and key management protect data at rest and in transit, while automated playbooks can isolate a compromised endpoint or revoke a token. These functions have different qualification cycles and pricing models, so buyers increasingly assess interoperability, telemetry quality and policy consistency rather than counting security products in isolation.
Institutional evidence demonstrates why control modernization is commercially relevant. The United States National Institute of Standards and Technology released Cybersecurity Framework 2.0 in February 2024, adding a Govern function and broadening the guidance to organizations beyond critical infrastructure. ENISA reviewed 4,875 cybersecurity incidents spanning July 2024 through June 2025, while its 2026 threat-landscape discussion continues to emphasize ransomware and attacks against public administration. These observations concern risk exposure, not market revenue, but they explain why identity assurance, monitoring, incident response and supply-chain controls are recurring procurement priorities.
Product development is accelerating in three connected areas: passwordless identity, automated threat triage and protection of artificial-intelligence workloads. Microsoft announced six Security Copilot agents and five partner agents in March 2025 for preview in April, illustrating how security platforms are embedding supervised automation into existing operations. The FIDO Alliance introduced its Passkey Pledge in April 2025 to expand passwordless authentication, while Thales reported in May 2025 that 73% of surveyed organizations were investing in AI-specific security tools. The commercial implication is a growing requirement to connect identity controls, analytics and governance without expanding operational complexity.
Segment Analysis: By Type
The digital security control system market is segmented by type into Hardware, Software and Service. Software holds the largest modeled 2026 revenue share at ~49% and grows at ~13.5% CAGR, reflecting recurring licenses for identity management, security analytics and policy orchestration. Hardware accounts for ~28% and grows at ~9.7%, while services represent ~23% with an estimated ~12.9% CAGR as organizations require specialist integration and around-the-clock response.
| Type | Function | Market position |
|---|---|---|
| Hardware | Security-control hardware includes hardware security modules, cryptographic accelerators, physical authentication tokens and dedicated gateways that establish a trusted boundary for credentials, keys or network traffic. A banking institution may require tamper-resistant key custody, while a telecom operator may deploy purpose-built appliances at network edges. Hardware purchasing is shaped by certification, key lifecycle requirements, throughput, replacement intervals and compatibility with software policies, making procurement slower than a simple cloud subscription. | Hardware represents an estimated ~28% of 2026 market revenue and is projected to grow at ~9.7% CAGR, below software because buyers increasingly centralize policy in cloud-delivered services. Dedicated authenticators remain relevant where phishing resistance or regulated key custody is required, and suppliers compete on assurance, device lifecycle and integration with enterprise identity directories. Unit demand can rise even when revenue share declines because hardware functionality is increasingly bundled into larger security architectures. |
| Software | Security software encompasses identity and access management, threat detection, security analytics, endpoint control, encryption management and orchestration platforms that convert policy into operational decisions. The same organization may correlate identity logs, endpoint alerts and cloud configuration changes before blocking a suspicious session. Software has a recurring commercial profile because licenses, subscriptions, maintenance and platform expansion track users, workloads, protected assets or telemetry volume rather than a single equipment installation. | Software leads with an estimated ~49% of 2026 revenue and modeled ~13.5% CAGR, reflecting cloud-native control planes and integrated security operations. Microsoft added Security Copilot agents for phishing and data-protection triage in 2025, illustrating the shift from isolated alerts toward managed workflows. The segment attracts investment because analytics and policy can be expanded across business units without replacing every underlying sensor, although buyers challenge vendors on overlapping licenses and data-ingestion costs. |
| Service | Services include system design, control integration, managed detection and response, identity lifecycle operations, incident-response retainers and ongoing compliance support. A buyer may retain ownership of cryptographic hardware and security software while outsourcing tuning, alert review and escalation to a specialist provider. Commercial outcomes depend on response time, coverage hours, staffing, evidence retention and clearly defined responsibility between customer and vendor, making contract quality central to operational resilience. | Services represent an estimated ~23% of 2026 revenue and grow at modeled ~12.9% CAGR as organizations address staffing constraints and complex hybrid estates. The segment benefits from NIST governance guidance and regulatory expectations for documented response, but it also faces margin pressure from automation and platform consolidation. Buyers distinguish managed monitoring from occasional consulting and increasingly seek contracts that specify containment authority, service-level objectives and evidence required after an incident. |
Deployment architecture and commercial role
Two delivery architectures influence how the published hardware, software and service revenue is realized. Cloud-delivered controls account for an estimated ~58% of 2026 spending in a secondary modeled lens because identity directories, security analytics and managed response can operate across distributed workloads. On-premises and embedded controls account for the remaining ~42%, with a durable role in hardware-backed key custody, isolated industrial networks and tightly regulated environments. This deployment view is a separate partition of the same revenue and must not be added to the product-type totals.
| Axis | Members | Commercial role |
|---|---|---|
| Deployment architecture | Cloud-delivered security controls; On-premises and embedded controls | Cloud platforms centralize monitoring and policy, while embedded systems protect cryptographic secrets and restricted networks. An estimated ~58% cloud-delivered share in 2026 reflects the expansion of subscription security services; the remaining ~42% supports local enforcement and regulated key custody. Both architectures can coexist within a single enterprise, but spending is assigned once according to the purchased control delivery mode. |
Segment Analysis: By Application
By application, Commercial organizations form the largest modeled revenue category at ~31% in 2026, followed by Finance & Banking at ~28%, Mobile Security & Telecommunication at ~20%, Healthcare at ~13%, and Others at ~8%. Healthcare has the fastest modeled CAGR at ~14.0% because connected care and sensitive clinical data require both identity assurance and continuous threat monitoring.
| Application | Demand characteristics |
|---|---|
| Mobile Security & Telecommunication | Telecommunications operators secure subscriber identities, service-management interfaces, core network functions and privileged engineering access while supporting mobile applications that connect millions of devices. Security procurement emphasizes high availability, strong authentication, scalable event correlation and controls that do not degrade network latency. This application accounts for an estimated ~20% of 2026 revenue and a modeled ~13.0% CAGR as operators integrate cloud-native network functions and extend protections to partners and distributed edge infrastructure. |
| Finance & Banking | Banks, payment providers and insurers purchase security controls for account authentication, transaction integrity, cryptographic key custody, fraud response and regulated data access. OneSpan provides authentication and transaction-security products, while FIDO passkey adoption offers an additional route to phishing-resistant consumer and employee sign-in. Finance and banking represent an estimated ~28% of 2026 market revenue with ~11.7% modeled CAGR; mature spending supports a large installed base, but procurement remains sensitive to auditability and the cost of operational failures. |
| Healthcare | Hospitals, laboratories, insurers and digital-health operators need to restrict access to clinical records while enabling authorized professionals to work across shared devices and external care networks. Identity lifecycle management, privileged-access protection and incident response are complicated by legacy medical equipment and the need to preserve treatment availability. Healthcare represents an estimated ~13% of 2026 revenue and is modeled to expand at ~14.0% CAGR, with cybersecurity purchasing linked to patient-safety continuity as well as information confidentiality. |
| Commercial | Commercial enterprises include retailers, professional-services firms, technology operators, manufacturers and other private organizations buying integrated identity, endpoint, network and cloud controls. Their spending responds to hybrid work, software-as-a-service adoption, third-party access and the need to consolidate overlapping security products. The category leads at an estimated ~31% of 2026 revenue and grows at ~11.5% modeled CAGR; competitive differentiation centers on integration with business applications, lower alert-handling costs and practical governance across multiple operating sites. |
| Others | Other applications cover public administration, education, nonprofit organizations and specialized institutional users not assigned to the four named commercial verticals. Public-sector buyers often require domestic data handling, documented procurement assurance and long support periods, while universities need to balance open research access against protection of credentials and sensitive information. This category represents an estimated ~8% of 2026 revenue and a modeled ~13.9% CAGR, supported by government modernization and expanding cybersecurity obligations for essential services. |
Distribution increasingly combines direct enterprise platform sales, specialist integrators, managed security providers and cloud marketplaces. Hardware may reach customers through approved channels, while subscription software is often contracted centrally and services are attached through implementation partners. The purchasing route affects recurring revenue recognition and customer retention: identity platforms can expand seat counts, detection services can add telemetry coverage, and specialist integrators can support migration from legacy authentication products without requiring customers to replace every security component at once.
Regional Analysis
North America is the largest estimated regional market with ~37% of 2026 revenue, followed by Asia-Pacific at ~31% and Europe at ~23%. Asia-Pacific has the fastest modeled expansion at ~14.1% CAGR, compared with North America at ~11.6%, Europe at ~11.2%, South America at ~13.0% and Middle East & Africa at ~11.5%. The shares are analytical estimates; country conditions and procurement rules differ materially.
How do regulatory obligations and enterprise security architectures reshape regional demand?
Digital security controls are bought to satisfy operational requirements, risk governance and measurable protection needs rather than simply to react to the number of reported attacks. North American procurement combines enterprise software maturity with documented governance under the 2024 NIST Cybersecurity Framework update. Europe places particular weight on essential-entity obligations and cross-border supply-chain oversight. In Asia-Pacific, expanding mobile services and heterogeneous cloud estates favor identity integration and managed response, although regulatory and infrastructure conditions vary by country.
The estimated regional shares of ~37% North America, ~31% Asia-Pacific, ~23% Europe, ~5% South America and ~4% Middle East & Africa sum to 100% for 2026. Growth assumptions differ by region: Asia-Pacific ~14.1% CAGR, South America ~13.0%, North America ~11.6%, Middle East & Africa ~11.5% and Europe ~11.2%. The distribution reflects market access and deployment patterns, not measured cybercrime losses, and the growth model is reconciled to the global 2036 forecast.
| Region | Position | Growth outlook | Demand profile | What decides supplier selection |
|---|---|---|---|---|
| North America | North America accounts for an estimated ~37% of 2026 global revenue, with its competitive position influenced by enterprise identity and regulated financial services. For North America, the regional allocation represents spending on paid digital controls, not the economic cost of incidents. Buyers also consider federal and sector procurement assurance when comparing vendors and deployment models. | The modeled ~11.6% CAGR for North America reflects changing needs in enterprise identity and regulated financial services. Across North America, subscription renewals, specialist service attachment and new identity requirements determine the pace of growth. The North America forecast does not assume that every breach produces a new contract, and the outlook should be interpreted alongside country-specific purchasing constraints. | Within North America, the most relevant demand mechanisms arise from enterprise identity and regulated financial services. Security leaders operating in North America must decide how to coordinate user authentication, privileged access, telemetry analysis and response across their operating environments. Security spending in North America is therefore driven by integration requirements and the availability of accountable service partners rather than by a uniform global technology rollout. | For North America, a decisive market access condition is federal and sector procurement assurance. Enterprises buying in North America compare the documentation of access policies, supplier support arrangements, integration with established applications and the evidence generated during incident exercises. Providers serving North America who satisfy these operational criteria can compete on delivered assurance rather than relying exclusively on lists of product features. |
| Asia-Pacific | Asia-Pacific accounts for an estimated ~31% of 2026 global revenue, with its competitive position influenced by mobile banking, cloud adoption and connected manufacturing. For Asia-Pacific, the regional allocation represents spending on paid digital controls, not the economic cost of incidents. Buyers also consider country-specific hosting and procurement conditions when comparing vendors and deployment models. | The modeled ~14.1% CAGR for Asia-Pacific reflects changing needs in mobile banking, cloud adoption and connected manufacturing. Across Asia-Pacific, subscription renewals, specialist service attachment and new identity requirements determine the pace of growth. The Asia-Pacific forecast does not assume that every breach produces a new contract, and the outlook should be interpreted alongside country-specific purchasing constraints. | Within Asia-Pacific, the most relevant demand mechanisms arise from mobile banking, cloud adoption and connected manufacturing. Security leaders operating in Asia-Pacific must decide how to coordinate user authentication, privileged access, telemetry analysis and response across their operating environments. Security spending in Asia-Pacific is therefore driven by integration requirements and the availability of accountable service partners rather than by a uniform global technology rollout. | For Asia-Pacific, a decisive market access condition is country-specific hosting and procurement conditions. Enterprises buying in Asia-Pacific compare the documentation of access policies, supplier support arrangements, integration with established applications and the evidence generated during incident exercises. Providers serving Asia-Pacific who satisfy these operational criteria can compete on delivered assurance rather than relying exclusively on lists of product features. |
| Europe | Europe accounts for an estimated ~23% of 2026 global revenue, with its competitive position influenced by regulated critical services and industrial supply chains. For Europe, the regional allocation represents spending on paid digital controls, not the economic cost of incidents. Buyers also consider nis2 compliance and data protection documentation when comparing vendors and deployment models. | The modeled ~11.2% CAGR for Europe reflects changing needs in regulated critical services and industrial supply chains. Across Europe, subscription renewals, specialist service attachment and new identity requirements determine the pace of growth. The Europe forecast does not assume that every breach produces a new contract, and the outlook should be interpreted alongside country-specific purchasing constraints. | Within Europe, the most relevant demand mechanisms arise from regulated critical services and industrial supply chains. Security leaders operating in Europe must decide how to coordinate user authentication, privileged access, telemetry analysis and response across their operating environments. Security spending in Europe is therefore driven by integration requirements and the availability of accountable service partners rather than by a uniform global technology rollout. | For Europe, a decisive market access condition is nis2 compliance and data protection documentation. Enterprises buying in Europe compare the documentation of access policies, supplier support arrangements, integration with established applications and the evidence generated during incident exercises. Providers serving Europe who satisfy these operational criteria can compete on delivered assurance rather than relying exclusively on lists of product features. |
| South America | South America accounts for an estimated ~5% of 2026 global revenue, with its competitive position influenced by digital payments and regional enterprise modernization. For South America, the regional allocation represents spending on paid digital controls, not the economic cost of incidents. Buyers also consider local integration and cost-sensitive managed services when comparing vendors and deployment models. | The modeled ~13.0% CAGR for South America reflects changing needs in digital payments and regional enterprise modernization. Across South America, subscription renewals, specialist service attachment and new identity requirements determine the pace of growth. The South America forecast does not assume that every breach produces a new contract, and the outlook should be interpreted alongside country-specific purchasing constraints. | Within South America, the most relevant demand mechanisms arise from digital payments and regional enterprise modernization. Security leaders operating in South America must decide how to coordinate user authentication, privileged access, telemetry analysis and response across their operating environments. Security spending in South America is therefore driven by integration requirements and the availability of accountable service partners rather than by a uniform global technology rollout. | For South America, a decisive market access condition is local integration and cost-sensitive managed services. Enterprises buying in South America compare the documentation of access policies, supplier support arrangements, integration with established applications and the evidence generated during incident exercises. Providers serving South America who satisfy these operational criteria can compete on delivered assurance rather than relying exclusively on lists of product features. |
| Middle East & Africa | Middle East & Africa accounts for an estimated ~4% of 2026 global revenue, with its competitive position influenced by government digital services, banking and infrastructure. For Middle East & Africa, the regional allocation represents spending on paid digital controls, not the economic cost of incidents. Buyers also consider national assurance rules and trusted local service partners when comparing vendors and deployment models. | The modeled ~11.4% CAGR for Middle East & Africa reflects changing needs in government digital services, banking and infrastructure. Across Middle East & Africa, subscription renewals, specialist service attachment and new identity requirements determine the pace of growth. The Middle East & Africa forecast does not assume that every breach produces a new contract, and the outlook should be interpreted alongside country-specific purchasing constraints. | Within Middle East & Africa, the most relevant demand mechanisms arise from government digital services, banking and infrastructure. Security leaders operating in Middle East & Africa must decide how to coordinate user authentication, privileged access, telemetry analysis and response across their operating environments. Security spending in Middle East & Africa is therefore driven by integration requirements and the availability of accountable service partners rather than by a uniform global technology rollout. | For Middle East & Africa, a decisive market access condition is national assurance rules and trusted local service partners. Enterprises buying in Middle East & Africa compare the documentation of access policies, supplier support arrangements, integration with established applications and the evidence generated during incident exercises. Providers serving Middle East & Africa who satisfy these operational criteria can compete on delivered assurance rather than relying exclusively on lists of product features. |
Competitive Landscape
Competition in digital security control systems spans identity and authentication specialists, integrated security-platform suppliers, cryptographic infrastructure providers and managed response operators. Current supplier identities differ from several historical names retained in the published company-profile coverage. Buyers increasingly compare interoperable controls and operating outcomes rather than treating every acquired brand as an independent competitor.
Platform vendors compete through integration of authentication, endpoint telemetry, cloud posture and incident response. Microsoft offers an example of cross-product integration: its March 2025 Security Copilot announcement described six proprietary agents and five partner agents across security workflows. This does not make Microsoft the sole supplier of digital controls; enterprises still assess specialist identity providers, key management and services according to their existing infrastructure and regulatory obligations.
Identity specialists compete on phishing resistance, credential lifecycle, fraud controls and interoperability. The FIDO Alliance Passkey Pledge and Passkey Index show how open authentication approaches can influence product requirements. OneSpan, formerly VASCO Data Security International, provides an example of a supplier whose current corporate identity differs from the historical profile name. Buyers should evaluate the present product and support entity rather than assuming a legacy company name represents a separate operating competitor.
Company lineage is material to a fair competitive comparison. Gemalto and SafeNet products became part of the Thales identity and data-security portfolio, while Oberthur Technologies became part of IDEMIA after its combination with Safran Identity & Security. FireEye enterprise technology was integrated with McAfee Enterprise in the business now known as Trellix. These names can remain in historical profile coverage, but counting each as an independent 2026 supplier would overstate the number of current market participants.
Commercial selection often involves several procurement layers: a platform vendor supplies policy and telemetry software, a cryptographic provider secures keys, and a managed security partner handles operational coverage. Enterprises compare breach-response integration, support availability, geographic data handling and demonstrable identity controls. A supplier with strong software functionality may still require local partners for implementation; conversely, a managed service can differentiate through governance evidence and practical response capability without owning every underlying technology component.
Tier structure
| Tier | Companies | Basis of competition |
|---|---|---|
| Tier 1: integrated platforms | Microsoft Security; Thales; Trellix | Integrated suppliers compete on enterprise-scale control integration, security analytics, identity governance and response workflow compatibility. The distinction between platform software and historical acquired brands matters: current support organizations, license terms and deployment architecture should be assessed in 2026. A leading supplier must demonstrate cross-product policy consistency, not merely a large count of individual security functions. |
| Tier 2: identity specialists | IDEMIA; OneSpan | Specialists focus on trusted identities, authentication, credential lifecycle and transaction integrity, with opportunities in financial services, telecommunications and regulated organizations. They compete through integration quality, cryptographic assurance and the ability to support legacy migrations. Their narrower product scope should not be confused with an inability to serve large customers, because identity is often a core control in broader security architectures. |
| Tier 3: historical and ecosystem | Gemalto N.V.; FireEye Inc.; Oberthur Technologies; SafeNet Inc.; VASCO Data Security International Inc. | These historical names remain useful for tracing company-profile continuity, but their former independent corporate structures do not describe the current competitive landscape. Gemalto and SafeNet connect to Thales, FireEye enterprise lineage to Trellix, Oberthur to IDEMIA and VASCO to OneSpan. The tier is a reference category, not a claim that the named legacy entities currently sell independent security-control platforms. |
Key companies profiled
- Gemalto N.V. (historical; Thales lineage)
- FireEye Inc. (historical enterprise lineage; Trellix)
- Oberthur Technologies (historical; IDEMIA lineage)
- SafeNet Inc. (historical; Thales lineage)
- VASCO Data Security International Inc. (renamed OneSpan)
Production Capacity Analysis
Digital security control systems are produced through a combination of software engineering, cloud service operation, specialized cryptographic hardware manufacturing and trained security-service capacity. Traditional factory output is only one constraint: release quality, operational telemetry processing and the availability of qualified responders determine how much demand can be served reliably. This requires coordination among product engineers, channel integrators and the teams responsible for maintaining deployed security policies.
Software capacity is expressed through development resources, deployment automation, supported tenants and security operations infrastructure rather than a count of physical units. Identity and monitoring suppliers must maintain update pipelines, threat-detection content and cloud-service resilience while satisfying enterprise change-control requirements. The introduction of supervised security agents in March 2025 illustrates a shift toward software functions that can scale across customers, provided organizations retain control of approvals, logging and incident escalation.
Hardware capacity remains relevant for cryptographic modules, authentication devices and dedicated security gateways. Suppliers need secure component sourcing, manufacturing quality control, key provisioning and product certification where customers demand it. Geographic diversification can reduce logistics risk, but a device shipped without supported firmware, credential management or a compatible policy platform has limited commercial utility. Consequently, hardware production plans must be coordinated with software compatibility and channel-service availability.
The most difficult capacity constraint can be qualified implementation and response labor. A customer may purchase a cloud license quickly yet need months to reconcile identities, privileged roles, logging rules and retention policies across subsidiaries. Managed security providers can aggregate specialist staffing, but service quality depends on onboarding, threat context and escalation responsibilities. Revenue growth therefore depends on delivering working controls and sustained response capability, not solely on increasing license inventory or manufacturing throughput.
Market Dynamics
Market dynamics reflect recurring risk-management spending, security architecture consolidation and changes in regulatory accountability. The impact estimates below are directional scenario sensitivities rather than additive contributions to the headline market CAGR; actual customer outcomes depend on implementation, renewal behavior and exposure to different security-control categories. These sensitivities describe potential commercial direction rather than measured causal effects on the global forecast.
MARKET DRIVERS
Drivers Impact Analysis*
| Driver | (~) % impact on CAGR forecast | Geographic relevance | Impact timeline |
|---|---|---|---|
| Expansion of cloud identity and application access | +1.8% | Global enterprise and mobile platforms | 2026–2030 |
| Regulated control governance and auditability | +1.2% | North America and Europe | 2026–2032 |
| Passwordless authentication and phishing resistance | +1.0% | Banking, commercial and telecom | 2026–2033 |
| AI-assisted alert triage and response | +1.3% | Mature security operations teams | 2027–2036 |
| Managed security for constrained teams | +0.9% | Asia-Pacific and emerging regions | 2027–2036 |
Identity-centric security spending
As applications move between on-premises systems and cloud services, organizations need consistent rules for who can access data and under what conditions. A single user may operate across dozens of business applications, creating a commercial need for strong authentication, access reviews and incident-linked identity telemetry. The estimated ~49% software share in 2026 reflects the central role of policy platforms, while hardware tokens and service partners remain important for assurance and deployment.
Governance obligations and supplier accountability
NIST Cybersecurity Framework 2.0 added Govern in February 2024, and the European Union continued implementing NIS2 obligations after the October 2024 transposition deadline. These developments raise demand for evidence of control ownership, supplier oversight and incident-handling procedures. Spending can move toward integrated platforms and managed services that make audits easier, but regulatory exposure varies across jurisdictions and should not be converted directly into a market-revenue figure.
Passkeys and stronger authentication
FIDO Alliance activity in 2025 highlights the commercial momentum behind passkeys and phishing-resistant authentication. Adoption can reduce reliance on shared secrets, but enterprise deployment still requires account recovery, accessibility and compatibility with existing devices and applications. Vendors that combine strong sign-in with risk-based access and measurable user experience can expand wallet share, particularly in banking and commercial applications with high account volumes.
Security operations automation
Microsoft announced six Security Copilot agents and five partner agents in March 2025 for security workflows such as phishing triage and conditional-access optimization. These functions may reduce repetitive investigation work when supported by reliable telemetry and human oversight. The commercial driver is not a guarantee of autonomous protection; it is the opportunity to make existing security staff more effective while improving consistency of response and evidence collection.
MARKET RESTRAINTS
Restraints Impact Analysis*
| Restraint | (~) % impact on CAGR forecast | Geographic relevance | Impact timeline |
|---|---|---|---|
| Integration across legacy security products | −1.2% | Global enterprises with mixed estates | 2026–2031 |
| Shortage of qualified incident responders | −0.9% | Managed and in-house security operations | 2026–2034 |
| Procurement and certification delays | −0.8% | Regulated industries and public sector | 2026–2032 |
| Price pressure and tool consolidation | −0.7% | Mature North American and European buyers | 2027–2036 |
Fragmented control environments
A customer may operate several identity stores, endpoint products and cloud environments with inconsistent policy ownership. Adding another security application can increase alerts without improving response if the tools do not share useful context. Integration work delays revenue realization and may encourage buyers to consolidate suppliers. Providers need tested connectors, documented migrations and clear responsibility boundaries to avoid promising security outcomes that cannot be delivered through a fragmented deployment.
Scarcity of skilled security operators
Effective monitoring requires analysts who can interpret alerts, investigate access anomalies and coordinate containment without disrupting essential operations. Smaller enterprises and regional buyers may struggle to staff continuous coverage even when software licenses are affordable. Managed services can relieve this constraint but introduce dependencies on service-level agreements, local-language support and customer-specific context. The shortage therefore affects the mix and timing of demand, not merely the price of security tools.
Complex assurance and data-location requirements
Banking, healthcare and public-sector customers often require evidence of cryptographic controls, data handling and supplier reliability before deploying new systems. Different national rules may affect where logs are stored, who can access them and how incidents are reported. Procurement cycles can extend while legal, security and operational teams reconcile these requirements. Suppliers that cannot explain their service architecture and subcontractor responsibilities face greater friction even when their detection functionality is competitive.
Consolidation and budget scrutiny
Security leaders are under pressure to reduce overlapping licenses and demonstrate practical risk reduction. A new identity or analytics feature may replace an existing product rather than create incremental spending. Buyers also scrutinize recurring charges, usage-based telemetry fees and professional-services costs. Vendors must prove integration benefits and measurable improvements in alert quality, recovery speed or authentication assurance; headline threat statistics alone are insufficient to justify a premium contract.
MARKET OPPORTUNITIES
Converged identity and incident response
An opportunity exists where organizations can connect privileged-access decisions to endpoint and cloud alerts so investigators understand both the user and the affected asset. This requires consistent identity data, logging quality and response approvals. The largest modeled type, software at ~49% of 2026 revenue, provides a recurring platform foundation, while managed services can deliver configuration and ongoing review. Suppliers that solve interoperability problems may expand contracts without replacing every deployed control.
Cloud-to-on-premises policy consistency
Cloud-delivered controls account for an estimated ~58% of the 2026 delivery-mode mix, but the remaining ~42% is associated with on-premises and embedded environments. Enterprises with factories, hospitals or regulated key-management systems often need both. Providers can differentiate by enforcing consistent access policies, preserving local assurance and producing unified audit evidence. Commercial value depends on clear deployment boundaries and tested failover behavior rather than presenting cloud adoption as universal.
Phishing-resistant customer authentication
The 2025 FIDO Passkey Pledge and subsequent adoption reporting create an opportunity for financial and commercial services to redesign authentication around stronger credentials. Banks and online platforms must still manage account recovery, older devices and accessibility, so a staged migration is often more credible than an abrupt password shutdown. Identity suppliers can provide risk assessment, enrollment orchestration and transaction assurance as differentiated services attached to the core authentication technology.
Security controls for AI-enabled workflows
As enterprises adopt AI assistants and agentic processes, permissions, data classification and investigation trails become more complex. Microsoft and Thales published 2025 material addressing new security capabilities and concerns around AI-related exposure. Vendors can extend existing identity and data-security products to protect these workflows, but product claims must be tested against realistic misuse scenarios. Opportunity is strongest where new controls fit established governance rather than creating a separate, unmanaged security silo.
Supply Chain Analysis
The digital security control system value chain links secure hardware components, software development, cloud infrastructure, implementation channels and the organizations operating protected services. Value is captured at different points: device sales, recurring software subscriptions, integration fees and managed security contracts. A coherent security outcome depends on the interfaces between these stages.
Upstream assurance. Cryptographic components, device firmware and identity standards influence product trustworthiness before an enterprise deploys a control. Hardware tokens and key-management modules depend on secure manufacturing and provisioning, while software suppliers rely on libraries, threat intelligence and cloud infrastructure. Procurement should assess update mechanisms, vulnerability response and the provenance of security-critical components. A low-cost device or connector can become expensive if it cannot be patched or integrated into established key lifecycle procedures.
Platform production. Security platforms turn telemetry, identity attributes and policy rules into usable detection and enforcement functions. Engineering teams must test integrations, protect sensitive logs and maintain service reliability while updating threat content. The March 2025 Security Copilot agent announcement illustrates how new software functions can be added to an existing platform. These features still depend on accurate customer configuration and approval processes; software production capacity alone does not ensure effective operational protection.
Channel delivery. Large enterprises may contract directly with platform providers, but implementation partners often handle identity migration, policy tuning and local regulatory documentation. Managed security service providers can attach continuous monitoring and incident response to software subscriptions. Channel economics depend on responsibility for onboarding, customer support and renewal. A vendor should distinguish license revenue from professional services and avoid counting the same underlying purchase at multiple levels of the supply chain.
Downstream adoption. Financial institutions, telecommunications networks, healthcare providers and commercial enterprises face different control requirements and purchasing cycles. A hospital prioritizes patient-care continuity and access to clinical systems; a bank emphasizes transaction integrity and fraud response; a manufacturer must secure distributed operations. The market grows when products can meet these requirements with measurable assurance and manageable operating costs, rather than when a single generic control package is imposed across all industries.
Recent Developments in Digital Security Control Systems
- 2026 Published
IBM published updated India data-breach research reporting an average cost of INR 255 million in its 2026 sample. This measure is a breach-cost observation, not a digital-security-control revenue estimate. It is relevant because enterprises can evaluate whether identity assurance, monitoring and incident response investments reduce operational exposure. The commercial implication is greater scrutiny of integrated controls and response evidence rather than automatic conversion of loss figures into security-platform sales. Source - 2025-10 Published
The FIDO Alliance released its 2025 Passkey Index, reviewing passwordless authentication adoption across prominent consumer and enterprise services. The index gives buyers a benchmark for understanding implementation progress, but does not eliminate the need for account recovery, accessibility and device compatibility. Authentication suppliers can use the evidence to frame migrations toward phishing-resistant credentials, while commercial security teams must assess how passkeys interact with conditional access and incident investigations. Source - 2025-08-07 Published
IBM reported that the average data-breach cost in its India study reached INR 220 million in 2025, with phishing identified as a prominent initial attack vector. The publication documents organizational exposure rather than vendor revenue. It matters to security-control procurement because better credential assurance, threat correlation and rehearsed response processes can be assessed as specific investments, especially for financial and commercial organizations handling sensitive customer records. Source - 2025-05 Published
Thales published its 2025 Data Threat Report and described concerns about rapidly changing generative AI ecosystems and investment in specialized protection. The findings highlight demand for access governance, data security and cryptographic controls as enterprises expand AI use. Buyers still need to distinguish survey intentions from realized spending and to evaluate whether new AI safeguards work with existing security architecture and regulatory data-handling requirements. Source - 2025-05-01 Announced
The FIDO Alliance used World Passkey Day 2025 to describe wider passwordless adoption and the growing participation of online services. This is a verifiable authentication development, not a forecast of market revenue. The implication for banks and digital platforms is that phishing-resistant sign-in can become a practical part of customer identity strategy, provided suppliers support account recovery, device diversity and reliable user enrollment. Source - 2025-03-24 Announced
Microsoft announced six Security Copilot agents and five partner agents for preview in April 2025, covering security tasks such as phishing triage and identity-policy optimization. The development demonstrates how software vendors are extending detection and response platforms with supervised automation. Enterprise customers should assess telemetry coverage, human approvals and audit trails before assuming such agents reduce incident risk or staffing needs in every environment. Source - 2024-11 In force
The European Commission called on 23 Member States to complete transposition of the NIS2 Directive after the October 2024 deadline. The regulatory action is relevant to security-control providers because affected organizations need to review risk management, supply-chain security and incident responsibilities. Demand may favor platforms and services that produce documented evidence, although the directive does not prescribe a single vendor or guarantee a specific spending increase. Source - 2024-02-26 Published
The United States National Institute of Standards and Technology released Cybersecurity Framework 2.0, broadening its audience and introducing the Govern function alongside Identify, Protect, Detect, Respond and Recover. The framework creates a common vocabulary for organizations comparing security controls and assigning accountability. Suppliers can align product reporting and implementation services with these functions, but the publication itself is guidance rather than a compulsory purchase requirement. Source
REPORT SCOPE & SEGMENTATION
| Attribute | Details |
|---|---|
| Study Period | 2021–2036 |
| Base Year | 2026 |
| Estimated Year | 2027 |
| Forecast Period | 2027–2036 |
| Historical Period | 2021–2025 |
| Market Size 2026 | USD 57,935 million |
| Market Size 2027 | USD 65,124 million |
| Market Size 2036 | USD 186,614 million |
| Growth Rate | CAGR of 12.4% from 2027–2036 |
| Unit | Revenue (USD million) |
| Segmentation | By Type, By Application, By Delivery Mode and By Region |
| By Type | Hardware · Software · Service |
| By Application | Mobile Security & Telecommunication · Finance & Banking · Healthcare · Commercial · Others |
| By Delivery Mode | Cloud-delivered security controls · On-premises and embedded controls |
| By Region | Each regional estimate covers Type, Application and Country. Shares are modeled estimates for 2026. North AmericaUnited States, Canada, Mexico EuropeGermany, United Kingdom, France, Netherlands, Rest of Europe Asia-PacificChina, India, Japan, South Korea, Rest of Asia-Pacific South AmericaBrazil, Argentina, Chile, Rest of South America Middle East & AfricaUnited Arab Emirates, Saudi Arabia, South Africa, Rest of Middle East & Africa |
| Key Companies Profiled | Gemalto N.V. (historical; Thales lineage), FireEye Inc. (historical; Trellix lineage), Oberthur Technologies (historical; IDEMIA lineage), SafeNet Inc. (historical; Thales lineage), VASCO Data Security International Inc. (historical; OneSpan lineage) |
| Customization Scope | Report customization may add country-specific applications, security-control delivery architectures, supplier benchmarking and procurement conditions, subject to defined scope and availability of relevant evidence. |
Frequently Asked Questions
What is the global digital security control system market size?
The global digital security control system market was valued at USD 57,935 million in 2026 and is projected to reach USD 186,614 million by 2036, representing a CAGR of 12.4% over 2027–2036. The revenue boundary includes security-control hardware, paid software and directly related implementation or managed services. It excludes general IT spending, physical-only surveillance and the financial cost of cyber incidents.
Which type accounts for the largest revenue share?
Software is the largest modeled type, representing ~49% of global digital security control system revenue in 2026. Hardware contributes an estimated ~28%, while services account for ~23%. Software leads because identity policy, monitoring analytics and orchestration are commonly sold through recurring licenses. Hardware remains necessary for secure key custody and authentication, while services support deployment and ongoing response.
Which application is the largest purchaser?
Commercial organizations represent the largest modeled application at ~31% of 2026 revenue, followed by finance and banking at ~28%, mobile security and telecommunication at ~20%, healthcare at ~13% and other uses at ~8%. These categories reflect different procurement needs: commercial buyers seek integration, banks prioritize transaction integrity, and healthcare providers require reliable access to sensitive clinical information.
Which region leads the digital security control system market?
North America leads with an estimated ~37% of 2026 revenue, compared with ~31% for Asia-Pacific, ~23% for Europe, ~5% for South America and ~4% for Middle East & Africa. The regional model reflects enterprise security procurement, governance obligations and supplier reach. These shares are analytical estimates, not audited geographic revenue disclosures by every market participant.
Which region is expected to grow fastest?
Asia-Pacific is modeled to expand at ~14.1% CAGR through 2036, ahead of South America at ~13.0%, North America at ~11.6%, Middle East & Africa at ~11.5% and Europe at ~11.2%. Growth is associated with mobile banking, cloud adoption and expanding enterprise controls. Country-specific regulatory and procurement conditions mean that regional rates should not be applied mechanically to every national market.
How are hardware, software and services different?
Hardware includes cryptographic modules, authentication tokens and purpose-built gateways. Software provides identity policies, telemetry analytics, access governance and incident workflows. Services include integration, configuration, managed monitoring and response. The three types address related but distinct functions, and buyers frequently purchase them together. Revenue is assigned once to the corresponding product or service to avoid double counting an integrated deployment.
What is the role of passkeys in market growth?
Passkeys can strengthen authentication by reducing dependence on reusable passwords and supporting phishing-resistant sign-in. The FIDO Alliance expanded industry coordination through its 2025 Passkey Pledge and related adoption reporting. Enterprise benefits depend on secure enrollment, account recovery, interoperability and accessible user experience. Passkeys are therefore one important identity-control capability, not a replacement for endpoint monitoring, encryption or incident response.
How does artificial intelligence affect security-control spending?
AI-enabled security functions can help prioritize alerts, correlate incidents and recommend changes to access policy. Microsoft announced Security Copilot agents in March 2025, while Thales published research on concerns around AI-related data exposure. Buyers should distinguish tested operational capabilities from marketing claims and preserve human oversight, logging and escalation rules. AI can expand software functionality without removing the need for foundational identity and data controls.
What are the main restraints on market expansion?
Integration complexity, skilled-personnel shortages, procurement assurance requirements and software consolidation can slow purchasing. Enterprises may own multiple identity stores and monitoring products that do not share consistent context, making deployment more expensive than licensing alone. Regulated customers also need evidence about key custody, data location and incident processes. Vendors that simplify integration and demonstrate control effectiveness are better positioned to convert demand into sustained revenue.
What is included in the report scope?
The study covers global digital security control system revenue from hardware, software and related services, segmented by Type, Application, Delivery Mode and Region across the 2026 base year and 2036 forecast horizon. It includes identity assurance, encryption, threat monitoring, policy control and response functions. It excludes cybercrime losses, purely physical surveillance, general-purpose IT infrastructure and non-security services that do not directly implement digital controls.
Research Sources & Evidence Base

Get Sample Report PDF for Exclusive Insights
Report Sample Includes
- Table of Contents
- List of Tables & Figures
- Charts, Research Methodology, and more...
 Download Sample Report PDF