MARKET INSIGHTS
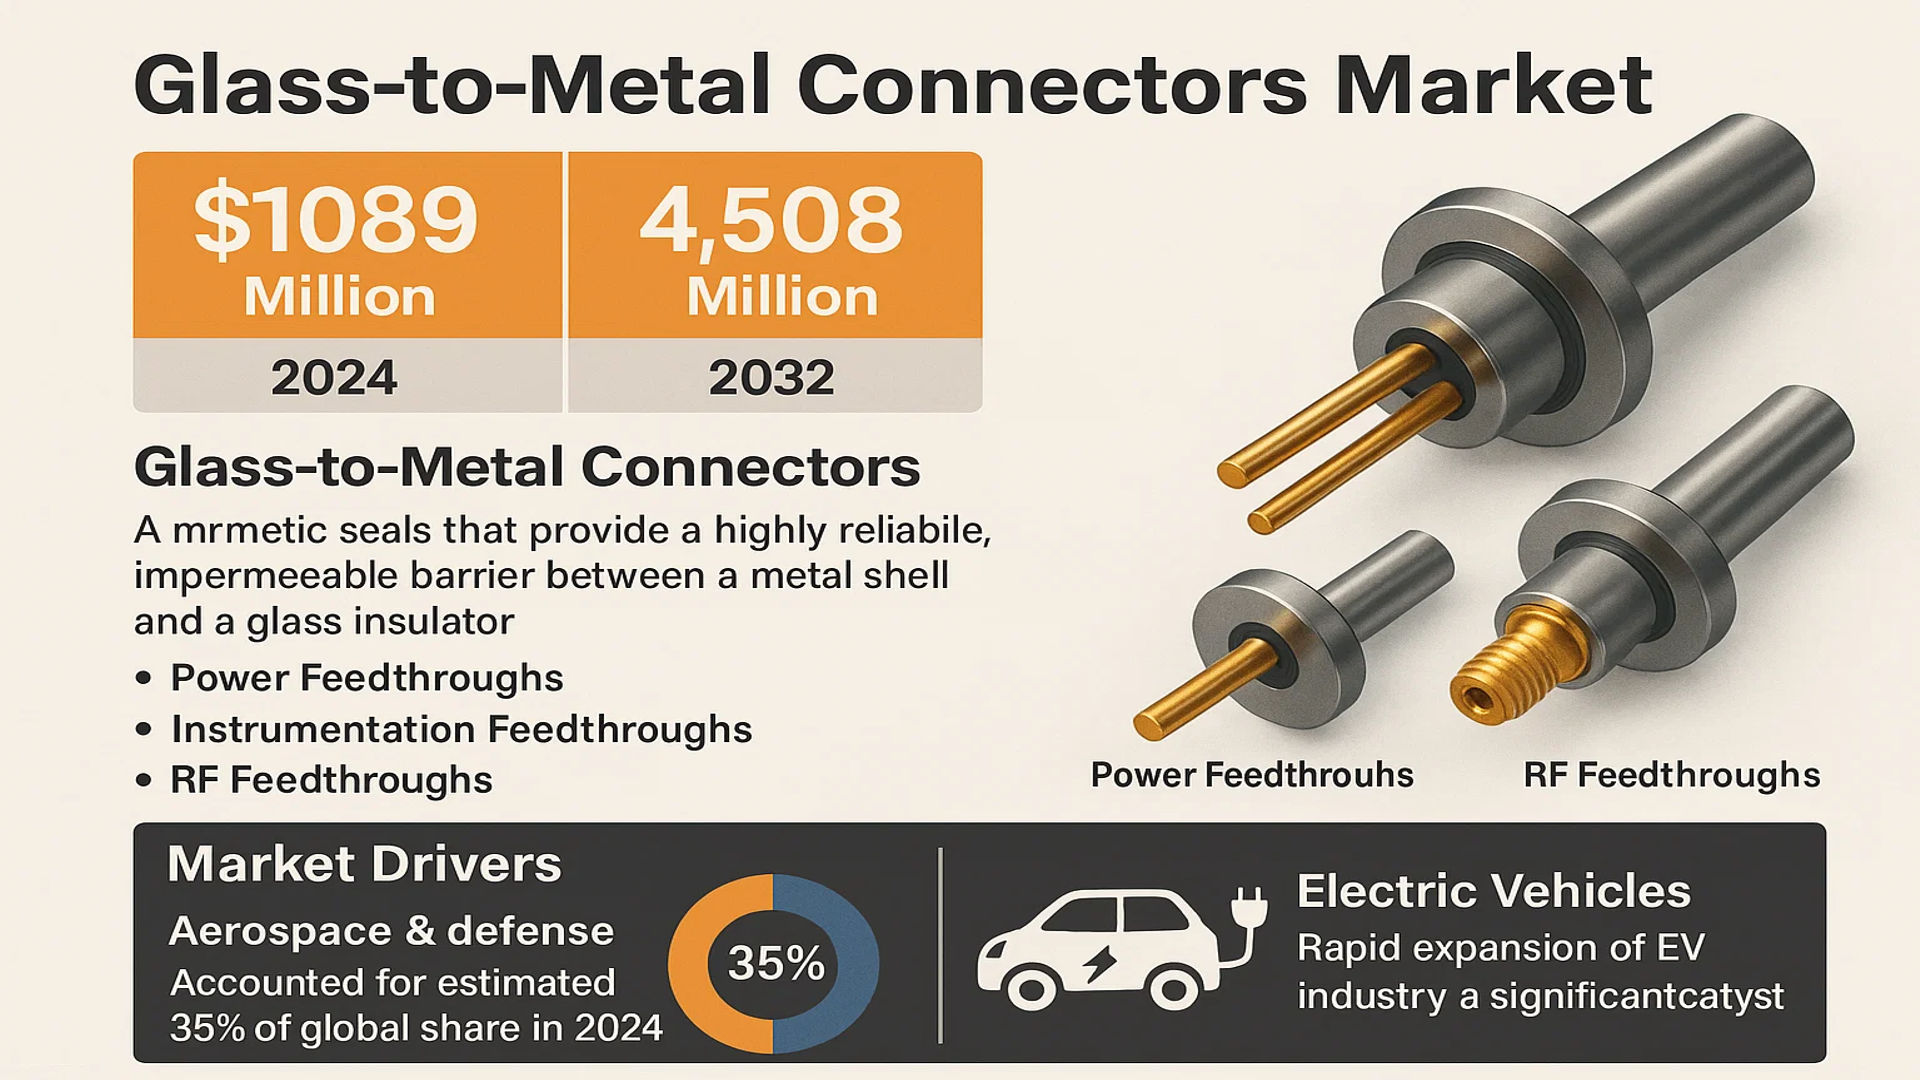
The global Glass-to-Metal Connectors Market was valued at 1089 million in 2024 and is projected to reach US$ 1508 million by 2032, at a CAGR of 4.9% during the forecast period.
Glass-to-Metal Connectors are a specialized class of hermetic seals that provide a highly reliable, impermeable barrier between a metal shell and a glass insulator. These components are engineered to maintain a hermetic seal under extreme conditions, including high pressure, wide temperature fluctuations, and corrosive environments. Key product types include Power Feedthroughs, Instrumentation Feedthroughs, and RF Feedthroughs.
The market growth is primarily driven by robust demand from the aerospace and defense sector, which accounted for an estimated 35% of the global market share in 2024. Furthermore, the rapid expansion of the electric vehicle (EV) industry is a significant catalyst, as these connectors are critical for ensuring the safety and longevity of high-voltage battery packs. Technological advancements enabling miniaturization and higher performance specifications are also propelling adoption across medical and industrial applications. Key market players such as Schott, TE Connectivity, and AMETEK continue to innovate, with recent developments focusing on enhancing power density and environmental resistance to meet the evolving demands of next-generation technologies.
MARKET DYNAMICS
MARKET DRIVERS
Rising Demand from Aerospace and Defense Applications to Propel Market Expansion
The aerospace and defense sector represents a primary growth engine for the glass-to-metal connectors market, driven by the critical need for components that ensure reliability in extreme environments. These connectors provide exceptional hermetic sealing, maintaining performance under high pressure, extreme temperatures, and corrosive conditions encountered in aviation, space exploration, and military systems. The global aerospace industry’s sustained growth, with commercial aircraft deliveries projected to increase steadily and defense spending exceeding $2.2 trillion annually worldwide, creates substantial demand. Modern aircraft systems, satellite constellations, and unmanned aerial vehicles increasingly incorporate sophisticated electronics that require robust interconnection solutions. For instance, the expansion of low-earth orbit satellite networks, with thousands of new satellites launched annually, relies heavily on glass-to-metal connectors for their proven performance in vacuum conditions and resistance to thermal cycling.
Electric Vehicle Revolution Accelerating Adoption in Automotive Sector
The rapid transition to electric vehicles represents a significant growth opportunity for glass-to-metal connectors, particularly in battery management systems and power electronics. These connectors provide essential hermetic sealing that protects sensitive components from moisture, chemicals, and thermal stress in high-voltage applications. With global electric vehicle sales surpassing 10 million units annually and projected to reach 30% of all vehicle sales by 2030, the demand for reliable sealing solutions continues to intensify. Battery manufacturers increasingly specify glass-to-metal connectors for their ability to maintain integrity under the thermal expansion differences between battery casing materials and electrical feedthroughs. The automotive industry’s shift toward 800-volt architecture systems further drives adoption, as these higher voltage systems require enhanced insulation and sealing properties that glass-to-metal connectors expertly provide.
Medical Device Innovation Creating New Application Frontiers
Advancements in medical technology are driving substantial growth in glass-to-metal connector applications, particularly in implantable devices and diagnostic equipment. These connectors enable reliable performance in sterilizable environments and provide essential biocompatibility for medical applications. The global medical device market, valued at approximately $500 billion and growing at over 5% annually, increasingly incorporates sophisticated electronic systems that require hermetic sealing. Implantable devices such as pacemakers, neurostimulators, and cochlear implants utilize glass-to-metal connectors to maintain electrical integrity while preventing fluid ingress. Furthermore, diagnostic imaging equipment including MRI machines and CT scanners employ these connectors to ensure signal integrity in electromagnetically challenging environments. The aging global population and increasing healthcare expenditure worldwide continue to drive innovation in medical technology, subsequently increasing demand for reliable interconnection solutions.
MARKET RESTRAINTS
High Manufacturing Costs and Complex Production Processes Limiting Market Penetration
The specialized nature of glass-to-metal connector manufacturing presents significant cost barriers that restrain market growth. These components require precisely controlled thermal expansion matching between glass and metal materials, necessitating sophisticated manufacturing equipment and highly controlled production environments. The manufacturing process involves multiple precision steps including glass formulation, metal preparation, thermal sealing, and rigorous testing, each adding to the final product cost. This results in glass-to-metal connectors typically costing 3-5 times more than standard industrial connectors, making them prohibitive for cost-sensitive applications. Additionally, the raw materials themselves, particularly specialized glass formulations and corrosion-resistant metals such as kovar and stainless steel, contribute substantially to the overall product cost. These economic factors limit adoption in price-conscious market segments and emerging applications where budget constraints are paramount.
Technical Complexity in Miniaturization Creating Design Challenges
As electronic devices continue to shrink in size while increasing in capability, the miniaturization of glass-to-metal connectors presents significant technical challenges that restrain market expansion. The fundamental physics of glass-to-metal sealing becomes increasingly difficult to manage at smaller scales, where thermal expansion mismatches can cause catastrophic failure. Designing connectors for high-density applications requires exceptional precision in material selection and manufacturing processes. The industry faces particular challenges in developing reliable sub-miniature versions that maintain hermetic integrity while providing adequate electrical performance. Furthermore, testing and validation of miniature glass-to-metal connectors requires specialized equipment and methodologies, adding to development costs and time-to-market. These technical barriers particularly affect emerging applications in consumer electronics and portable medical devices where space constraints are severe and reliability requirements remain uncompromised.
Supply Chain Vulnerabilities and Raw Material Dependencies Restricting Market Stability
The glass-to-metal connectors market faces significant constraints from supply chain dependencies on specialized raw materials and manufacturing expertise. Production relies on specific glass formulations with precisely controlled thermal expansion properties and specialty metals that must exhibit compatible characteristics. Many of these materials come from limited sources, creating vulnerability to supply disruptions and price volatility. The manufacturing process itself requires specialized knowledge that has been developed over decades, creating a barrier to new market entrants and limiting production capacity expansion. Furthermore, the equipment used in glass-to-metal sealing represents significant capital investment, making it difficult for manufacturers to quickly scale production in response to demand fluctuations. These factors combine to create a market that is somewhat inflexible and vulnerable to external shocks, potentially limiting growth during periods of economic uncertainty or supply chain disruption.
MARKET CHALLENGES
Intense Competition from Alternative Sealing Technologies Threatening Market Position
Glass-to-metal connectors face increasing competition from emerging sealing technologies that challenge their traditional market dominance in high-reliability applications. Epoxy-based sealing systems, ceramic-to-metal connectors, and advanced polymer composites continue to improve in performance while offering cost advantages and manufacturing flexibility. These alternative technologies have made significant strides in achieving acceptable levels of hermeticity for many applications, particularly in less demanding environments. The development of nano-composite materials and advanced adhesive systems has enabled alternative sealing methods to approach the performance characteristics of glass-to-metal seals in certain parameters. This competitive pressure forces glass-to-metal connector manufacturers to continuously innovate while facing pressure on pricing, particularly in applications where absolute maximum performance is not required but cost sensitivity is high.
Other Challenges
Regulatory Compliance Complexity
Navigating the complex regulatory landscape presents significant challenges for glass-to-metal connector manufacturers, particularly for medical and aerospace applications. Compliance with standards such as MIL-DTL-38999 for military applications and ISO 13485 for medical devices requires extensive documentation, rigorous testing protocols, and ongoing quality assurance processes. The certification process for new connector designs can take months or even years, delaying time-to-market and increasing development costs. Furthermore, different regions maintain their own regulatory requirements, creating additional complexity for global market participants.
Technical Standardization Issues
The lack of universal technical standards across different applications and regions creates interoperability challenges and increases development costs. While organizations such as the International Electrotechnical Commission and various military standards bodies provide guidelines, many applications require custom solutions. This standardization challenge particularly affects emerging technology sectors where application requirements are still evolving and established standards have not yet been developed, creating uncertainty for both manufacturers and end-users.
MARKET OPPORTUNITIES
Renewable Energy Sector Expansion Creating New Growth Frontiers
The rapid global transition to renewable energy systems presents substantial growth opportunities for glass-to-metal connectors, particularly in solar energy and energy storage applications. Grid-scale battery storage systems, which are projected to grow at over 30% annually, require robust electrical interconnections that can withstand harsh environmental conditions and provide long-term reliability. Glass-to-metal connectors offer ideal solutions for battery management systems where they maintain electrical isolation while preventing moisture ingress that could compromise system safety and performance. Similarly, solar energy systems, particularly concentrated solar power applications, utilize these connectors in sensors and control systems that operate under extreme temperature variations. The global commitment to carbon reduction targets continues to drive investment in renewable energy infrastructure, creating sustained demand for high-reliability components.
5G Infrastructure Deployment Driving Demand for High-Frequency Applications
The global rollout of 5G networks and associated infrastructure creates significant opportunities for glass-to-metal connectors in RF and microwave applications. These connectors provide excellent performance at high frequencies while maintaining hermetic integrity in outdoor environments. The need for weather-sealed connections in base station equipment, small cells, and other telecommunications infrastructure drives adoption of glass-to-metal solutions. With thousands of new 5G base stations being deployed monthly worldwide and the Internet of Things ecosystem expanding rapidly, the demand for reliable high-frequency interconnections continues to grow. Glass-to-metal connectors specifically designed for RF applications offer low signal loss and stable impedance characteristics, making them ideal for these demanding applications.
Emerging Industrial IoT Applications Creating New Market Segments
The industrial Internet of Things revolution presents substantial growth opportunities for glass-to-metal connectors in harsh environment sensing and control applications. These connectors enable reliable operation in industrial settings where equipment faces exposure to chemicals, extreme temperatures, and mechanical stress. Applications in industrial automation, process control, and condition monitoring increasingly require interconnection solutions that can maintain performance in challenging environments while providing long-term reliability. The expansion of smart manufacturing facilities and the increasing automation of industrial processes drive demand for components that can withstand operational stresses while ensuring data integrity. Glass-to-metal connectors meet these requirements effectively, positioning them for growth as industrial IoT applications continue to expand across multiple sectors including oil and gas, chemical processing, and heavy manufacturing.
GLASS-TO-METAL CONNECTORS MARKET TRENDS
Expansion in Aerospace and Defense Applications to Emerge as a Trend in the Market
The aerospace and defense sector remains the primary driver for the glass-to-metal connectors market, accounting for over 40% of the global demand. These hermetic seals are indispensable in applications requiring extreme reliability under harsh conditions, such as satellites, avionics systems, and undersea vehicles. The global increase in defense expenditure, which surpassed $2.2 trillion in 2023, directly fuels the procurement of advanced military equipment utilizing these high-performance interconnects. Furthermore, the burgeoning space economy, with over 1,800 satellites launched in 2022 alone, creates a sustained need for components that can withstand the vacuum of space, intense vibration, and thermal cycling. This trend is further amplified by the miniaturization of electronic systems, which demands connectors that offer a superior seal in an increasingly compact form factor without compromising on performance or longevity.
Other Trends
Electrification of the Automotive Sector
The rapid transition towards electric vehicles (EVs) is a significant growth vector for the glass-to-metal connectors market. These connectors are critical for ensuring the hermetic integrity of battery management systems (BMS), onboard chargers, and high-voltage distribution units within an EV. With global EV sales projected to reach 17 million units by 2024, the demand for reliable sealing solutions that prevent moisture ingress and ensure operational safety is paramount. The connectors’ ability to maintain a stable seal across a wide temperature range, from -55°C to over 200°C, makes them ideally suited for the thermally demanding environments found in electric powertrains. This trend is not just about volume but also about technological advancement, as next-generation batteries with higher energy densities place even greater emphasis on the reliability of every enclosed component.
Advancements in Medical Device Manufacturing
The medical industry is increasingly adopting glass-to-metal seals for a growing array of implantable and life-sustaining devices. This trend is driven by the critical need for absolute biocompatibility and long-term hermeticity in devices such as pacemakers, neurostimulators, and implantable sensors. The global market for active implantable medical devices is expected to grow significantly, necessitating components that can last for decades inside the human body without failure. Glass-to-metal connectors provide an inert barrier that prevents bodily fluids from corroding sensitive electronics while also allowing for the reliable passage of electrical signals. This application demands the highest levels of manufacturing precision and material purity, leading to continuous innovation in sealing techniques and glass formulations to meet stringent regulatory standards from bodies like the FDA and EMA.
Industrial Automation and Harsh Environment Demands
Industrial automation and the rise of Industry 4.0 are propelling the use of glass-to-metal connectors in manufacturing and process control environments. Sensors and communication modules deployed in harsh industrial settings—subject to extreme temperatures, high pressure, corrosive chemicals, and particulate matter—require robust protection. These connectors ensure the sensitive electronics inside are completely isolated from the external environment, guaranteeing signal integrity and operational uptime. The expansion of IoT in industrial applications, with billions of connected devices forecasted, relies on such reliable interconnection solutions. This trend is closely linked to the need for predictive maintenance and real-time data acquisition, where a connector failure could lead to significant production downtime and financial loss, making the investment in high-reliability components like glass-to-metal seals a strategic necessity.
COMPETITIVE LANDSCAPE
Key Industry Players
Leading Companies Focus on Technological Innovation and Strategic Expansion to Secure Market Position
The global glass-to-metal connectors market exhibits a semi-consolidated structure, characterized by a mix of multinational corporations, specialized medium-sized enterprises, and niche players. This dynamic competitive environment is driven by high technical barriers to entry, stringent quality certifications, and the critical need for reliability in end-use applications. Schott AG emerges as a dominant force, leveraging its extensive heritage in glass technology and robust global manufacturing footprint across Europe, North America, and Asia. The company’s leadership is further solidified by its comprehensive portfolio, which serves demanding sectors such as aerospace, medical technology, and high-energy physics.
TE Connectivity and Amphenol Corporation (through its subsidiary Amphenol Martec) also command significant market share. Their strength is derived from massive scale, deep integration into global supply chains, and a relentless focus on research and development. TE Connectivity, for instance, invests heavily in developing miniaturized and high-performance connectors for next-generation electric vehicles and aerospace systems, aligning perfectly with key market growth drivers. Similarly, Amphenol’s strategic acquisitions and expansion of its product lines have allowed it to capture value across both established and emerging application segments.
Furthermore, these established players are actively pursuing growth through geographical expansion into high-growth regions like Asia-Pacific and strategic product launches tailored for evolving industry needs, such as connectors for EV battery systems and 5G infrastructure. These initiatives are anticipated to further consolidate their market positions throughout the forecast period.
Meanwhile, specialized players like Emerson Fusite and Radiall are strengthening their standing by concentrating on high-reliability niches and custom solutions. Emerson Fusite, with its deep expertise in hermetic sealing for compressors and harsh environments, and Radiall, a recognized leader in RF connectivity for defense and aerospace, compete through technological specialization and proven product performance. Their strategy involves significant investments in advanced manufacturing processes and materials science to meet the increasingly rigorous specifications of their clients.
List of Key Glass-to-Metal Connector Companies Profiled
- SCHOTT AG (Germany)
- TE Connectivity Ltd. (Switzerland)
- AMETEK, Inc. (U.S.)
- Emerson Fusite (U.S.)
- Amphenol Martec (A subsidiary of Amphenol Corporation) (U.S.)
- Radiall (France)
- Glenair, Inc. (U.S.)
- Winchester Tekna (U.S.)
- Rosenberger Hochfrequenztechnik GmbH & Co. KG (Germany)
- Teledyne Reynolds (U.S.)
- SUNBANK Connection Technologies (China)
- Axon’ Cable (France)
- Dietze Group (Germany)
- Complete Hermetics (U.S.)
Segment Analysis:
By Type
Power Feedthrough Segment Dominates the Market Due to Critical Role in High-Voltage and High-Current Applications
The market is segmented based on type into:
- Power Feedthrough
- Instrumentation Feedthrough
- RF Feedthrough
By Application
Aerospace and Defense Segment Leads Due to Stringent Requirements for Reliability in Extreme Environments
The market is segmented based on application into:
- Aerospace and Defense
- Automotive
- Industrial
- Medical
By Sealing Technology
Kovar Alloy Seals Hold Significant Share Owing to Superior Thermal Expansion Matching with Glass
The market is segmented based on sealing technology into:
- Kovar-to-Glass Seals
- Stainless Steel-to-Glass Seals
- Titanium-to-Glass Seals
- Others
By End-User
Original Equipment Manufacturers (OEMs) Represent the Largest Consumer Base for Integrated Component Solutions
The market is segmented based on end-user into:
- Original Equipment Manufacturers (OEMs)
- Component Distributors
- Research and Development Entities
- Aftermarket Service Providers
Regional Analysis: Glass-to-Metal Connectors Market
Asia-Pacific
The Asia-Pacific region dominates the global glass-to-metal connectors market, accounting for over 45% of total consumption by volume. This leadership position is driven by massive manufacturing infrastructure, particularly in China, Japan, and South Korea, where electronics production and industrial automation are concentrated. The region benefits from robust supply chains for raw materials like kovar alloys and specialized glass powders, enabling competitive production costs. China’s “Made in China 2025” initiative has accelerated demand for high-performance connectors in aerospace, defense electronics, and new energy vehicles. However, the market faces challenges from increasing environmental regulations in countries like Japan and South Korea, which are pushing manufacturers toward more sustainable production processes. The medical device sector is showing particularly strong growth, with countries like India emerging as important manufacturing hubs for diagnostic equipment requiring hermetic sealing.
North America
North America represents a technologically advanced market characterized by stringent quality requirements and high-value applications. The region’s market is driven by substantial defense and aerospace expenditures, with the United States Department of Defense budget exceeding $800 billion annually, creating sustained demand for military-grade hermetic connectors. The medical device sector is another key driver, with the U.S. Food and Drug Administration’s rigorous standards ensuring only the highest reliability connectors are used in implantable medical devices and diagnostic equipment. Recent investments in electric vehicle infrastructure, supported by legislation like the Inflation Reduction Act, are accelerating adoption in automotive applications. While manufacturing costs are higher than in Asia, North American producers maintain competitiveness through technological innovation and focus on high-reliability applications where failure is not an option.
Europe
Europe’s market is characterized by strong environmental regulations and advanced manufacturing capabilities. The EU’s REACH regulations and circular economy action plan have pushed manufacturers toward developing more environmentally sustainable connectors with reduced environmental impact. Germany remains the regional leader, with its strong automotive and industrial equipment sectors driving demand for precision connectors. The aerospace sector, particularly in France and the UK, requires connectors that meet stringent European Aviation Safety Agency standards. Recent energy crisis concerns have accelerated investment in renewable energy infrastructure, creating new opportunities for connectors in solar and wind power applications. European manufacturers face pressure from Asian competitors on price but maintain market share through superior technical performance and compliance with rigorous EU standards.
South America
The South American market is emerging but faces significant challenges due to economic volatility and limited industrial infrastructure. Brazil represents the largest market in the region, driven primarily by aerospace and defense applications, with Embraer’s aircraft manufacturing creating consistent demand for high-quality connectors. The medical device market is growing gradually as healthcare infrastructure improves across the region. However, economic instability and currency fluctuations have hampered investment in local manufacturing capabilities, making the region heavily dependent on imports. Environmental regulations are less stringent than in North America or Europe, though there is growing awareness of sustainability issues. The mining and oil/gas sectors provide some demand for industrial-grade connectors capable of withstanding harsh environments.
Middle East & Africa
This region represents the smallest but growing market for glass-to-metal connectors. Development is uneven, with more advanced economies like Israel, Saudi Arabia, and the UAE driving most demand through their defense, aerospace, and medical sectors. Israel’s sophisticated electronics and defense industries require high-reliability connectors for military applications. The UAE’s space program and growing aerospace ambitions are creating new demand opportunities. Across Africa, development is slower due to limited industrial infrastructure, though South Africa maintains some manufacturing capability for industrial applications. The region shows long-term potential as economies develop and invest more in high-technology sectors, but progress is constrained by limited technical expertise and reliance on imported components.
Report Scope
This market research report provides a comprehensive analysis of the global and regional Glass-to-Metal Connectors markets, covering the forecast period 2025–2032. It offers detailed insights into market dynamics, technological advancements, competitive landscape, and key trends shaping the industry.
Key focus areas of the report include:
- Market Size & Forecast: Historical data and future projections for revenue, unit shipments, and market value across major regions and segments.
- Segmentation Analysis: Detailed breakdown by product type, technology, application, and end-user industry to identify high-growth segments and investment opportunities.
- Regional Outlook: Insights into market performance across North America, Europe, Asia-Pacific, Latin America, and the Middle East & Africa, including country-level analysis where relevant.
- Competitive Landscape: Profiles of leading market participants, including their product offerings, R&D focus, manufacturing capacity, pricing strategies, and recent developments such as mergers, acquisitions, and partnerships.
- Technology Trends & Innovation: Assessment of emerging technologies, integration of AI/IoT, semiconductor design trends, fabrication techniques, and evolving industry standards.
- Market Drivers & Restraints: Evaluation of factors driving market growth along with challenges, supply chain constraints, regulatory issues, and market-entry barriers.
- Stakeholder Analysis: Insights for component suppliers, OEMs, system integrators, investors, and policymakers regarding the evolving ecosystem and strategic opportunities.
Primary and secondary research methods are employed, including interviews with industry experts, data from verified sources, and real-time market intelligence to ensure the accuracy and reliability of the insights presented.
FREQUENTLY ASKED QUESTIONS:
What is the current market size of Global Glass-to-Metal Connectors Market?
-> Glass-to-Metal Connectors Market was valued at 1089 million in 2024 and is projected to reach US$ 1508 million by 2032, at a CAGR of 4.9% during the forecast period.
Which key companies operate in Global Glass-to-Metal Connectors Market?
-> Key players include Schott, AMETEK, TE Connectivity, Emerson Fusite, Amphenol Martec, Radiall, Glenair, Winchester Tekna, Rosenberger, and Teledyne Reynolds, among others.
What are the key growth drivers?
-> Key growth drivers include demand from aerospace and defense sectors, expansion of the electric vehicle industry, advancements in IoT and smart security applications, and the trend towards miniaturization and automation in manufacturing.
Which region dominates the market?
-> North America holds a significant market share due to its strong aerospace and defense sectors, while Asia-Pacific is the fastest-growing region, driven by industrial expansion and automotive manufacturing.
What are the emerging trends?
-> Emerging trends include development of miniaturized and lightweight connectors, integration of advanced materials for enhanced performance, increased adoption in medical devices, and a focus on sustainable and recyclable manufacturing processes.
Get Sample Report PDF for Exclusive Insights
Report Sample Includes
- Table of Contents
- List of Tables & Figures
- Charts, Research Methodology, and more...
 Download Sample Report PDF