SEMICONDUCTOR INSIGHT
MARKET RESEARCH REPORT

GaN on Silicon Technology Market

2026 to 2034
MARKET INTELLIGENCE
ACROSS KEY REGIONS
2026 EDITION
SEMICONDUCTOR Semiconductor Market Research

GaN on Silicon Technology Market

Size, Trends, Business Strategies 2026–2034

◷
UPDATED 30 October 2026
▤
REPORT LENGTH Detailed Report
▣
REPORT CODE dc0a36f3b13c
▯
FORMATS PDF

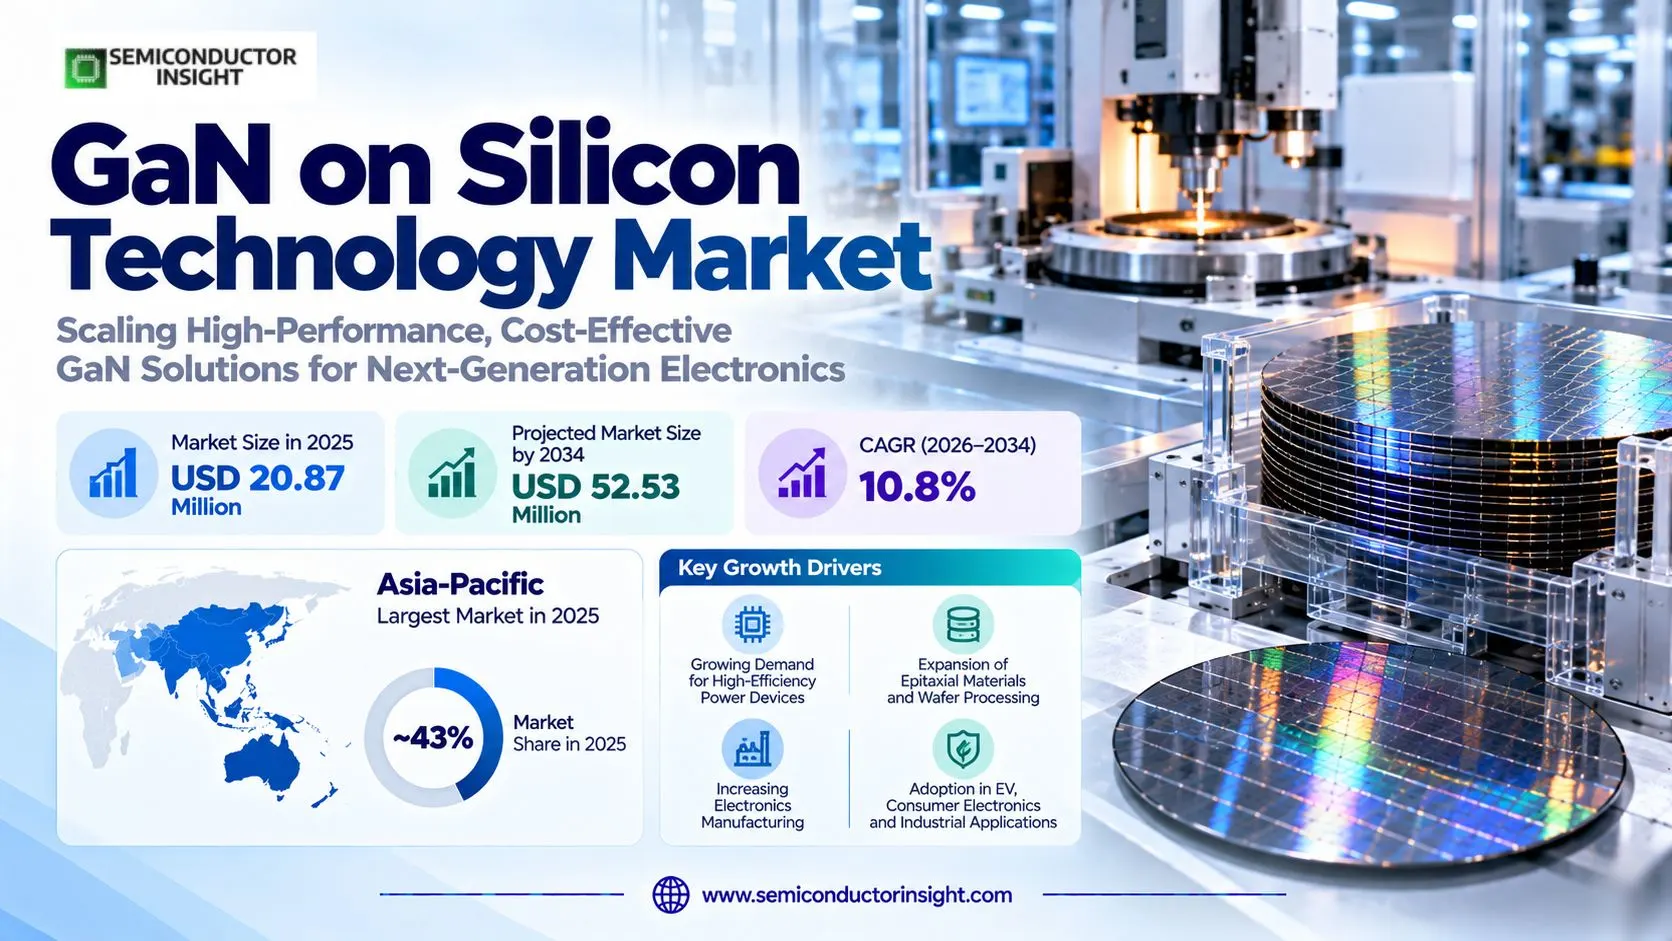
GaN on silicon technology market was valued at USD 20.87 million in 2025 and is projected to reach USD 52.53 million by 2034, registering a CAGR of 10.8% during 2026–2034. Asia-Pacific was the largest market in 2025 at an estimated ~43% share, reflecting its concentration of epitaxial materials production, wafer processing and downstream electronics manufacturing.

Get the sample PDF with study scope, segmentation and methodology details.

Key Statistics

2025 Market Size
USD 20.87 million
2034 Projected Size
USD 52.53 million
CAGR (2026–2034)
10.8%
Largest Market in 2025
Asia-Pacific (~43%)

Key Takeaways

  • Market trajectory: The GaN on silicon technology market reached USD 20.87 million in 2025 and is forecast to attain USD 52.53 million in 2034, advancing at 10.8% CAGR over 2026–2034 as wafer-scale process platforms and device applications mature.
  • 200 mm technology is the largest wafer-diameter category with an estimated ~45% of 2025 value and the fastest modeled type growth at ~11.6%, because established 200 mm silicon processing supports production-ready GaN power device architectures.
  • Consumer electronics leads applications at an estimated ~34% of 2025 market value, while automotive has the strongest modeled growth at ~12.9% as high-voltage GaN-on-silicon technology progresses through vehicle-converter qualification.
  • Asia-Pacific accounts for the largest regional share at an estimated ~43% in 2025 and is modeled to expand ~11.5% annually, supported by epitaxy, wafer processing and electronics supply chains serving global device manufacturers.
  • Epitaxial stress and wafer economics remain the defining technical constraints because mismatched thermal expansion and crystal structures can increase bow, defects and process variation, particularly as manufacturers transition toward larger silicon substrate diameters.

GaN on Silicon Technology Market Overview

GaN on silicon technology market was valued at USD 20.87 million in 2025 and is projected to reach USD 52.53 million by 2034, registering a CAGR of 10.8% during 2026–2034. Asia-Pacific was the largest market in 2025 at an estimated ~43% share, reflecting its concentration of epitaxial materials production, wafer processing and downstream electronics manufacturing.

Base year: 2025 · Estimated year: 2026 · Forecast period: 2026–2034 · Historical period: 2020–2024 · Values in USD million

GaN on silicon technology uses crystalline gallium nitride layers grown on a silicon host wafer to create semiconductor structures that combine GaN electrical characteristics with established silicon wafer-handling infrastructure. A carefully engineered buffer accommodates the lattice and thermal mismatch between the two materials. The platform can support lateral high-electron-mobility transistors, integrated power circuits and selected RF or optoelectronic structures where silicon-based processing creates a commercial advantage.

The market boundary covers GaN-on-silicon epitaxial wafers, qualifying associated device and process technology platforms, and GaN-on-silicon device implementations within the wafer-diameter and application categories. It excludes bare silicon substrates before epitaxy, unrelated GaN-on-SiC or native-GaN wafers, and the full selling price of chargers, vehicles or communications equipment. Development and pilot-platform revenue is included where it forms part of the technology business described by the market anchors.

The core manufacturing difficulty arises during epitaxial growth. Gallium nitride and silicon expand differently under heat and have dissimilar lattice structures, creating stresses that can bend wafers or form defects in the device layers. Graded buffer designs, deposition recipes and substrate orientation are used to control these effects. As wafer diameter increases, uniformity and mechanical handling become increasingly important to device yield and process transfer.

Commercial demand spans fast-charging electronics, industrial power conversion, data-center supplies, automotive auxiliary converters and certain telecommunications devices. These applications do not buy identical wafers: voltage requirements, device layout and thermal conditions determine the epitaxial stack and acceptable defect density. A successful technology platform must therefore demonstrate repeatable device performance across multiple wafers rather than only a high-performing laboratory sample.

The market is entering a manufacturing transition as developers seek to move from established 150 mm and 200 mm platforms toward larger-wafer research and production options. Progress depends on deposition equipment, metrology and semiconductor foundry collaboration, along with the ability to preserve device reliability during process scaling. A larger wafer can improve potential throughput, but the economic benefit materializes only when process yields and customer qualification remain strong. The modeled 2025 diameter mix comprises ~5% for 50 mm, ~15% for 100 mm, ~35% for 150 mm and ~45% for 200 mm platforms, while the 2026 market estimate is USD 23.12 million.

Segment Analysis: By Type

By wafer diameter, GaN on silicon technology is divided into 50 mm, 100 mm, 150 mm and 200 mm categories. The 200 mm class leads with an estimated ~45% of 2025 revenue and modeled ~11.6% CAGR; 150 mm holds ~35% and grows ~10.4%. The 100 mm and 50 mm classes retain specialized and development roles, with modeled annual growth of ~9.6% and ~8.6%, respectively.

Type Function Market position
50 mm The 50 mm format serves small-batch research, process experimentation and specialized epitaxial development where material consumption and equipment flexibility matter more than cost per device. It can support early tests of buffer stacks, contacts and device structures before a design is transferred to larger wafers. Limited surface area restricts production economics, so this diameter is mainly associated with exploratory rather than mainstream high-volume semiconductor manufacturing. Estimated ~5% of 2025 market value. Small wafers remain useful for university laboratories, pilot epitaxy and specialized technology demonstrations, but the economics are unfavorable for broad commercial device output. Their value is tied to rapid experimentation and access to flexible deposition systems. The class is modeled to expand ~8.6% annually, slower than larger-wafer technology as manufacturing investment shifts toward established industrial diameters.
100 mm The 100 mm format provides a bridge between research-scale processing and industrial qualification, offering enough area for multiple device structures while retaining compatibility with older epitaxy and fabrication tools. It is relevant where customers need smaller pilot lots or specialty products with modest volumes. Process engineers can use this diameter to validate uniformity and electrical behavior before committing to more expensive 150 mm or 200 mm transfer. Estimated ~15% share in 2025. This class remains commercially relevant for niche RF, optoelectronic and power-device programs whose volume does not justify the cost of a larger production line. It faces gradual displacement as suppliers modernize equipment and customers request better cost per usable die. Modeled growth of ~9.6% reflects continued specialty demand without assuming that every research program becomes a mass-market product.
150 mm The 150 mm platform supports established GaN-on-silicon process flows and offers a practical production option for companies balancing capital investment with moderate demand. Epitaxy, lithography and testing can be qualified on equipment that has accumulated years of process experience. It remains useful for device designs whose yields or market volumes do not yet warrant conversion to 200 mm infrastructure. Estimated ~35% of 2025 revenue. Existing installed equipment and mature recipes support recurring supply for qualified customers, particularly where process stability matters more than maximum wafer throughput. The diameter is modeled to grow ~10.4% annually as industrial and power-electronics demand increases. However, manufacturers may eventually migrate suitable products to larger wafers when economics and equipment availability justify a process transfer.
200 mm The 200 mm format is a major commercial platform for GaN-on-silicon power electronics because it can use mature silicon wafer-handling, lithography and metrology infrastructure. Uniform epitaxial buffers and low defect density are essential for repeatable electrical performance across the larger surface. It is suitable for industrial and consumer power-device programs that need meaningful volumes and predictable cost per qualified die. Largest category (~45% in 2025). The combination of available equipment and established process know-how makes 200 mm the central scaling route for many GaN-on-silicon technologies. The modeled ~11.6% CAGR is the highest among the four wafer classes, reflecting demand for better wafer economics and transferable device platforms. Future 300 mm research can extend the manufacturing roadmap without changing the four published diameter categories.

Segment Analysis: By Application

The application mix comprises Consumer Electronics, IT and Telecommunication, Automotive, Aerospace and Defense, and Others. Consumer Electronics is largest at an estimated ~34% of 2025 value with modeled ~9.5% CAGR. IT and Telecommunication accounts for ~24% and grows ~10.7%, while Automotive contributes ~19% and is fastest at ~12.9%. Aerospace and Defense represents ~15% with ~11.5% modeled growth; Others holds ~8% at ~9.9%.

Application Demand characteristics
Consumer Electronics Compact adapters, fast chargers and small power supplies motivate GaN-on-silicon development because higher switching frequency can reduce magnetic component size. Semiconductor makers use wafer-platform maturity to deliver predictable device parameters to high-volume electronics customers. Consumer Electronics leads with an estimated ~34% of 2025 technology value, but pricing pressure means suppliers must translate epitaxial yield improvements into lower cost rather than relying only on efficiency claims.
IT and Telecommunication Server power distribution, networking hardware and telecommunications equipment require efficient conversion at several voltage levels. GaN-on-silicon can support integrated stages where silicon-compatible fabrication and compact switching devices are attractive. This application represents an estimated ~24% of 2025 value. Design wins depend on long operating life, thermal behavior and integration with control circuits, making platform reliability a stronger purchase driver than a single laboratory efficiency result.
Automotive Vehicle onboard charging and auxiliary DC/DC conversion offer potential for GaN-on-silicon as power density and cooling become important engineering constraints. Epitaxial quality, wafer traceability and long-term device reliability must meet demanding automotive validation programs. Automotive accounts for an estimated ~19% of 2025 revenue but has the fastest modeled expansion, ~12.9%, as development programs seek manufacturing-ready processes rather than isolated prototype demonstrations.
Aerospace and Defense Space and defense electronics may use GaN-on-silicon for selected power-conversion and specialized RF designs when performance and process availability fit the mission. Radiation effects, long-life qualification and supply continuity can outweigh the lowest manufacturing cost. The segment contributes an estimated ~15% of 2025 value, with modeled ~11.5% annual growth, but procurement remains program-specific and should not be extrapolated from total defense equipment spending.
Others The Others category covers research-oriented industrial, lighting and specialized electronics applications that do not fit the principal customer groups. Technical needs vary from compact motor controls to niche optoelectronic structures, so wafer size and epitaxial stack selection remain project-specific. An estimated ~8% of 2025 value belongs to this category. Growth is modeled at ~9.9%, reflecting incremental diversification rather than a uniform expansion across every possible use.

The application mix shapes process qualification. A consumer charger supplier may prioritize cost and rapid ramp-up, while a vehicle maker asks for extended reliability evidence and a defense integrator needs traceable material history. Foundry and epitaxy providers consequently maintain multiple process recipes rather than a universal GaN-on-silicon wafer specification. The ability to support distinct device structures across the same wafer-handling platform is a commercial differentiator for technology suppliers.
Regional Analysis

Asia-Pacific is the largest GaN on silicon technology market with an estimated ~43% of 2025 value, followed by North America at ~27% and Europe at ~21%. Middle East & Africa accounts for ~5% and South America ~4%. The modeled regional growth rates are ~11.5%, ~10.4%, ~10.6%, ~9.1% and ~8.7%, respectively, reflecting different roles in epitaxy, device design, process research and downstream system adoption.

How do GaN-on-silicon technology capabilities vary by region?

Regional competition is best understood through technology-chain position. Asia-Pacific hosts significant wafer and electronics manufacturing, North America contributes fabless design and high-value computing demand, and Europe combines epitaxy research with industrial qualification. Middle East and Africa projects typically import qualified devices, while South American electronics assemblers rely on external wafer platforms. These different roles produce uneven revenue capture even when end-user equipment is deployed in every region.

Region Position Growth outlook Demand profile What decides supplier selection
Asia-Pacific Largest (~43%) ~11.5% CAGR Epitaxy and electronics supply Wafer yield, scale and process control
North America Second (~27%) ~10.4% CAGR Device design and computing IP, reliability and platform access
Europe Third (~21%) ~10.6% CAGR Collaborative R&D and industry Foundry transfer and automotive qualification
Middle East & Africa Fourth (~5%) ~9.1% CAGR Imported equipment and infrastructure Project supply and service
South America Fifth (~4%) ~8.7% CAGR Imported components and assembly Cost, logistics and technical support

Asia-Pacific LARGEST · ~43% SHARE

Why does Asia-Pacific lead wafer-platform activity?

Asia-Pacific accounts for an estimated ~43% of 2025 GaN-on-silicon technology value because the region combines semiconductor wafer operations with extensive electronics manufacturing. China offers an expanding GaN device and epitaxy ecosystem, Japan contributes materials and reliability expertise, and South Korea supports advanced electronics supply chains. Technology adoption depends on stable wafer quality and cost, while export customers may impose additional process documentation and origin requirements.

Market positionLargest (~43%)
Growth outlook~11.5% CAGR
Demand profileWafer production and demand
Market access gateUniformity and cost per die
Country Position in region What drives demand
China Fabrication ecosystem Chinese GaN technology suppliers benefit from access to device processing, epitaxy equipment and electronics assembly partners. Their challenge is to produce consistent wafer quality across multiple lots while satisfying international customer qualification. Domestic power electronics demand provides a nearby application base, but high-volume export programs require strong process documentation and evidence that the technology can be reproduced beyond one development line.
Japan Materials and reliability Japanese materials and electronics companies contribute expertise in semiconductor substrates, thermal behavior and long-term device testing. The market opportunity lies in high-quality epitaxial structures and process know-how that downstream device makers can qualify. Japanese customers often prioritize stable electrical characteristics and controlled product changes, which can support premium technology offerings despite competition from lower-cost manufacturing regions.
South Korea Electronics integration South Korea links advanced consumer electronics and computing manufacturers with semiconductor engineering capabilities. GaN-on-silicon is attractive when a compact power-stage design can benefit from mature silicon-compatible processing. Device suppliers still need to demonstrate thermal robustness and stable yields, and local electronics companies may select technology platforms through multinational suppliers rather than purchasing epitaxial wafers directly.

Market instances

  • Wafer-scale processing creates a manufacturing feedback loop When epitaxy and device fabrication operate near downstream electronics design teams, process changes can be evaluated rapidly in actual converter circuits. This feedback helps distinguish material defects from packaging and gate-drive problems. Suppliers that document yield improvements across successive wafer lots are better positioned to win long-term manufacturing agreements than firms relying on single-wafer performance records.
  • Larger diameters shift the equipment requirement A move toward 200 mm production increases the importance of wafer bow, uniform deposition and automated handling. Manufacturing cost may improve through greater usable area, but only if electrical yield and reliability remain controlled. This creates demand for advanced epitaxy and metrology tools and favors process platforms that can be transferred between facilities with reproducible results.
  • Automotive qualification encourages long process life Vehicle component programs typically require stable wafer fabrication and tightly controlled changes after approval. Asian device manufacturers seeking automotive customers must therefore maintain traceability and qualification evidence over many production cycles. The market implication is that manufacturing discipline can be more valuable than rapid introduction of unproven wafer recipes, even when laboratory electrical performance appears superior.
In the full report: country-level epitaxial wafer and technology demand for China, Japan, South Korea, India and Southeast Asia, including device platform transfer and production qualification.

North America SECOND · ~27% SHARE

How does North America influence GaN-on-silicon adoption?

North America represents an estimated ~27% of 2025 value and is strongly associated with semiconductor design, high-density computing and specialized power electronics development. Fabless designers can select GaN-on-silicon process platforms from external foundries while retaining their own device architecture and application expertise. The commercial challenge is to secure predictable foundry access and demonstrate reliability across the selected wafer format, not merely to specify an advanced transistor design.

Market positionSecond (~27%)
Growth outlook~10.4% CAGR
Demand profileFabless design and computing
Market access gateFoundry access and IP
Country Position in region What drives demand
United States Device architecture United States semiconductor designers and system companies assess GaN-on-silicon for high-frequency power conversion and integrated device platforms. Many rely on external wafer processing, making foundry process availability and intellectual-property protection central to procurement. AI server power systems provide a demanding application context, but platform revenue should be distinguished from the much larger value of finished computing infrastructure.
Canada Specialized engineering Canadian engineering and electronics organizations contribute to power-system research and product development within global semiconductor supply chains. The GaN-on-silicon opportunity is concentrated in design validation, process collaboration and niche high-performance products rather than broad domestic wafer manufacturing. Suppliers serving these customers must provide application data, reproducible samples and support for qualification through several design iterations.
Mexico Electronics manufacturing Mexico has an electronics and automotive assembly role that connects it to North American power-device customers. GaN-on-silicon technology may reach local factories through components designed and fabricated elsewhere. This makes approved supplier lists, distribution channels and package-level support important, while the underlying wafer platform is generally selected earlier in the semiconductor design and manufacturing chain.

Market instances

  • Fabless sourcing requires stable process design kits A device company using an external GaN-on-silicon foundry needs validated process models, design rules and reliable production capacity. Changes in epitaxy or wafer processing can alter device characteristics and force requalification. Foundries that provide predictable process design kits and long-term support can attract repeat business from customers unable or unwilling to own fabrication plants.
  • AI power creates stringent device targets High-density computing platforms require converters that balance switching speed, electrical efficiency and heat dissipation. GaN-on-silicon can provide suitable device structures when process yield and package integration support the architecture. The addressable technology revenue is tied to qualified semiconductor platforms rather than the entire server or data-center capital budget, preventing inappropriate use of downstream expenditure as market value.
  • IP and qualification shape cross-border collaboration GaN-on-silicon technology includes valuable epitaxial recipes, device structures and process know-how, making intellectual-property terms important in foundry agreements. North American designers may collaborate with wafer manufacturers abroad while retaining product architecture ownership. Customers increasingly seek documented manufacturing continuity and alternative sourcing options, particularly when a device is intended for long-lived industrial or communications equipment.
In the full report: country-level platform sourcing, design activity and applications in the United States, Canada and Mexico, with foundry access and technology qualification coverage.

Europe THIRD · ~21% SHARE

What makes Europe important to GaN-on-silicon process development?

Europe accounts for an estimated ~21% of 2025 technology value and plays an important role in epitaxial research, specialty foundry collaboration and industrial power electronics. Research institutes and semiconductor companies investigate larger wafer formats, buffer engineering and device reliability. Commercial progress depends on translating these capabilities into repeatable foundry platforms that automotive, industrial and computing customers can qualify for long production lifetimes.

Market positionThird (~21%)
Growth outlook~10.6% CAGR
Demand profileResearch and foundry platforms
Market access gateTechnology transfer and yield
Country Position in region What drives demand
Belgium Collaborative research Belgian semiconductor research organizations work with deposition, metrology and foundry partners to develop GaN process modules on larger substrates. The emphasis is on understanding stress, wafer bow, device physics and manufacturability before commercial transfer. This creates technology value through intellectual property and pilot-line services, but a research demonstration should not be confused with an established high-volume device revenue stream.
United Kingdom Epitaxy and device development The United Kingdom has compound semiconductor epitaxy expertise and collaborations aimed at developing manufacturable GaN power platforms. Partnerships between epitaxy suppliers and specialty foundries can offer fabless customers an alternative to building their own processing infrastructure. The commercial requirement is a stable process with predictable yield and qualified device behavior, supported by technical documentation and a credible long-term supply route.
Germany and Austria Power semiconductor manufacturing Germany and Austria contribute semiconductor engineering, equipment and industrial customers that can support GaN-on-silicon adoption. Larger-wafer development aims to use established silicon manufacturing assets where practical. Device makers must still validate reliability, process uniformity and package performance, so the advantage of existing fabrication infrastructure depends on the ability to transfer GaN-specific epitaxy and device steps without disrupting qualified production.

Market instances

  • Collaborative foundry programs broaden platform access When an epitaxy specialist works with a foundry, customers can obtain a more complete device-development route without owning every production step. Such programs can accelerate prototyping and provide a path toward qualified commercial supply. Their success depends on process design kits, repeatability and customer support, rather than the number of announced partnerships alone.
  • Larger-wafer pilots test more than substrate size Moving GaN processing toward 300 mm requires deposition uniformity, wafer mechanical stability and compatible contamination controls. These challenges become more demanding as area increases and existing silicon equipment is adapted. European research activity can reduce technical risk, but commercial economics will be demonstrated only after usable die yield and qualification are measured across production-scale lots.
  • Automotive demand favors documented reliability European vehicle and industrial customers place substantial weight on lifetime performance, product-change control and traceable material sources. A GaN-on-silicon platform must support consistent electrical parameters through thermal cycling and switching stress. This creates opportunities for foundries with mature quality systems, while limiting the speed at which new epitaxial recipes can replace established components in safety-sensitive equipment.
In the full report: regional manufacturing and research analysis for Belgium, the United Kingdom, Germany, Austria, France and other European semiconductor ecosystems.

Middle East & Africa FOURTH · ~5% SHARE

What is the Middle East and Africa role in GaN-on-silicon technology?

Middle East and Africa represent an estimated ~5% of 2025 technology value, with demand mostly entering through imported power electronics, telecommunications systems and industrial equipment. Local wafer fabrication activity is limited relative to leading manufacturing regions, so the direct technology market is smaller than downstream infrastructure expenditure. Buyers focus on equipment reliability, technical support and procurement continuity rather than on selecting epitaxial wafer diameters themselves.

Market positionFourth (~5%)
Growth outlook~9.1% CAGR
Demand profileImported semiconductor content
Market access gateService and project access
Country Position in region What drives demand
Saudi Arabia Infrastructure demand Saudi Arabian industrial and telecommunications projects can incorporate GaN-on-silicon devices through equipment supplied by international OEMs. The underlying wafer technology is usually qualified outside the country, making local demand indirect. High-temperature operating conditions emphasize reliable device packaging and system thermal design, while large procurement programs create uneven order timing across power and communications applications.
United Arab Emirates Advanced systems procurement The United Arab Emirates invests in digital infrastructure and energy systems that can benefit from efficient power conversion. GaN-on-silicon content enters through qualified semiconductor components rather than through local epitaxy production in most applications. Procurement decisions therefore emphasize equipment-vendor support and operating efficiency, with technology-platform revenue captured earlier in the global supply chain.
South Africa Industrial applications South African industrial customers evaluate reliable power conversion and telecommunications equipment under demanding electricity and maintenance conditions. GaN-on-silicon devices may be embedded in imported supplies or communication modules, but local technology purchases are limited by fabrication infrastructure and specialized process skills. Technical training, spare-part availability and demonstrated robustness are important conditions for wider adoption.

Market instances

  • System integration obscures the upstream wafer value A telecom or energy project may purchase equipment containing GaN devices without ever placing a direct order for an epitaxial wafer. The relevant technology revenue is recognized by upstream suppliers and foundries, not by the full local equipment contract. This distinction is essential when evaluating regional market shares and prevents infrastructure budgets from being treated as semiconductor-platform sales.
  • Thermal conditions raise qualification expectations Outdoor electronics deployed in hot climates require reliable heat removal and stable performance over wide temperature ranges. The suitability of GaN-on-silicon depends on the final device package and system design, not on substrate selection alone. Equipment makers may favor already-qualified platforms with established field histories, even when newer wafer technologies offer attractive laboratory results.
  • Project procurement can delay technology uptake Large industrial projects often specify proven equipment several years before installation, which limits immediate substitution of newer semiconductor processes. GaN-on-silicon adoption may therefore follow later product refreshes rather than current construction schedules. Suppliers seeking regional exposure need relationships with international OEMs and integrators whose designs determine the embedded device technology.
In the full report: project-level technology adoption in Saudi Arabia, the United Arab Emirates, South Africa and selected neighboring economies, distinguishing device value from equipment spending.

South America FIFTH · ~4% SHARE

How does South America access GaN-on-silicon technology?

South America holds an estimated ~4% of 2025 value and participates mainly as an end market for electronics assembled with imported GaN-on-silicon components. Brazil offers the broadest industrial and electronics demand, while other countries purchase qualified power and communications systems through global suppliers. Exchange rates, component availability and technical-service coverage constrain direct technology penetration despite growing interest in compact and efficient power equipment.

Market positionFifth (~4%)
Growth outlook~8.7% CAGR
Demand profileImported device platforms
Market access gateLanded cost and inventory
Country Position in region What drives demand
Brazil Regional electronics base Brazilian electronics manufacturers and industrial users can incorporate GaN-on-silicon power devices through global component suppliers and local assembly channels. The decision to adopt a device often originates in an overseas product design, while local teams focus on supply continuity and cost. A limited domestic epitaxy ecosystem means that technology-platform value is captured mainly by external wafer and semiconductor manufacturers.
Argentina Selective power equipment Argentina has industrial and telecommunications applications where compact high-efficiency conversion may be valuable, but equipment investment is sensitive to financing and import conditions. Customers typically favor components already validated by international system vendors. GaN-on-silicon platform adoption is therefore gradual and concentrated in specific products rather than a broad shift in local semiconductor manufacturing capability.
Chile and Colombia Infrastructure users Chile and Colombia deploy communications and energy equipment that may contain GaN-on-silicon devices. Semiconductor technology is generally sourced indirectly through imported converters and modules, so purchasing teams prioritize equipment performance and maintenance support. Direct wafer-platform opportunities remain limited unless local engineering organizations establish sustained relationships with external foundries or specialized device developers.

Market instances

  • Import channels influence component choice When most advanced semiconductor content is imported, distributors and equipment vendors shape which device families are available for local production and service. GaN-on-silicon suppliers that support approved global designs can reach regional customers without a local epitaxy line. However, currency fluctuations and shipping lead times may favor conventional components with larger inventories and established substitutes.
  • Power electronics adoption follows equipment refreshes Industrial converters and chargers are often replaced on long cycles, reducing the pace at which new semiconductor technologies enter installed equipment. A GaN-on-silicon platform may offer efficiency benefits, but local buyers need evidence of complete-system savings and reliable after-sales support. This creates a measured adoption path linked to product renewal rather than immediate conversion of existing fleets.
  • Limited local wafer production constrains value capture South American electronics assembly can expand without creating an equivalent market for domestic GaN epitaxy services. Most high-value wafer process steps remain concentrated in other regions, and local facilities may purchase finished devices or modules instead. Market analysis must therefore separate consumption of GaN-containing equipment from direct revenue earned by the technology suppliers that manufacture its semiconductor structures.
In the full report: country-level market potential for Brazil, Argentina, Chile and Colombia, emphasizing distribution, equipment integration and imported GaN-on-silicon device content.

GaN on Silicon Technology Manufacturers and Competitive Landscape

Competition is distributed across epitaxy specialists, integrated semiconductor manufacturers, process research institutes and device designers. Their roles are not interchangeable: an epitaxial wafer supplier provides material structures, a foundry offers qualified device fabrication, and an OEM validates the resulting semiconductor in equipment. The commercial differentiator is often a transferable and reliable process platform rather than the number of GaN products named in a catalogue.

Epitaxy specialists compete through buffer design, deposition uniformity and wafer quality, while foundries compete on process repeatability and integration with established manufacturing flows. These activities require different capital assets and technical teams. A company may lead one stage without controlling the others, so current competitive analysis should distinguish wafer-material supply from finished-device sales and from equipment integration.

Integrated semiconductor companies can combine GaN-on-silicon device design with manufacturing, packaging and application support. Their advantage is the ability to validate complete process and device behavior for industrial or automotive customers. However, not every historical technology developer remains an independent supplier, and an acquired brand can persist in product documentation long after ownership changes.

Collaborative development agreements are increasingly important because a new wafer platform requires epitaxy, process equipment, metrology and device design to progress together. Joint programs can reduce the cost of building a manufacturable offering for fabless customers. Their immediate outputs are process capability and qualification pathways, which should not be mistaken for audited global revenue or guaranteed high-volume supply.

Several names associated with GaN technology represent historical businesses or different semiconductor categories. GaN Systems belongs to Infineon, Transphorm belongs to Renesas, and OSRAM Opto Semiconductors is a legacy brand within ams OSRAM. Cree and Wolfspeed have changed their business focus over time. These names remain useful for technology history but should not be double-counted as separate current competitors.

Tier structure

Tier Companies Basis of competition
Tier 1 Infineon Technologies, Texas Instruments, STMicroelectronics, Renesas Electronics Integrated semiconductor companies have device-design capability, manufacturing resources and customer qualification processes that support power-electronics platforms. Their strengths include process control, reliability testing, application engineering and long-term product support. GaN-on-silicon is only part of their broader semiconductor portfolio, so corporate revenue should never be equated with this narrowly defined technology market.
Tier 2 IQE, X-FAB, Soitec, Panasonic, Qorvo, NXP Semiconductors Epitaxy, foundry and specialist device organizations compete through technical capability and targeted customer relationships rather than universal scale. IQE and X-FAB work on process-platform development, while Soitec offers specialized RF-GaN substrate structures. Other companies participate through device design or historical technology programs, and their exact commercial exposure varies by application and wafer format.
Historical and adjacent names GaN Systems, Transphorm, Cree, Fujitsu Semiconductor, OSRAM Opto Semiconductors These names appear in the historical technology ecosystem, but they are not all independent contemporary GaN-on-silicon platform suppliers. Acquired companies should be associated with current owners, and optoelectronic or substrate businesses should not automatically be treated as leading power-device manufacturers. This separation reduces double counting and makes the competitive map more useful for procurement decisions.

Key companies profiled

  • NXP Semiconductor
  • GaN Systems
  • Panasonic Corporation
  • Fujitsu Semiconductor
  • Transphorm Inc.
  • Texas Instruments
  • Qorvo Inc.
  • OSRAM Opto Semiconductors GmbH
  • Infineon Technologies AG
  • Cree Inc.

GaN on Silicon Technology Production Capacity Analysis

Capacity is defined by qualified epitaxial and device-processing output rather than by nominal wafer area alone. The 150 mm and 200 mm classes provide established manufacturing options, while 300 mm research seeks to exploit more advanced silicon fab equipment. Production economics depend on epitaxial thickness control, bow, wafer handling, defect density and electrical yield, with customer qualification required before process improvements translate into recurring orders.

Epitaxial growth is the first major constraint because GaN and silicon differ in lattice structure and thermal expansion. Engineers use buffer layers and deposition recipes to manage stress, cracking and wafer curvature. A process that works on a small wafer may not transfer directly to a larger diameter, so manufacturers must demonstrate uniformity and device performance across the full substrate rather than relying on center-wafer measurements.

Foundry transfer requires compatible contamination controls, lithography, etching, metallization and test processes. Using existing silicon equipment can reduce capital requirements, but GaN-specific steps may still need dedicated process modules and engineering support. The value of a 200 mm platform is strongest when customers can qualify a stable device flow with reliable process design rules, reproducible yields and predictable delivery schedules.

The next capacity opportunity involves larger-wafer pilot programs and collaborative equipment development. These programs can provide access to more sophisticated metrology and process-control tools, but high-voltage structures also demand thick and mechanically stable epitaxial layers. Commercial capacity should therefore be measured through validated wafer lots and saleable device output, not by a research announcement or theoretical die-count comparison.

GaN on Silicon Technology Market Dynamics: Drivers, Restraints and Opportunities

Growth is supported by demand for efficient power conversion, foundry access, larger-wafer processing and application-specific GaN integration. These drivers are offset by epitaxial stress, process-transfer costs, long qualification cycles and competition from established silicon and silicon-carbide technologies. Technology suppliers must translate laboratory performance into stable wafer and device manufacturing to realize sustained commercial value.

MARKET DRIVERS

Drivers Impact Analysis*

Market Drivers Impact Rank CAGR Contribution (%) 2026–2028 2029–2031 2032–2034
Power-conversion efficiency and compact device design High +4.00% High High Medium
200 mm wafer process commercialization High +3.50% High High Medium
Automotive and industrial platform qualification Medium-High +2.80% Medium High High
Outsourced foundry and epitaxy collaboration Medium +2.30% High Medium High
Advanced RF and specialized electronics Low-Medium +1.50% Medium Medium Medium
Others (research platforms and new integration concepts) Low +0.80% Low Medium High

Power conversion creates platform pull

Smaller and more efficient converters encourage semiconductor designers to investigate GaN-on-silicon device structures that can use established wafer-processing infrastructure. The benefit depends on the entire circuit and thermal design, so device qualification is essential. Technology suppliers that provide stable epitaxy and process design support can capture value through recurring platform orders rather than one-off research samples.

200 mm manufacturing improves commercial options

Established 200 mm silicon equipment offers a practical route to higher GaN-on-silicon throughput when epitaxial uniformity and defect control are sufficient. A larger wafer does not guarantee lower cost, but it can improve economics after yield learning and process stabilization. This encourages foundries and integrated device makers to qualify production flows that are more accessible to industrial and consumer electronics customers.

Automotive qualification supports longer contracts

Vehicle power-conversion platforms require stable device characteristics and long-term supply, creating an incentive for semiconductor manufacturers to invest in reliable GaN-on-silicon process recipes. Successful qualification can convert development work into multi-year manufacturing demand. The process remains slow because thermal cycling, electrical stress and change-control requirements must be satisfied before a new wafer technology enters series production.

Outsourced platforms reduce entry barriers

Fabless device developers can gain access to GaN-on-silicon capability through foundries and epitaxy partners instead of building a complete wafer fabrication operation. This arrangement spreads process-development costs and can accelerate early design cycles. Its success depends on shared technical documentation, reproducible process results and commercially workable intellectual-property agreements, rather than on collaboration announcements alone.

MARKET RESTRAINTS

Restraints Impact Analysis*

Market Restraints Impact Rank CAGR Contribution (%) 2026–2028 2029–2031 2032–2034
Epitaxial mismatch, wafer bow and yield losses High -1.80% High Medium Medium
Manufacturing transfer and qualification cost Medium-High -1.40% High High Medium
Competition from established semiconductor platforms Medium -0.60% Medium Medium High
Others (supply concentration and long design cycles) Low -0.30% Medium Medium Low
*CAGR contribution shows the percentage points each factor adds to or removes from the forecast CAGR for 2026–2034; driver contributions less restraint contributions equal the market CAGR. The early, middle and later windows separate epitaxial process-transfer costs from subsequent customer qualification and larger-wafer adoption.

Crystal mismatch complicates scale-up

GaN and silicon have different lattice and thermal characteristics, making buffer engineering essential to prevent cracking and excessive wafer curvature. As substrate diameter grows, controlling stress uniformly becomes more difficult. Poor yield can erase the theoretical economic advantage of larger silicon wafers, forcing suppliers to invest in process monitoring and repeated qualification before commercial capacity becomes reliable.

Process transfer carries hidden costs

A GaN-on-silicon technology may require new deposition steps, contamination protocols and electrical test methods even when much of the host fab uses standard silicon equipment. Foundry transfer also demands device models and customer documentation. These expenses can delay adoption by smaller designers, particularly when the expected product volume is too low to justify a lengthy qualification program.

Alternative materials remain competitive

Conventional silicon continues to serve many low-cost power applications, while silicon carbide is well established in selected high-voltage systems. GaN-on-silicon must demonstrate a compelling combination of performance, reliability and manufacturing economics for each use case. Technical feasibility alone is insufficient when a mature competing platform already satisfies the customer specification at a lower lifetime cost.

MARKET OPPORTUNITIES

300 mm research can extend process capability

Larger-wafer programs may allow GaN technology to use advanced silicon manufacturing and metrology tools, enabling improved process control and new integrated device structures. The transition also creates challenges in wafer bow, epitaxial thickness and handling. Suppliers that solve these issues could offer more scalable platforms, but commercial claims must await validated yield and customer qualification rather than relying on theoretical area benefits.

Integrated power circuits expand technology value

Combining GaN switching devices with compatible drivers and protection functions can reduce circuit complexity and enable compact power assemblies. Such integration requires reliable process isolation and careful device matching on the wafer. Epitaxy and foundry suppliers that support integrated circuit structures may move beyond selling a basic wafer toward more differentiated technology services and recurring design-platform relationships.

Specialized RF and space applications reward reliability

Certain high-frequency and radiation-sensitive applications can justify additional process development when standard power-conversion devices do not meet performance requirements. GaN-on-silicon may provide an attractive option in selected architectures, subject to thermal and reliability constraints. These markets are smaller than mainstream consumer power but can support valuable qualification programs and intellectual property for specialized technology providers.

GaN on Silicon Technology Supply Chain Analysis

The value chain starts with silicon host wafers and GaN epitaxial materials, moves through specialized deposition and wafer processing, and ends with device qualification by electronics manufacturers. Epitaxy and process know-how are the central technology assets because the substrate mismatch must be controlled before high-yield device fabrication is possible. Foundry partnerships determine how widely the resulting platforms can be accessed by fabless designers.

UpstreamSilicon host wafers, gallium precursors, buffer-layer chemistry and epitaxy deposition equipment
ManufacturingGaN epitaxial growth, wafer process integration, metrology, electrical test and qualification
ChannelEpitaxy suppliers, semiconductor foundries, technology licensing and qualified device manufacturers
DownstreamConsumer chargers, IT power conversion, automotive electronics, aerospace and industrial systems

Upstream. The upstream stage supplies silicon substrates, gallium-containing materials and specialized epitaxy equipment capable of depositing high-quality nitride layers. Material purity and substrate characteristics influence buffer design and defect formation. Suppliers must maintain traceability and process stability because a small variation in an input can affect the electrical behavior of devices across an entire wafer lot, particularly at larger diameters.

Manufacturing. GaN-on-silicon fabrication combines epitaxial stress management with device patterning, contacts and electrical characterization. Process integration must account for contamination restrictions and wafer handling in silicon-compatible facilities. The commercial output is qualified technology or epitaxial material, not simply a processed wafer count. Yield, reproducibility and reliable test results determine whether the platform can support repeated customer orders.

Distribution. Technology reaches customers through epitaxy contracts, foundry platforms, licensing agreements and device suppliers that qualify the process for a particular application. Fabless designers need clear process design rules and long-term access, while integrated manufacturers may keep proprietary recipes in-house. The sales cycle can be lengthy because technical evaluation, intellectual-property terms and reliability qualification all precede production commitments.

Downstream. End customers use GaN-on-silicon structures within power or RF semiconductor devices that are then incorporated into complete equipment. A charger designer focuses on compact switching, an automotive engineer emphasizes warranty life, and a telecom supplier evaluates thermal and frequency performance. These different requirements determine which wafer technologies are commercially viable, but the value of finished equipment should not be counted as wafer-platform revenue.

Recent Developments in the GaN on Silicon Technology Market

  • 9 June 2026 Announced
    onsemi introduced its GaNEXUS device portfolio, with initial sampling across low- and high-voltage classes for computing, robotics and industrial power applications. Although the announcement concerns finished power devices, it is relevant to the GaN-on-silicon technology ecosystem because broader device demand can support additional process and epitaxy qualification. Commercial wafer-platform growth will depend on which manufacturing routes are selected for sustained production. Source
  • 6 October 2025 Announced
    Imec launched a 300 mm GaN development program with equipment and foundry partners including AIXTRON, GlobalFoundries, KLA, Synopsys and Veeco. The work addresses epitaxial growth, process modules and device integration on larger substrates. The program expands the technical infrastructure available for future GaN-on-silicon development, but pilot-line capability should be distinguished from qualified high-volume commercial production. Source
  • 2 July 2025 Announced
    Infineon reported progress on its 300 mm GaN manufacturing roadmap, with customer samples targeted for the fourth quarter of 2025. The company emphasized potential die-output benefits compared with 200 mm processing. The development illustrates how integrated manufacturers seek to leverage existing silicon fab infrastructure, while yield learning and customer qualification remain necessary before theoretical wafer-area advantages translate into lower delivered device cost. Source
  • 10 April 2025 Announced
    IQE and X-FAB agreed to develop a 650V GaN power device platform combining epitaxy and foundry expertise. The initial program was designed to create a scalable outsourced route for fabless customers serving automotive, data-center and consumer markets. Its significance lies in expanding access to process capability without requiring each device developer to own epitaxial growth and fabrication facilities. Source
  • 11 September 2024 Announced
    Infineon described its development of 300 mm GaN power wafer technology within an existing silicon manufacturing environment in Austria. The company highlighted compatibility with established wafer-processing infrastructure as a route to future scale. This milestone concerns process capability and potential manufacturing economics; it does not imply that every GaN-on-silicon application has already migrated from smaller production diameters. Source
  • 19 September 2023 Announced
    IQE and VisIC Technologies disclosed a collaboration to develop 200 mm D-mode GaN power epiwafers for electric vehicle applications. The partnership links compound-semiconductor epitaxy with automotive device design and qualification requirements. It demonstrates the importance of joint process and application engineering, because a wafer recipe must ultimately support reliable electrical behavior in demanding power-conversion systems. Source
  • 10 October 2022 Announced
    IQE announced a strategic collaboration with SK siltron that included GaN-on-silicon epitaxy for power electronics alongside other compound-semiconductor platforms. The arrangement connected substrate expertise with epitaxial manufacturing capability and targeted Asian market opportunities. It illustrates how wafer-platform suppliers pursue regional access through partnerships, while distinct GaN-on-SiC RF products must remain outside the silicon-host technology category. Source
  • 29 April 2021 Published
    Imec and AIXTRON reported 200 mm GaN epitaxy research for higher-voltage device structures using engineered substrates and advanced deposition equipment. The work demonstrated how buffer design and thermal-expansion management affect achievable breakdown performance. Although the experimental structures used QST engineered substrates, the process insights inform the broader challenge of scaling GaN epitaxy on silicon-compatible manufacturing lines. Source

REPORT SCOPE & SEGMENTATION

Attribute Details
Study Period 2020–2034
Base Year 2025
Estimated Year 2026
Forecast Period 2026–2034
Historical Period 2020–2024
Market Size 2025 USD 20.87 million
Market Size 2026 USD 23.12 million
Market Size 2034 USD 52.53 million
Growth Rate CAGR of 10.8% from 2026–2034
Unit Value (USD Million)
Segmentation By Type, By Application and By Region
By Type 50 mm · 100 mm · 150 mm · 200 mm
By Application Consumer Electronics · IT and Telecommunication · Automotive · Aerospace and Defense · Others
By Region Each region analyzed by wafer diameter, application and country
North AmericaUnited States, Canada, Mexico
EuropeBelgium, United Kingdom, Germany, Austria, France, Rest of Europe
Asia-PacificChina, Japan, South Korea, India, Southeast Asia, Rest of Asia-Pacific
South AmericaBrazil, Argentina, Chile, Colombia, Rest of South America
Middle East & AfricaSaudi Arabia, UAE, South Africa, Rest of Middle East & Africa
Key Companies Profiled NXP Semiconductor, GaN Systems, Panasonic Corporation, Fujitsu Semiconductor, Transphorm Inc., Texas Instruments, Qorvo Inc., OSRAM Opto Semiconductors GmbH, Infineon Technologies AG, Cree Inc.
Customization Scope Custom wafer-diameter, country, application and technology-platform breakdowns are available subject to research scope and source support.

Frequently Asked Questions

What is the GaN on silicon technology market size?

The global market was valued at USD 20.87 million in 2025 and is projected to reach USD 52.53 million by 2034, with 10.8% CAGR during 2026–2034. This technology market covers GaN epitaxial and process platforms built on silicon and related qualifying device implementations. It does not represent the selling price of complete electric vehicles, chargers or data-center equipment that may contain GaN components.

Which wafer diameter leads GaN-on-silicon technology?

The 200 mm class leads with an estimated ~45% of 2025 value because it can draw on established silicon wafer-handling and process infrastructure while supporting commercially relevant GaN power devices. The 150 mm category remains significant at ~35% for mature production recipes. Smaller 50 mm and 100 mm formats are more often used for specialized manufacturing, development or limited-volume programs.

Which application is largest and which is growing fastest?

Consumer Electronics is the largest application with an estimated ~34% of 2025 revenue, supported by compact charging and power conversion demand. Automotive has the fastest modeled expansion at ~12.9% annually as suppliers qualify GaN-on-silicon platforms for onboard charging and auxiliary systems. The two sectors have different purchasing requirements: consumer designs emphasize cost, while automotive programs demand longer reliability validation.

Why does Asia-Pacific hold the largest share?

The modeled regional leader is Asia-Pacific with ~43% of 2025 value, reflecting its concentration of contract manufacturing relationships and customers able to evaluate new wafer platforms at scale. The region also contains several distinct business models, from epitaxy supply to device packaging. Buyers still test process stability independently, because geographic proximity does not replace electrical qualification or long-term wafer-lot traceability.

What is the main technical difficulty in GaN-on-silicon epitaxy?

The principal challenge is managing the lattice and thermal-expansion mismatch between gallium nitride and silicon during deposition and cooling. Poor control can produce cracking, wafer bow and electrical defects that reduce usable die yield. Buffer-layer engineering and optimized epitaxial recipes help address these problems, but larger wafer diameters demand tighter uniformity and more sophisticated process monitoring across the entire substrate.

How does GaN-on-silicon compare with GaN-on-SiC?

GaN-on-silicon can exploit silicon-compatible fabrication and larger-wafer economics, making it attractive for many power-electronics applications. GaN-on-SiC is often selected for demanding RF power because of its thermal and microwave characteristics. The better choice depends on voltage, frequency, heat extraction and device architecture; neither platform is universally superior, and raw GaN-on-SiC substrate sales are outside this specific technology boundary.

Does moving to 300 mm automatically reduce manufacturing cost?

A larger wafer can accommodate more potential die and provide access to advanced silicon processing equipment, but cost savings are conditional. Wafer bow, epitaxial uniformity, defect density and test yield must remain controlled during the transition. Pilot-line demonstrations establish technical feasibility, whereas commercial cost improvement requires stable production lots, reliable device performance and qualified customer orders over time.

What role do foundries play in this market?

Specialty foundries allow fabless semiconductor companies to access GaN-on-silicon process technology without owning all epitaxy and wafer-fabrication assets. They provide manufacturing capacity, process rules and technical support for device development. Commercial success depends on the stability of those process platforms, intellectual-property arrangements and long-term supply commitments, because a process change can force expensive customer requalification.

Are GaN Systems and Transphorm still independent competitors?

GaN Systems was acquired by Infineon in October 2023, and Transphorm joined Renesas in June 2024. Both names remain relevant to technology history and some product documentation, but they should be linked to their current owners in a present-day supplier analysis. Historical brands, wafer-material suppliers and finished-device manufacturers perform different roles and should not be counted as interchangeable competitors.

What opportunities are most important through 2034?

The main opportunities are more reliable 200 mm production, collaborative foundry platforms, integration of GaN power circuits and research into larger silicon-compatible wafer processing. Automotive and computing applications could increase demand for qualified epitaxy and device technology, but adoption will be selective. Suppliers must demonstrate reproducible electrical results, manageable manufacturing costs and sufficient long-term support to convert development programs into sustained revenue.

Research Sources & Evidence Base
View research sources used for this overview
  1. IQE. IQE and X-FAB GaN power development agreement, 10 April 2025; 650V epitaxy and foundry platform
  2. Infineon Technologies. 300mm power GaN manufacturing technology, 11 September 2024; silicon fab compatibility
  3. STMicroelectronics. Manufacturing footprint and GaN-on-silicon activities, 2025; European production strategy
  4. imec. GaN power devices technology platform, Technical overview; 200mm and 300mm processes
  5. imec. GaN technology for next-generation power electronics, 2026 technical analysis; epitaxial mismatch and scaling
  6. IQE. IQE and SK siltron strategic collaboration, 10 October 2022; GaN-on-Si epiwafer technology
  7. Soitec. RF-GaN engineered substrate platform, Technical product information; high-resistance silicon
  8. imec. GaN epitaxy for higher-voltage devices, 29 April 2021; buffer layers and 200mm processing
  9. IQE. IQE and VisIC technology collaboration, 19 September 2023; 200mm EV GaN epiwafers
  10. imec. 200V and 650V GaN-on-silicon devices, 13 June 2017; device reliability and 200mm processing
  11. Panasonic. Insulated-gate GaN power transistor development, 23 February 2018; threshold stability research
  12. imec. 300mm GaN open innovation program, 6 October 2025; equipment and foundry ecosystem
  13. Infineon Technologies. Progress on 300mm GaN manufacturing, 2 July 2025; scale and sample availability
  14. International Energy Agency. Global EV Outlook 2026, 2026; adjacent electric-vehicle demand context
  15. Renesas Electronics. Completion of Transphorm acquisition, 20 June 2024; current supplier ownership
  16. onsemi. GaNEXUS device portfolio launch, 9 June 2026; adjacent device-platform demand
GaN on Silicon Technology Market, Size, Trends, Business Strategies 2026–2034

Get Sample Report PDF for Exclusive Insights

Report Sample Includes

  • Table of Contents
  • List of Tables & Figures
  • Charts, Research Methodology, and more...

PDF Icon Download Sample Report PDF

Download Sample Report

Table of Content

Table of Contents
1 Research Methodology and Statistical Scope
1.1 Market Definition and Statistical Scope of GaN on Silicon Technology
1.2 Key Market Segments
1.2.1 GaN on Silicon Technology Segment by Type
1.2.2 GaN on Silicon Technology Segment by Application
1.3 Methodology & Sources of Information
1.3.1 Research Methodology
1.3.2 Research Process
1.3.3 Market Breakdown and Data Triangulation
1.3.4 Base Year
1.3.5 Report Assumptions & Caveats
2 GaN on Silicon Technology Market Overview
2.1 Global Market Overview
2.1.1 Global GaN on Silicon Technology Market Size (M USD) Estimates and Forecasts (2026-2034)
2.1.2 Global GaN on Silicon Technology Sales Estimates and Forecasts (2026-2034)
2.2 Market Segment Executive Summary
2.3 Global Market Size by Region
3 GaN on Silicon Technology Market Competitive Landscape
3.1 Global GaN on Silicon Technology Sales by Manufacturers (2019-2025)
3.2 Global GaN on Silicon Technology Revenue Market Share by Manufacturers (2019-2025)
3.3 GaN on Silicon Technology Market Share by Company Type (Tier 1, Tier 2, and Tier 3)
3.4 Global GaN on Silicon Technology Average Price by Manufacturers (2019-2025)
3.5 Manufacturers GaN on Silicon Technology Sales Sites, Area Served, Product Type
3.6 GaN on Silicon Technology Market Competitive Situation and Trends
3.6.1 GaN on Silicon Technology Market Concentration Rate
3.6.2 Global 5 and 10 Largest GaN on Silicon Technology Players Market Share by Revenue
3.6.3 Mergers & Acquisitions, Expansion
4 GaN on Silicon Technology Industry Chain Analysis
4.1 GaN on Silicon Technology Industry Chain Analysis
4.2 Market Overview of Key Raw Materials
4.3 Midstream Market Analysis
4.4 Downstream Customer Analysis
5 The Development and Dynamics of GaN on Silicon Technology Market
5.1 Key Development Trends
5.2 Driving Factors
5.3 Market Challenges
5.4 Market Restraints
5.5 Industry News
5.5.1 New Product Developments
5.5.2 Mergers & Acquisitions
5.5.3 Expansions
5.5.4 Collaboration/Supply Contracts
5.6 Industry Policies
6 GaN on Silicon Technology Market Segmentation by Type
6.1 Evaluation Matrix of Segment Market Development Potential (Type)
6.2 Global GaN on Silicon Technology Sales Market Share by Type (2019-2025)
6.3 Global GaN on Silicon Technology Market Size Market Share by Type (2019-2025)
6.4 Global GaN on Silicon Technology Price by Type (2019-2025)
7 GaN on Silicon Technology Market Segmentation by Application
7.1 Evaluation Matrix of Segment Market Development Potential (Application)
7.2 Global GaN on Silicon Technology Market Sales by Application (2019-2025)
7.3 Global GaN on Silicon Technology Market Size (M USD) by Application (2019-2025)
7.4 Global GaN on Silicon Technology Sales Growth Rate by Application (2019-2025)
8 GaN on Silicon Technology Market Consumption by Region
8.1 Global GaN on Silicon Technology Sales by Region
8.1.1 Global GaN on Silicon Technology Sales by Region
8.1.2 Global GaN on Silicon Technology Sales Market Share by Region
8.2 North America
8.2.1 North America GaN on Silicon Technology Sales by Country
8.2.2 U.S.
8.2.3 Canada
8.2.4 Mexico
8.3 Europe
8.3.1 Europe GaN on Silicon Technology Sales by Country
8.3.2 Germany
8.3.3 France
8.3.4 U.K.
8.3.5 Italy
8.3.6 Russia
8.4 Asia Pacific
8.4.1 Asia Pacific GaN on Silicon Technology Sales by Region
8.4.2 China
8.4.3 Japan
8.4.4 South Korea
8.4.5 India
8.4.6 Southeast Asia
8.5 South America
8.5.1 South America GaN on Silicon Technology Sales by Country
8.5.2 Brazil
8.5.3 Argentina
8.5.4 Columbia
8.6 Middle East and Africa
8.6.1 Middle East and Africa GaN on Silicon Technology Sales by Region
8.6.2 Saudi Arabia
8.6.3 UAE
8.6.4 Egypt
8.6.5 Nigeria
8.6.6 South Africa
9 GaN on Silicon Technology Market Production by Region
9.1 Global Production of GaN on Silicon Technology by Region (2019-2025)
9.2 Global GaN on Silicon Technology Revenue Market Share by Region (2019-2025)
9.3 Global GaN on Silicon Technology Production, Revenue, Price and Gross Margin (2019-2025)
9.4 North America GaN on Silicon Technology Production
9.4.1 North America GaN on Silicon Technology Production Growth Rate (2019-2025)
9.4.2 North America GaN on Silicon Technology Production, Revenue, Price and Gross Margin (2019-2025)
9.5 Europe GaN on Silicon Technology Production
9.5.1 Europe GaN on Silicon Technology Production Growth Rate (2019-2025)
9.5.2 Europe GaN on Silicon Technology Production, Revenue, Price and Gross Margin (2019-2025)
9.6 Japan GaN on Silicon Technology Production (2019-2025)
9.6.1 Japan GaN on Silicon Technology Production Growth Rate (2019-2025)
9.6.2 Japan GaN on Silicon Technology Production, Revenue, Price and Gross Margin (2019-2025)
9.7 China GaN on Silicon Technology Production (2019-2025)
9.7.1 China GaN on Silicon Technology Production Growth Rate (2019-2025)
9.7.2 China GaN on Silicon Technology Production, Revenue, Price and Gross Margin (2019-2025)
10 Key Companies Profile
10.1 NXP Semiconductor
10.1.1 NXP Semiconductor GaN on Silicon Technology Basic Information
10.1.2 NXP Semiconductor GaN on Silicon Technology Product Overview
10.1.3 NXP Semiconductor GaN on Silicon Technology Product Market Performance
10.1.4 NXP Semiconductor Business Overview
10.1.5 NXP Semiconductor GaN on Silicon Technology SWOT Analysis
10.1.6 NXP Semiconductor Recent Developments
10.2 GaN Systems
10.2.1 GaN Systems GaN on Silicon Technology Basic Information
10.2.2 GaN Systems GaN on Silicon Technology Product Overview
10.2.3 GaN Systems GaN on Silicon Technology Product Market Performance
10.2.4 GaN Systems Business Overview
10.2.5 GaN Systems GaN on Silicon Technology SWOT Analysis
10.2.6 GaN Systems Recent Developments
10.3 Panasonic Corporation
10.3.1 Panasonic Corporation GaN on Silicon Technology Basic Information
10.3.2 Panasonic Corporation GaN on Silicon Technology Product Overview
10.3.3 Panasonic Corporation GaN on Silicon Technology Product Market Performance
10.3.4 Panasonic Corporation GaN on Silicon Technology SWOT Analysis
10.3.5 Panasonic Corporation Business Overview
10.3.6 Panasonic Corporation Recent Developments
10.4 Fujitsu Semiconductor
10.4.1 Fujitsu Semiconductor GaN on Silicon Technology Basic Information
10.4.2 Fujitsu Semiconductor GaN on Silicon Technology Product Overview
10.4.3 Fujitsu Semiconductor GaN on Silicon Technology Product Market Performance
10.4.4 Fujitsu Semiconductor Business Overview
10.4.5 Fujitsu Semiconductor Recent Developments
10.5 Transphorm Inc.
10.5.1 Transphorm Inc. GaN on Silicon Technology Basic Information
10.5.2 Transphorm Inc. GaN on Silicon Technology Product Overview
10.5.3 Transphorm Inc. GaN on Silicon Technology Product Market Performance
10.5.4 Transphorm Inc. Business Overview
10.5.5 Transphorm Inc. Recent Developments
10.6 Texas Instruments
10.6.1 Texas Instruments GaN on Silicon Technology Basic Information
10.6.2 Texas Instruments GaN on Silicon Technology Product Overview
10.6.3 Texas Instruments GaN on Silicon Technology Product Market Performance
10.6.4 Texas Instruments Business Overview
10.6.5 Texas Instruments Recent Developments
10.7 Qorvo
10.7.1 Qorvo GaN on Silicon Technology Basic Information
10.7.2 Qorvo GaN on Silicon Technology Product Overview
10.7.3 Qorvo GaN on Silicon Technology Product Market Performance
10.7.4 Qorvo Business Overview
10.7.5 Qorvo Recent Developments
10.8 Inc.
10.8.1 Inc. GaN on Silicon Technology Basic Information
10.8.2 Inc. GaN on Silicon Technology Product Overview
10.8.3 Inc. GaN on Silicon Technology Product Market Performance
10.8.4 Inc. Business Overview
10.8.5 Inc. Recent Developments
10.9 OSRAM Opto Semiconductors GmbH
10.9.1 OSRAM Opto Semiconductors GmbH GaN on Silicon Technology Basic Information
10.9.2 OSRAM Opto Semiconductors GmbH GaN on Silicon Technology Product Overview
10.9.3 OSRAM Opto Semiconductors GmbH GaN on Silicon Technology Product Market Performance
10.9.4 OSRAM Opto Semiconductors GmbH Business Overview
10.9.5 OSRAM Opto Semiconductors GmbH Recent Developments
10.10 Infineon Technologies AG
10.10.1 Infineon Technologies AG GaN on Silicon Technology Basic Information
10.10.2 Infineon Technologies AG GaN on Silicon Technology Product Overview
10.10.3 Infineon Technologies AG GaN on Silicon Technology Product Market Performance
10.10.4 Infineon Technologies AG Business Overview
10.10.5 Infineon Technologies AG Recent Developments
10.11 Cree
10.11.1 Cree GaN on Silicon Technology Basic Information
10.11.2 Cree GaN on Silicon Technology Product Overview
10.11.3 Cree GaN on Silicon Technology Product Market Performance
10.11.4 Cree Business Overview
10.11.5 Cree Recent Developments
10.12 Inc.
10.12.1 Inc. GaN on Silicon Technology Basic Information
10.12.2 Inc. GaN on Silicon Technology Product Overview
10.12.3 Inc. GaN on Silicon Technology Product Market Performance
10.12.4 Inc. Business Overview
10.12.5 Inc. Recent Developments
11 GaN on Silicon Technology Market Forecast by Region
11.1 Global GaN on Silicon Technology Market Size Forecast
11.2 Global GaN on Silicon Technology Market Forecast by Region
11.2.1 North America Market Size Forecast by Country
11.2.2 Europe GaN on Silicon Technology Market Size Forecast by Country
11.2.3 Asia Pacific GaN on Silicon Technology Market Size Forecast by Region
11.2.4 South America GaN on Silicon Technology Market Size Forecast by Country
11.2.5 Middle East and Africa Forecasted Consumption of GaN on Silicon Technology by Country
12 Forecast Market by Type and by Application (2025-2032)
12.1 Global GaN on Silicon Technology Market Forecast by Type (2025-2032)
12.1.1 Global Forecasted Sales of GaN on Silicon Technology by Type (2025-2032)
12.1.2 Global GaN on Silicon Technology Market Size Forecast by Type (2025-2032)
12.1.3 Global Forecasted Price of GaN on Silicon Technology by Type (2025-2032)
12.2 Global GaN on Silicon Technology Market Forecast by Application (2025-2032)
12.2.1 Global GaN on Silicon Technology Sales (K Units) Forecast by Application
12.2.2 Global GaN on Silicon Technology Market Size (M USD) Forecast by Application (2025-2032)
13 Conclusion and Key FindingsList of Tables
Table 1. Introduction of the Type
Table 2. Introduction of the Application
Table 3. Market Size (M USD) Segment Executive Summary
Table 4. GaN on Silicon Technology Market Size Comparison by Region (M USD)
Table 5. Global GaN on Silicon Technology Sales (K Units) by Manufacturers (2019-2025)
Table 6. Global GaN on Silicon Technology Sales Market Share by Manufacturers (2019-2025)
Table 7. Global GaN on Silicon Technology Revenue (M USD) by Manufacturers (2019-2025)
Table 8. Global GaN on Silicon Technology Revenue Share by Manufacturers (2019-2025)
Table 9. Company Type (Tier 1, Tier 2, and Tier 3) & (based on the Revenue in GaN on Silicon Technology as of 2022)
Table 10. Global Market GaN on Silicon Technology Average Price (USD/Unit) of Key Manufacturers (2019-2025)
Table 11. Manufacturers GaN on Silicon Technology Sales Sites and Area Served
Table 12. Manufacturers GaN on Silicon Technology Product Type
Table 13. Global GaN on Silicon Technology Manufacturers Market Concentration Ratio (CR5 and HHI)
Table 14. Mergers & Acquisitions, Expansion Plans
Table 15. Industry Chain Map of GaN on Silicon Technology
Table 16. Market Overview of Key Raw Materials
Table 17. Midstream Market Analysis
Table 18. Downstream Customer Analysis
Table 19. Key Development Trends
Table 20. Driving Factors
Table 21. GaN on Silicon Technology Market Challenges
Table 22. Global GaN on Silicon Technology Sales by Type (K Units)
Table 23. Global GaN on Silicon Technology Market Size by Type (M USD)
Table 24. Global GaN on Silicon Technology Sales (K Units) by Type (2019-2025)
Table 25. Global GaN on Silicon Technology Sales Market Share by Type (2019-2025)
Table 26. Global GaN on Silicon Technology Market Size (M USD) by Type (2019-2025)
Table 27. Global GaN on Silicon Technology Market Size Share by Type (2019-2025)
Table 28. Global GaN on Silicon Technology Price (USD/Unit) by Type (2019-2025)
Table 29. Global GaN on Silicon Technology Sales (K Units) by Application
Table 30. Global GaN on Silicon Technology Market Size by Application
Table 31. Global GaN on Silicon Technology Sales by Application (2019-2025) & (K Units)
Table 32. Global GaN on Silicon Technology Sales Market Share by Application (2019-2025)
Table 33. Global GaN on Silicon Technology Sales by Application (2019-2025) & (M USD)
Table 34. Global GaN on Silicon Technology Market Share by Application (2019-2025)
Table 35. Global GaN on Silicon Technology Sales Growth Rate by Application (2019-2025)
Table 36. Global GaN on Silicon Technology Sales by Region (2019-2025) & (K Units)
Table 37. Global GaN on Silicon Technology Sales Market Share by Region (2019-2025)
Table 38. North America GaN on Silicon Technology Sales by Country (2019-2025) & (K Units)
Table 39. Europe GaN on Silicon Technology Sales by Country (2019-2025) & (K Units)
Table 40. Asia Pacific GaN on Silicon Technology Sales by Region (2019-2025) & (K Units)
Table 41. South America GaN on Silicon Technology Sales by Country (2019-2025) & (K Units)
Table 42. Middle East and Africa GaN on Silicon Technology Sales by Region (2019-2025) & (K Units)
Table 43. Global GaN on Silicon Technology Production (K Units) by Region (2019-2025)
Table 44. Global GaN on Silicon Technology Revenue (US$ Million) by Region (2019-2025)
Table 45. Global GaN on Silicon Technology Revenue Market Share by Region (2019-2025)
Table 46. Global GaN on Silicon Technology Production (K Units), Revenue (US$ Million), Price (USD/Unit) and Gross Margin (2019-2025)
Table 47. North America GaN on Silicon Technology Production (K Units), Revenue (US$ Million), Price (USD/Unit) and Gross Margin (2019-2025)
Table 48. Europe GaN on Silicon Technology Production (K Units), Revenue (US$ Million), Price (USD/Unit) and Gross Margin (2019-2025)
Table 49. Japan GaN on Silicon Technology Production (K Units), Revenue (US$ Million), Price (USD/Unit) and Gross Margin (2019-2025)
Table 50. China GaN on Silicon Technology Production (K Units), Revenue (US$ Million), Price (USD/Unit) and Gross Margin (2019-2025)
Table 51. NXP Semiconductor GaN on Silicon Technology Basic Information
Table 52. NXP Semiconductor GaN on Silicon Technology Product Overview
Table 53. NXP Semiconductor GaN on Silicon Technology Sales (K Units), Revenue (M USD), Price (USD/Unit) and Gross Margin (2019-2025)
Table 54. NXP Semiconductor Business Overview
Table 55. NXP Semiconductor GaN on Silicon Technology SWOT Analysis
Table 56. NXP Semiconductor Recent Developments
Table 57. GaN Systems GaN on Silicon Technology Basic Information
Table 58. GaN Systems GaN on Silicon Technology Product Overview
Table 59. GaN Systems GaN on Silicon Technology Sales (K Units), Revenue (M USD), Price (USD/Unit) and Gross Margin (2019-2025)
Table 60. GaN Systems Business Overview
Table 61. GaN Systems GaN on Silicon Technology SWOT Analysis
Table 62. GaN Systems Recent Developments
Table 63. Panasonic Corporation GaN on Silicon Technology Basic Information
Table 64. Panasonic Corporation GaN on Silicon Technology Product Overview
Table 65. Panasonic Corporation GaN on Silicon Technology Sales (K Units), Revenue (M USD), Price (USD/Unit) and Gross Margin (2019-2025)
Table 66. Panasonic Corporation GaN on Silicon Technology SWOT Analysis
Table 67. Panasonic Corporation Business Overview
Table 68. Panasonic Corporation Recent Developments
Table 69. Fujitsu Semiconductor GaN on Silicon Technology Basic Information
Table 70. Fujitsu Semiconductor GaN on Silicon Technology Product Overview
Table 71. Fujitsu Semiconductor GaN on Silicon Technology Sales (K Units), Revenue (M USD), Price (USD/Unit) and Gross Margin (2019-2025)
Table 72. Fujitsu Semiconductor Business Overview
Table 73. Fujitsu Semiconductor Recent Developments
Table 74. Transphorm Inc. GaN on Silicon Technology Basic Information
Table 75. Transphorm Inc. GaN on Silicon Technology Product Overview
Table 76. Transphorm Inc. GaN on Silicon Technology Sales (K Units), Revenue (M USD), Price (USD/Unit) and Gross Margin (2019-2025)
Table 77. Transphorm Inc. Business Overview
Table 78. Transphorm Inc. Recent Developments
Table 79. Texas Instruments GaN on Silicon Technology Basic Information
Table 80. Texas Instruments GaN on Silicon Technology Product Overview
Table 81. Texas Instruments GaN on Silicon Technology Sales (K Units), Revenue (M USD), Price (USD/Unit) and Gross Margin (2019-2025)
Table 82. Texas Instruments Business Overview
Table 83. Texas Instruments Recent Developments
Table 84. Qorvo GaN on Silicon Technology Basic Information
Table 85. Qorvo GaN on Silicon Technology Product Overview
Table 86. Qorvo GaN on Silicon Technology Sales (K Units), Revenue (M USD), Price (USD/Unit) and Gross Margin (2019-2025)
Table 87. Qorvo Business Overview
Table 88. Qorvo Recent Developments
Table 89. Inc. GaN on Silicon Technology Basic Information
Table 90. Inc. GaN on Silicon Technology Product Overview
Table 91. Inc. GaN on Silicon Technology Sales (K Units), Revenue (M USD), Price (USD/Unit) and Gross Margin (2019-2025)
Table 92. Inc. Business Overview
Table 93. Inc. Recent Developments
Table 94. OSRAM Opto Semiconductors GmbH GaN on Silicon Technology Basic Information
Table 95. OSRAM Opto Semiconductors GmbH GaN on Silicon Technology Product Overview
Table 96. OSRAM Opto Semiconductors GmbH GaN on Silicon Technology Sales (K Units), Revenue (M USD), Price (USD/Unit) and Gross Margin (2019-2025)
Table 97. OSRAM Opto Semiconductors GmbH Business Overview
Table 98. OSRAM Opto Semiconductors GmbH Recent Developments
Table 99. Infineon Technologies AG GaN on Silicon Technology Basic Information
Table 100. Infineon Technologies AG GaN on Silicon Technology Product Overview
Table 101. Infineon Technologies AG GaN on Silicon Technology Sales (K Units), Revenue (M USD), Price (USD/Unit) and Gross Margin (2019-2025)
Table 102. Infineon Technologies AG Business Overview
Table 103. Infineon Technologies AG Recent Developments
Table 104. Cree GaN on Silicon Technology Basic Information
Table 105. Cree GaN on Silicon Technology Product Overview
Table 106. Cree GaN on Silicon Technology Sales (K Units), Revenue (M USD), Price (USD/Unit) and Gross Margin (2019-2025)
Table 107. Cree Business Overview
Table 108. Cree Recent Developments
Table 109. Inc. GaN on Silicon Technology Basic Information
Table 110. Inc. GaN on Silicon Technology Product Overview
Table 111. Inc. GaN on Silicon Technology Sales (K Units), Revenue (M USD), Price (USD/Unit) and Gross Margin (2019-2025)
Table 112. Inc. Business Overview
Table 113. Inc. Recent Developments
Table 114. Global GaN on Silicon Technology Sales Forecast by Region (2025-2032) & (K Units)
Table 115. Global GaN on Silicon Technology Market Size Forecast by Region (2025-2032) & (M USD)
Table 116. North America GaN on Silicon Technology Sales Forecast by Country (2025-2032) & (K Units)
Table 117. North America GaN on Silicon Technology Market Size Forecast by Country (2025-2032) & (M USD)
Table 118. Europe GaN on Silicon Technology Sales Forecast by Country (2025-2032) & (K Units)
Table 119. Europe GaN on Silicon Technology Market Size Forecast by Country (2025-2032) & (M USD)
Table 120. Asia Pacific GaN on Silicon Technology Sales Forecast by Region (2025-2032) & (K Units)
Table 121. Asia Pacific GaN on Silicon Technology Market Size Forecast by Region (2025-2032) & (M USD)
Table 122. South America GaN on Silicon Technology Sales Forecast by Country (2025-2032) & (K Units)
Table 123. South America GaN on Silicon Technology Market Size Forecast by Country (2025-2032) & (M USD)
Table 124. Middle East and Africa GaN on Silicon Technology Consumption Forecast by Country (2025-2032) & (Units)
Table 125. Middle East and Africa GaN on Silicon Technology Market Size Forecast by Country (2025-2032) & (M USD)
Table 126. Global GaN on Silicon Technology Sales Forecast by Type (2025-2032) & (K Units)
Table 127. Global GaN on Silicon Technology Market Size Forecast by Type (2025-2032) & (M USD)
Table 128. Global GaN on Silicon Technology Price Forecast by Type (2025-2032) & (USD/Unit)
Table 129. Global GaN on Silicon Technology Sales (K Units) Forecast by Application (2025-2032)
Table 130. Global GaN on Silicon Technology Market Size Forecast by Application (2025-2032) & (M USD)
List of Figures
Figure 1. Product Picture of GaN on Silicon Technology
Figure 2. Data Triangulation
Figure 3. Key Caveats
Figure 4. Global GaN on Silicon Technology Market Size (M USD), 2026-2034
Figure 5. Global GaN on Silicon Technology Market Size (M USD) (2026-2034)
Figure 6. Global GaN on Silicon Technology Sales (K Units) & (2026-2034)
Figure 7. Evaluation Matrix of Segment Market Development Potential (Type)
Figure 8. Evaluation Matrix of Segment Market Development Potential (Application)
Figure 9. Evaluation Matrix of Regional Market Development Potential
Figure 10. GaN on Silicon Technology Market Size by Country (M USD)
Figure 11. GaN on Silicon Technology Sales Share by Manufacturers in 2023
Figure 12. Global GaN on Silicon Technology Revenue Share by Manufacturers in 2023
Figure 13. GaN on Silicon Technology Market Share by Company Type (Tier 1, Tier 2 and Tier 3): 2023
Figure 14. Global Market GaN on Silicon Technology Average Price (USD/Unit) of Key Manufacturers in 2023
Figure 15. The Global 5 and 10 Largest Players: Market Share by GaN on Silicon Technology Revenue in 2023
Figure 16. Evaluation Matrix of Segment Market Development Potential (Type)
Figure 17. Global GaN on Silicon Technology Market Share by Type
Figure 18. Sales Market Share of GaN on Silicon Technology by Type (2019-2025)
Figure 19. Sales Market Share of GaN on Silicon Technology by Type in 2023
Figure 20. Market Size Share of GaN on Silicon Technology by Type (2019-2025)
Figure 21. Market Size Market Share of GaN on Silicon Technology by Type in 2023
Figure 22. Evaluation Matrix of Segment Market Development Potential (Application)
Figure 23. Global GaN on Silicon Technology Market Share by Application
Figure 24. Global GaN on Silicon Technology Sales Market Share by Application (2019-2025)
Figure 25. Global GaN on Silicon Technology Sales Market Share by Application in 2023
Figure 26. Global GaN on Silicon Technology Market Share by Application (2019-2025)
Figure 27. Global GaN on Silicon Technology Market Share by Application in 2023
Figure 28. Global GaN on Silicon Technology Sales Growth Rate by Application (2019-2025)
Figure 29. Global GaN on Silicon Technology Sales Market Share by Region (2019-2025)
Figure 30. North America GaN on Silicon Technology Sales and Growth Rate (2019-2025) & (K Units)
Figure 31. North America GaN on Silicon Technology Sales Market Share by Country in 2023
Figure 32. U.S. GaN on Silicon Technology Sales and Growth Rate (2019-2025) & (K Units)
Figure 33. Canada GaN on Silicon Technology Sales (K Units) and Growth Rate (2019-2025)
Figure 34. Mexico GaN on Silicon Technology Sales (Units) and Growth Rate (2019-2025)
Figure 35. Europe GaN on Silicon Technology Sales and Growth Rate (2019-2025) & (K Units)
Figure 36. Europe GaN on Silicon Technology Sales Market Share by Country in 2023
Figure 37. Germany GaN on Silicon Technology Sales and Growth Rate (2019-2025) & (K Units)
Figure 38. France GaN on Silicon Technology Sales and Growth Rate (2019-2025) & (K Units)
Figure 39. U.K. GaN on Silicon Technology Sales and Growth Rate (2019-2025) & (K Units)
Figure 40. Italy GaN on Silicon Technology Sales and Growth Rate (2019-2025) & (K Units)
Figure 41. Russia GaN on Silicon Technology Sales and Growth Rate (2019-2025) & (K Units)
Figure 42. Asia Pacific GaN on Silicon Technology Sales and Growth Rate (K Units)
Figure 43. Asia Pacific GaN on Silicon Technology Sales Market Share by Region in 2023
Figure 44. China GaN on Silicon Technology Sales and Growth Rate (2019-2025) & (K Units)
Figure 45. Japan GaN on Silicon Technology Sales and Growth Rate (2019-2025) & (K Units)
Figure 46. South Korea GaN on Silicon Technology Sales and Growth Rate (2019-2025) & (K Units)
Figure 47. India GaN on Silicon Technology Sales and Growth Rate (2019-2025) & (K Units)
Figure 48. Southeast Asia GaN on Silicon Technology Sales and Growth Rate (2019-2025) & (K Units)
Figure 49. South America GaN on Silicon Technology Sales and Growth Rate (K Units)
Figure 50. South America GaN on Silicon Technology Sales Market Share by Country in 2023
Figure 51. Brazil GaN on Silicon Technology Sales and Growth Rate (2019-2025) & (K Units)
Figure 52. Argentina GaN on Silicon Technology Sales and Growth Rate (2019-2025) & (K Units)
Figure 53. Columbia GaN on Silicon Technology Sales and Growth Rate (2019-2025) & (K Units)
Figure 54. Middle East and Africa GaN on Silicon Technology Sales and Growth Rate (K Units)
Figure 55. Middle East and Africa GaN on Silicon Technology Sales Market Share by Region in 2023
Figure 56. Saudi Arabia GaN on Silicon Technology Sales and Growth Rate (2019-2025) & (K Units)
Figure 57. UAE GaN on Silicon Technology Sales and Growth Rate (2019-2025) & (K Units)
Figure 58. Egypt GaN on Silicon Technology Sales and Growth Rate (2019-2025) & (K Units)
Figure 59. Nigeria GaN on Silicon Technology Sales and Growth Rate (2019-2025) & (K Units)
Figure 60. South Africa GaN on Silicon Technology Sales and Growth Rate (2019-2025) & (K Units)
Figure 61. Global GaN on Silicon Technology Production Market Share by Region (2019-2025)
Figure 62. North America GaN on Silicon Technology Production (K Units) Growth Rate (2019-2025)
Figure 63. Europe GaN on Silicon Technology Production (K Units) Growth Rate (2019-2025)
Figure 64. Japan GaN on Silicon Technology Production (K Units) Growth Rate (2019-2025)
Figure 65. China GaN on Silicon Technology Production (K Units) Growth Rate (2019-2025)
Figure 66. Global GaN on Silicon Technology Sales Forecast by Volume (2026-2034) & (K Units)
Figure 67. Global GaN on Silicon Technology Market Size Forecast by Value (2026-2034) & (M USD)
Figure 68. Global GaN on Silicon Technology Sales Market Share Forecast by Type (2025-2032)
Figure 69. Global GaN on Silicon Technology Market Share Forecast by Type (2025-2032)
Figure 70. Global GaN on Silicon Technology Sales Forecast by Application (2025-2032)
Figure 71. Global GaN on Silicon Technology Market Share Forecast by Application (2025-2032)