GaN and SiC Power Semiconductor Market Overview
The power semiconductor is the core of electronic device electrical energy conversion and circuit control. In essence, it uses the unidirectional conductivity of the semiconductor to realize the function of power switch and power conversion. Whether it is hydropower, nuclear power, thermal power or wind power, or even the chemical energy provided by various batteries, most of them cannot be directly used. More than 75% of the electrical energy applications require power conversion by power semiconductor devices before they can be used by equipment.
This report provides a deep insight into the global GaN and SiC Power Semiconductor market covering all its essential aspects. This ranges from a macro overview of the market to micro details of the market size, competitive landscape, development trend, niche market, key market drivers and challenges, SWOT analysis, value chain analysis, etc.
The analysis helps the reader to shape the competition within the industries and strategies for the competitive environment to enhance the potential profit. Furthermore, it provides a simple framework for evaluating and accessing the position of the business organization. The report structure also focuses on the competitive landscape of the Global GaN and SiC Power Semiconductor Market, this report introduces in detail the market share, market performance, product situation, operation situation, etc. of the main players, which helps the readers in the industry to identify the main competitors and deeply understand the competition pattern of the market.
In a word, this report is a must-read for industry players, investors, researchers, consultants, business strategists, and all those who have any kind of stake or are planning to foray into the GaN and SiC Power Semiconductor market in any manner.
GaN and SiC Power Semiconductor Market Analysis:
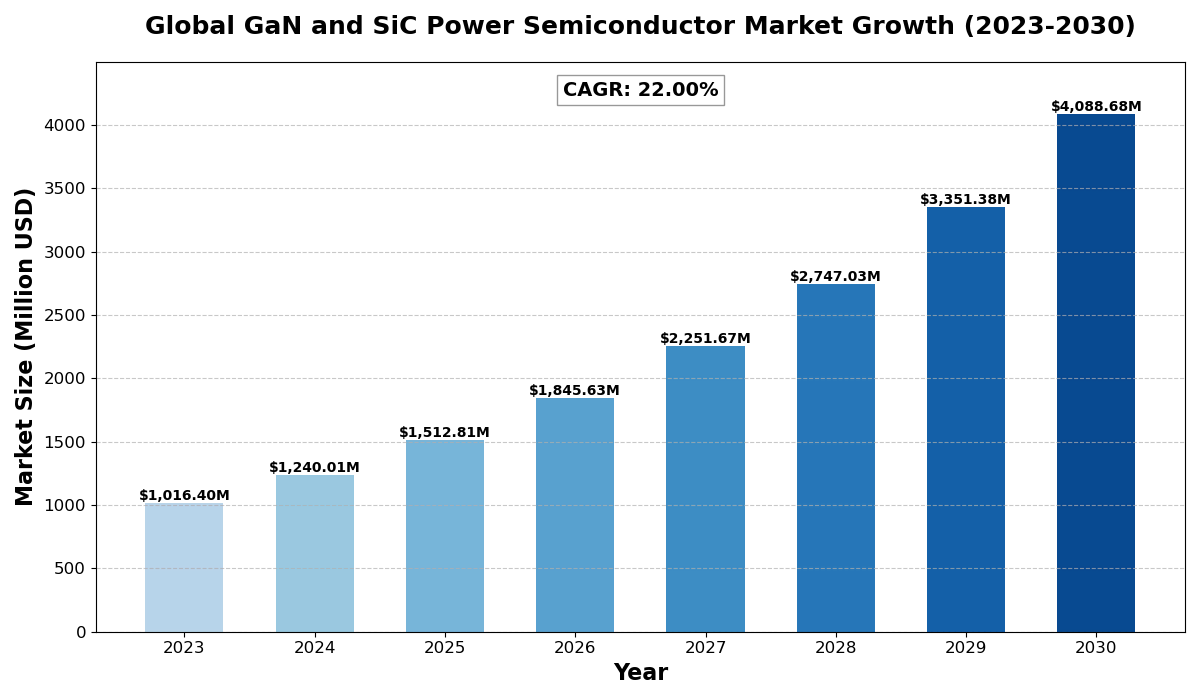
The global GaN and SiC Power Semiconductor Market size was estimated at USD 1016.40 million in 2023 and is projected to reach USD 4088.68 million by 2030, exhibiting a CAGR of 22.00% during the forecast period.
North America GaN and SiC Power Semiconductor market size was USD 264.84 million in 2023, at a CAGR of 18.86% during the forecast period of 2025 through 2030.
GaN and SiC Power Semiconductor Key Market Trends :
- Rapid Adoption in Electric Vehicles (EVs): GaN and SiC semiconductors are increasingly used in EV powertrains and charging infrastructure, offering higher efficiency and reduced energy losses.
- Growing Demand for Renewable Energy: With the rising focus on sustainable energy sources like solar and wind, power semiconductor devices play a crucial role in energy conversion and grid integration.
- Advancements in 5G and High-Frequency Applications: The expansion of 5G networks and advanced communication systems is driving demand for GaN-based semiconductors due to their superior performance at high frequencies.
- Increased Investment in Industrial Automation: Industries are adopting SiC and GaN power devices to enhance the efficiency of motor drives, robotics, and automated production lines.
- Surging Demand for Compact and Energy-Efficient Power Supplies: With a growing emphasis on energy efficiency, GaN and SiC semiconductors are revolutionizing power supply designs for consumer electronics and data centers.
GaN and SiC Power Semiconductor Market Regional Analysis :

North America:
Strong demand driven by EVs, 5G infrastructure, and renewable energy, with the U.S. leading the market.
Europe:
Growth fueled by automotive electrification, renewable energy, and strong regulatory support, with Germany as a key player.
Asia-Pacific:
Dominates the market due to large-scale manufacturing in China and Japan, with growing demand from EVs, 5G, and semiconductors.
South America:
Emerging market, driven by renewable energy and EV adoption, with Brazil leading growth.
Middle East & Africa:
Gradual growth, mainly due to investments in renewable energy and EV infrastructure, with Saudi Arabia and UAE as key contributors.
GaN and SiC Power Semiconductor Market Segmentation :
The research report includes specific segments by region (country), manufacturers, Type, and Application. Market segmentation creates subsets of a market based on product type, end-user or application, Geographic, and other factors. By understanding the market segments, the decision-maker can leverage this targeting in the product, sales, and marketing strategies. Market segments can power your product development cycles by informing how you create product offerings for different segments.
Key Company
- Mitsubishi Electric Corporation
- Infineon Technologies AG
- ROHM Semiconductor
- NXP Semiconductors
Market Segmentation (by Type)
- SiC Power Module
- GaN Power Module
- Discrete SiC
- Discrete GaN
Market Segmentation (by Application)
- Power supplies
- Industrial motor drives
- PV inverters
- Traction
Market Drivers
- High Efficiency and Performance Benefits: GaN and SiC semiconductors offer better thermal management, lower energy losses, and faster switching speeds compared to traditional silicon-based devices.
- Rise in Electric Vehicles and Charging Infrastructure: The increasing adoption of EVs is boosting demand for high-power semiconductor solutions to improve energy efficiency and battery performance.
- Expansion of Renewable Energy Projects: Governments and businesses are investing heavily in solar and wind power, where power semiconductor devices are essential for energy conversion and grid stability.
Market Restraints
- High Manufacturing Costs: The production process for GaN and SiC semiconductors is more expensive compared to traditional silicon, limiting adoption in cost-sensitive markets.
- Limited Availability of Raw Materials: The supply chain for SiC wafers and GaN substrates is still developing, leading to potential shortages and price volatility.
- Complex Design and Integration Challenges: Engineers need specialized knowledge to design and integrate GaN and SiC components into existing power systems, slowing down mass adoption.
Market Opportunities
- Growing Investments in Smart Grid Technology: The modernization of power grids worldwide is creating new opportunities for GaN and SiC devices in energy distribution and management.
- Emerging Applications in Aerospace and Defense: These semiconductors are increasingly used in radar systems, satellites, and power systems for military applications, opening new revenue streams.
- Technological Advancements Reducing Costs: Ongoing research and innovation are making GaN and SiC production more cost-effective, encouraging wider adoption across industries.
Market Challenges
- Strong Competition from Silicon-Based Alternatives: Silicon power semiconductors remain dominant due to their lower cost and established market presence.
- Limited Standardization in the Industry: The lack of uniform industry standards for GaN and SiC components can create compatibility and regulatory challenges.
- Reliability and Longevity Concerns: While promising, GaN and SiC technologies are still being optimized for long-term reliability in demanding applications.
GaN and SiC Power Semiconductor Market Recent Development :
Wolfspeed’s $5 Billion SiC Manufacturing Facility Nears Completion
Date: February 5, 2025
Overview: Wolfspeed, a Durham-based semiconductor manufacturer, is finalizing its $5 billion factory in Chatham County, North Carolina. The facility is set to produce silicon carbide crystals for electric vehicles, with full occupancy expected by March and production commencing in June. This expansion aligns with Wolfspeed’s strategy to meet the growing demand for SiC components in the EV industry.
Infineon’s Breakthrough in GaN Chip Production
Date: September 11, 2024
Overview: German semiconductor company Infineon announced a significant advancement in producing gallium nitride chips on 300mm wafers. This innovation is anticipated to lower production costs and enhance the competitiveness of GaN chips against traditional silicon counterparts. Infineon aims to capture a substantial share of the GaN chip market, projected to reach several billion dollars by the decade’s end.
Morgan Advanced Materials Faces Revenue Decline Amid Trade Tariff Concerns
Date: February 28, 2025
Overview: UK-based Morgan Advanced Materials, a supplier of semiconductor components, anticipates a reduction in organic revenue due to uncertain demand exacerbated by trade tariff threats. The company has observed a slowdown in demand for products used in silicon carbide power semiconductor production, particularly with a weakening electric vehicle market in the U.S.
UK’s Potential in Compound Semiconductors
Date: January 10, 2025
Overview: The UK is identified as having significant opportunities in the semiconductor industry, especially in compound semiconductors like silicon carbide and gallium nitride. These materials are gaining traction in automotive and industrial markets due to their lower power consumption and superior performance. Strategic planning and investment could position the UK as a competitive player in this expanding sector.
Key Benefits of This Market Research:
- Industry drivers, restraints, and opportunities covered in the study
- Neutral perspective on the market performance
- Recent industry trends and developments
- Competitive landscape & strategies of key players
- Potential & niche segments and regions exhibiting promising growth covered
- Historical, current, and projected market size, in terms of value
- In-depth analysis of the GaN and SiC Power Semiconductor Market
- Overview of the regional outlook of the GaN and SiC Power Semiconductor Market:
Key Reasons to Buy this Report:
- Access to date statistics compiled by our researchers. These provide you with historical and forecast data, which is analyzed to tell you why your market is set to change
- This enables you to anticipate market changes to remain ahead of your competitors
- You will be able to copy data from the Excel spreadsheet straight into your marketing plans, business presentations, or other strategic documents
- The concise analysis, clear graph, and table format will enable you to pinpoint the information you require quickly
- Provision of market value (USD Billion) data for each segment and sub-segment
- Indicates the region and segment that is expected to witness the fastest growth as well as to dominate the market
- Provides insight into the market through Value Chain
- Market dynamics scenario, along with growth opportunities of the market in the years to come
- 6-month post-sales analyst support
Customization of the Report
In case of any queries or customization requirements, please connect with our sales team, who will ensure that your requirements are met.
FAQs
Q: What are the key driving factors and opportunities in the GaN and SiC Power Semiconductor market?
A: The market is driven by increasing adoption in EVs, renewable energy, and industrial automation. Opportunities exist in smart grids, aerospace, and defense applications.
Q: Which region is projected to have the largest market share?
A: Asia-Pacific is expected to lead due to strong demand from China, Japan, and South Korea, fueled by advancements in EVs and consumer electronics.
Q: Who are the top players in the global GaN and SiC Power Semiconductor market?
A: Leading companies include Mitsubishi Electric Corporation, Infineon Technologies AG, ROHM Semiconductor, and NXP Semiconductors.
Q: What are the latest technological advancements in the industry?
A: Innovations include improved SiC wafer production, GaN-on-silicon technology, and enhanced thermal management solutions for higher efficiency.
Q: What is the current size of the global GaN and SiC Power Semiconductor market?
A: The market was valued at USD 1016.40 million in 2023 and is projected to reach USD 4088.68 million by 2030, growing at a CAGR of 22.00%.

Get Sample Report PDF for Exclusive Insights
Report Sample Includes
- Table of Contents
- List of Tables & Figures
- Charts, Research Methodology, and more...


